All Things Statistical
Thanks for at least pointing out some indicators which are new to me. Always good to learn something new.
Thanks for at least pointing out some indicators which are new to me. Always good to learn something new.
Welcome. In this new age and day, learning is considered an easy part for everyone considering that there's an endless amount of stuff to absorb given so much info. I'm currently also trying to learn alot too, but the hard part is not knowing if one is learning in the right direction & learning relevantly for the correct application.
In any case, look at this video on randomness which i just saw. My 1st reaction was what the....... It's OMG AWESOME RANDOMNESS MACHINE!!!!
IFA.tv - Probability Machine, Galton Board, Randomness and Fair Price Simulator, Quincunx - YouTube
Yours sincerely,
Wintersky
Nice thread. Thanks 
Kurtosis Part 1: A Meaningful Interpretation
Hi,
Even the meaning of kurtosis itself is subject to multiple interpretations:
1st Interpretation: Tall & Sharp Peaks relative to the Gaussian Distribution
2nd Interpretation: Long Tails relative to the Gaussian distribution
3rd Interpretation: Low Peaks + Long Tails relative to the Gaussian Distribution
Multiple works refer to kurtosis definition as the 1st interpretation, textbooks included. Though it has become increasingly understood that kurtosis should be more correctly seen from 2 components: low central peaks & long tails extents considered together.
Additionally, Kurtosis should NOT be seen as a scaled measure of variance itself. Kurtosis is a scale-free measure of variance. For proper calculation of kurtosis, the distribution needs to be compared to a Gaussian distribution with the same variance.
So, stuff to note whenever looking at publicly-stated kurtosis values, is to look at the kurtosis construction formula as they are all not equivalent. The 1st document below is an introductory statistics document which uses the 1st definition (as an example of a confused article), while the 2nd document is an excellent old document written in great detail about the confusion of kurtosis. A must-read IMHO, for i've not seen any other article that examines the confusion arenas in such great detail.
Looking forward to everyone to chip in their views on statistical methods, be it ranging from co-integration to anything obscure. I have weak mathematical background, so looking forward to any views available.
Yours sincerely,
Wintersky
2 Tailed & 1 Tailed Tests
One- and two-tailed tests - Wikipedia, the free encyclopedia
Lady tasting tea - Wikipedia, the free encyclopedia
One sided-Gaussian Indicator/OSG: https://www.mql5.com/en/forum/general
Compared to many other statistical indicators already coded on TSD like Ehlers Fisher Transform or Binary Entropy, only OSG is the only one-tailed test so far. The benefit of a one-tailed test being that it gives rise to less Type 2 statistical error at increased Type 1 error.
Type I and type II errors - Wikipedia, the free encyclopedia
Type 1 Error: A false positive.
Type 2 Error: A false negative.
In short, using the One-Sided Gaussian indicator allows for faster detection of a continuous movement in one direction, but tradeoff being increased possibility of being wrong that the movement is not statistically significant (& hence price doesnt move in the same continuous direction as expected).
The personal conclusion i'm drawing here is that one-tailed tests can be more system-efficient & used if there are other indicators that confirm a similar direction, due to the presence of increased Type 1 error. An alternative possibility mentioned by some statisticians is to combine a 2 tailed-test followed by a one-tailed test.
What statistical/non-statistical tools here would give a good complement to such a one-tailed test in a combined system? What do you think?
Yours sincerely,
Wintersky
Why Moving Averages
Not sure where to put this as this is an interesting read, so here goes:
From Quantivity
Why Moving Averages | Quantivity
Moving averages are a ubiquitous tool in financial econometrics, especially dominant in bothtechnical analysis and high-frequency trading. Given the sophistication of both disciplines, one is inclined to beg the question why such a seemingly trivial statistical technique as moving averages form a core of their foundation.
One explanation is due to a beautiful mathematical result, which has significant implication for building trading systems.
Consider the standard moving average of order one:
This model has zero covariance with any time-shifted version of itself (formally,

has zeroautocovariance with non-unity lags). Combine this with a linearly deterministic process, whose value may be zero:
Now, extend the moving average lag to be of infinite-order, while retaining zero autocovariance:
Now comes the punchline, given those minimal assumptions: many price series for financial instruments can be represented by X, particularly those in high-frequency finance (namely, those which are zero-mean, autocovariance stationary white noise). In other words, many price series are generated by processes which are precisely moving averages. This is an elegant and unexpected theoretical result.
Why Moving Averages
Not sure where to put this as this is an interesting read, so here goes:
From Quantivity
Why Moving Averages | Quantivity
Moving averages are a ubiquitous tool in financial econometrics, especially dominant in bothtechnical analysis and high-frequency trading. Given the sophistication of both disciplines, one is inclined to beg the question why such a seemingly trivial statistical technique as moving averages form a core of their foundation.
One explanation is due to a beautiful mathematical result, which has significant implication for building trading systems.
Consider the standard moving average of order one:
This model has zero covariance with any time-shifted version of itself (formally,
has zeroautocovariance with non-unity lags). Combine this with a linearly deterministic process, whose value may be zero:
Now, extend the moving average lag to be of infinite-order, while retaining zero autocovariance:
That implies that many price series are not random at all. If that is so, no wonder that retail traders are on the losing side
Some interesting reading here-
Does the 200 day moving average "work"? - Adam H Grimes
and here....
Fooled by Randomness Through Selection Bias | Price Action Lab Blog
and here
Market Statistics | Price Action Lab Blog
I think traders underestimate randomness in general. Markets are more efficient than ever so any edge from simple technical tools are long gone. Retail traders end up on the wrong side most of the time for many reasons. Yes, there are moments where certain patterns work but it takes a lot of experience and some luck.
I think traders underestimate randomness in general. Markets are more efficient than ever so any edge from simple technical tools are long gone. Retail traders end up on the wrong side most of the time for many reasons. Yes, there are moments where certain patterns work but it takes a lot of experience and some luck.
Indeed. I recalled reading before a report comparing efficiency of old indicators like stochastics, MACD from the time of ticker tapes in the 70s to the current decade. It was generally deemed that the efficiency dropped from 70+% to about 55%+ or so.
Probably the original pure usage of the old indicators doesnt give much edge anymore. But some slight refinements or different ways of usage might help. The link below illustrates how machine learning nowadays is done on stochastics for an edge. The usage of high, low and close is still highly relevant, but we might have to modify them slightly for better efficiency
Intelligent Trading: IBS reversion edge with QuantShare
There was also another really comprehensive one-of-a-kind study done on Candlesticks afew years ago with rigorous statistical testing via significance etc that showed that about up to afew % edge can be extracted from pure Candlesticks usage (Unfortunately i do not have the link anymore)
With regards to fractal attractors, idealised fractals dont exist in nature and i doubt so for the financial markets, though non-persistent fractals/structures might occur time to time as The Predictors seem to imply:
Intelligent Trading: Chaos in the Financial Markets?
Wintersky 
Thanks Wintersky for the links. It is interesting that the article on machine learning is discussing IBS or what used to be known as close location value. As simple as it is, I used it as an input to the SVM's that I discussed a few years ago in the advanced elite section along with a pair of 2 pole filters and it did improve forecasting accuracy at the time.
A couple of months ago, I did run some tests again after not using it for a while and the results were mixed. I guess the moral of the story is that if you find an edge, you have to milk it for all that its got at the time because most probably it is not going to last for long.
Edit: Just read the discussion "New revolutionary way of datamining"... what Jaffray Woodriff claims is the worst mistake in datamining is exactly how I do it: Lol! I will have to see what he suggests or even if I understand his answer!
Edit2: After reading some more.... Hell...why wouldn't you cherry pick the one that does best out of sample? I guess you could use an averaging approach but in the real world one does not have the resources to take bets on second or third best models.
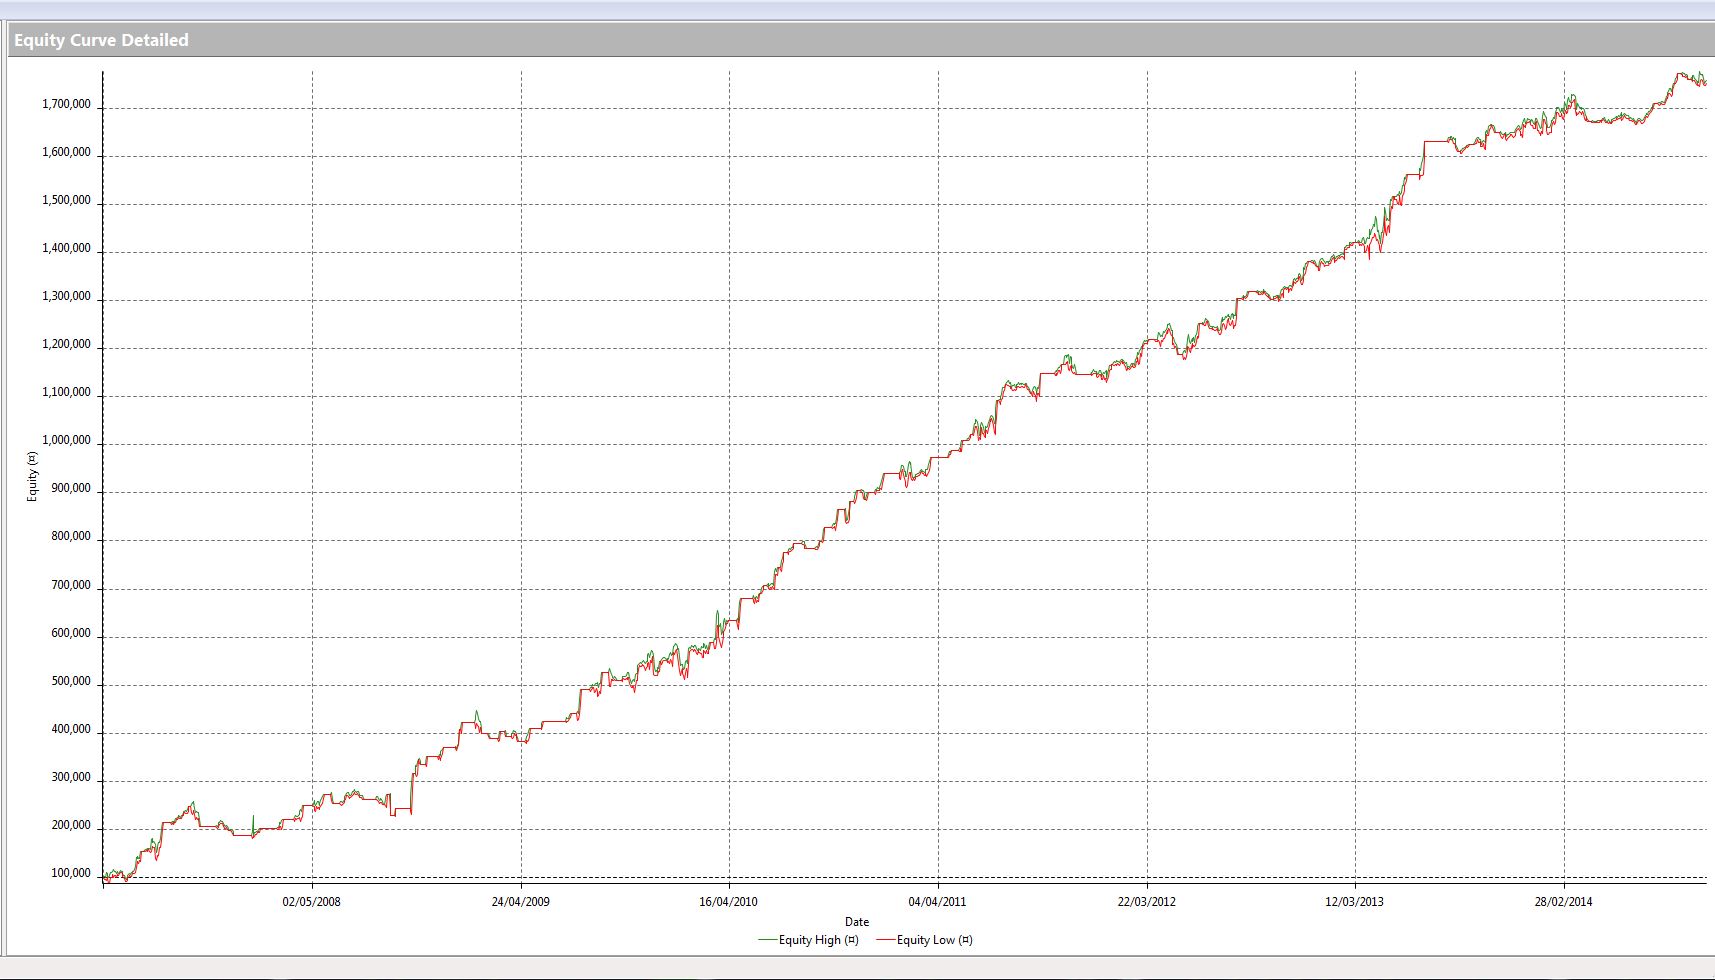
Sorry...but ....I see smoke being blown in that article. You would never start building a trading system around a model with a mediocre equity curve.
- Free trading apps
- Over 8,000 signals for copying
- Economic news for exploring financial markets
You agree to website policy and terms of use
Hi,
Was looking everywhere for a general statistical thread for discussion of everything statistical along with a review of statistical indicators. Already, we have a Digital Filters Thread on frequency filters & a John Ehlers Indicators Thread & Cycles analysis. But the discussion of statistical stuff has been largely limited with not much mention. I'm a statistical newbie so it's good to hear varied and differing viewpoints. So i'll kick off my personal viewpoints by reviewing certain indicators available on TSD of which i'm currently interested in and investigating, so feel free to debate/correct me, as i believe a good intellectual environment is borne out of deep discussion:
=============================================================
1. Binary Entropy Indicator: Binary entropy function - Wikipedia, the free encyclopedia
The indicator idea comes from information entropy, quantifying the amount of information available. Based on my personal research, one thing that is not made explicit is the fact that the function is not an exact Gaussian distribution, but is a sampled Gaussian distribution of sorts. Concept is good, but doesnt seem efficient perhaps. Still thinking about what further indicator modification could be done here.
2. Ehlers Fisher Transform: Fisher transformation - Wikipedia, the free encyclopedia & Applying The Fisher Transform and Inverse Fisher Transform to Markets Analysis in MetaTrader 5 - MQL5 Articles
Fisher transform does variance stabilization & requires a Bi-variate normal distribution for both variables. Prices are bounded within a price range to achieve basic stationary signals before transformation is done. Sharp signals is a good point for this indicator. Will more specific frequency analysis via Z-transform via Laguerre be a better method instead?
3. Skewness & Excess Kurtosis: Kurtosis - Wikipedia, the free encyclopedia
AKA the Third and Fourth moments respectively. Only thing is, do the moments even exist in the 1st place? Is there a convergence even loosely speaking?
4. Estimators: Estimator - Wikipedia, the free encyclopedia
Currently what appears to me as most promising. Thanks for Mladen's coding help so far (& to come= )
)
========================================================
So statistically, what have any of you found useful so far? Feel free to share your thoughts & your favorite statistical indicators.
Yours sincerely,
Wintersky