Analytical Review of the Stocks of Alphabet Inc.
Alphabet Inc., #GOOG [NASD]
Technologies, Internet information providers, USA
Financial performance of the company:
Index – S&P 500;
Beta – 0.89;
Capitalization – 550.00 В;
Return on asset – 11.81%;
Income – 66.01 В;
Average volume – 2.13 М.
P/E – 30.65.
ATR – 23.89.
Analytical review:
- Since the middle of February the rise in the company’s stocks has exceeded 9.5%. It is expected that the price will continue to rise.
- According to the last report company’s revenue in the fiscal year 2015 has grown 13.6% up toо 74.99 billion USD, which was above analysts’ forecast. EPS rose by 14.6% from 41.14 USD to 47.18 USD.
- On 11 March the company presented a new version of “Android N”. Software of which contains split screen. The battery life has also been increased. Company’s executives plan to continue improvement of the software before the device is brought into circulation.
- The company invests large money to the project “Alphabet`s X”, which aimed at developing balloons that will be able to fly around the Earth, and which will be provided with the global access to wi-fi.
- Over 70% of the company’s shares belong to institutional investors. Most of the shares belong to Vanguard Group (5.06%) and FMR, LLC (4.60%).
- Most of the large investment banks and funds (UBS, Deutsche Bank, RBC Capital) predict the rise in the price of company’s shares up to 850 USD.
Summary:
- Company’s report for the fiscal year 2015 showed that company’s management is on the right track. Implementation of the company’s projects will increase the share of the company in the market sector. Most part of the company’s shares belong to institutional investors. Large investors expect that the company’s stock will go up.
- It is likely that in the near future company’s quotes will go up.
Trading tips for CFD of Alphabet Inc.
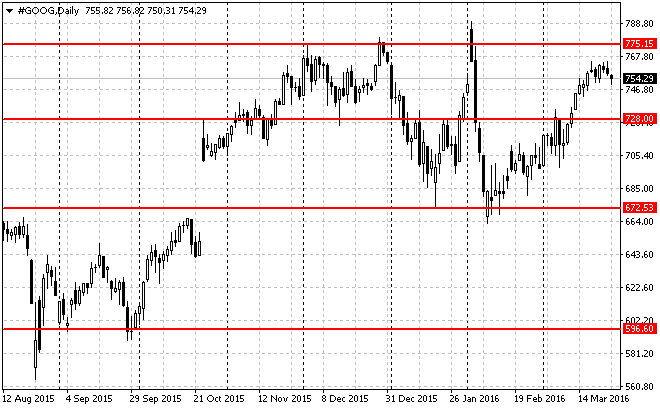
Long-term trading: the moment the issuer is traded at the resistance level of 775.15 USD. After breaking out and testing of this level and in case of the respective confirmation (such as pattern Price Action), we recommend to open long positions. Risk per trade is not more than 2% of the capital. Stop order can be placed slightly below the signal line. Take profit can be placed in parts at the levels of 800.00 USD, 825.00 USD and 850.00 USD with the use of trailing stop.

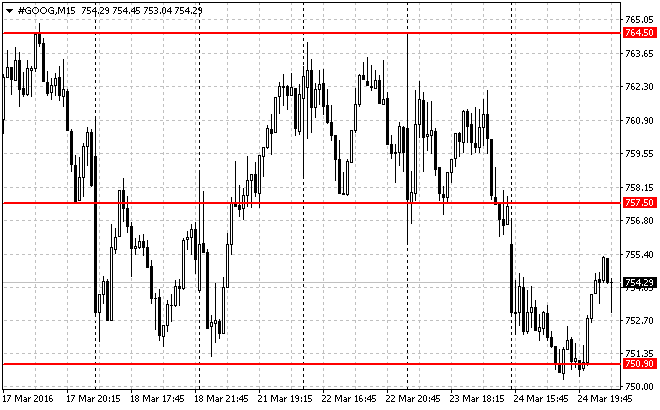
Short-term trading: on the chart with the timeframe 15M the issuer is traded between the local support and resistance levels of 750.90 - 757.50 USD. We recommend to enter the market after breaking out and testing of these levels. The positions can be opened near the signal line and the nearest support/resistance level. Risk per trade is not more than 3% of the capital. Stop order can be placed slightly above/below the signal line. Take profit can be placed in parts of 50%, 30% and 20% with the use of trailing stop.

The material has been provided by LiteForex - Finance Services Company - www.liteforex.com


