
Video manual: How to Trade - Chaikin Volatility Indicator, and Free to Downloads
14 May 2015, 09:11

0
688
- Created by stock analyst Marc Chaikin, a pioneer of the use of computers for stock analysis, recognized for developing the ADL
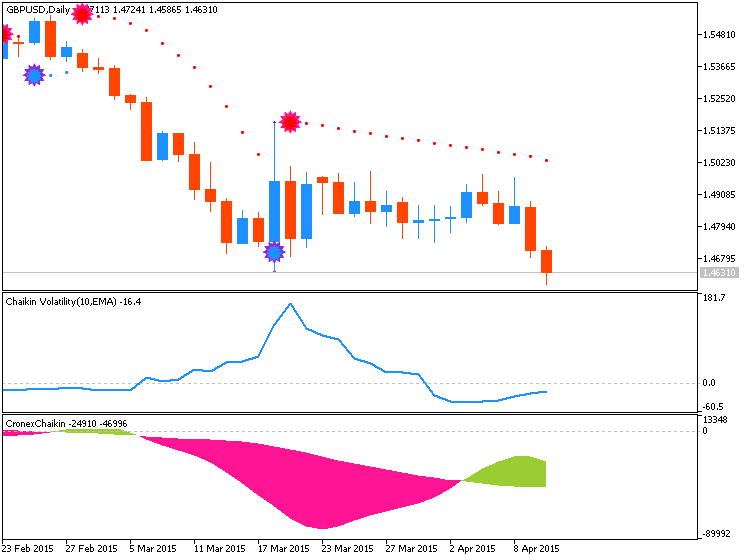
- Provides a reading of volatility based on the range between high and low prices, where a wider range means higher volatility
- Helps identify and anticipate bottoms and tops in price
- Use with a moving average system or price envelopes (doesn't take trading gapsinto account like Average True Range)
Basic signals:
- Increased volatility characteristic of market tops
- Decreased volatility characteristic of market bottoms
- Increase over short time = Bottom is near
- Decrease over long time = Approaching top
- As indicator peaks, market prices roll away from new summit and market turns flat
- A sharp decline in volatility means that the movement is slowing, and may signal a reversal
- The breakout from the range (a ranging market or flat indicator period) does not bring a significant rise in volatility until the price rises above the recent high
Calculate an exponential moving average (Chaikin recommends 10 days, although Forex sets it at 14) charting the difference between the price's High and Low in each period:
EMA [H-L]
Calculate the percentage of change in this moving average over a further period (here, 10 days):
( EMA [H-L] - EMA [H-L 10 days ago] ) / EMA [H-L 10 days ago] * 100
FREE TO DOWNLOADS
- Chaikin Volatility Index With a Smoothing Algorithm Selection - indicator for MetaTrader 5
- Chaikin Volatility (CHV) - indicator for MetaTrader 5
- Chaikin_Volatility - indicator for MetaTrader 5


