YouTube'dan Mağaza ile ilgili eğitici videoları izleyin
Bir ticaret robotu veya gösterge nasıl satın alınır?
Uzman Danışmanınızı
sanal sunucuda çalıştırın
sanal sunucuda çalıştırın
Satın almadan önce göstergeyi/ticaret robotunu test edin
Mağazada kazanç sağlamak ister misiniz?
Satış için bir ürün nasıl sunulur?
MetaTrader 5 için ücretsiz Uzman Danışmanlar ve göstergeler - 21

The Volume Plus indicator for MT5 can be effectively used for detecting imbalances in supply and demand.
The indicator improves on the typical volume histogram by coloring the bars.
Bar colors (colors are customizable):
Neutral - DimGray Wide Spread (Range) Bar on High Volume - MediumBlue Narrow Spread, High Volume - MidnightBlue Wide Spread, Low Volume - ForestGreen Narrow Spread, Low Volume - DarkGreen Very/Ultra Wide Spread, Low Volume - Aqua Narrow Spread, Ultra High Volume - Purple V
FREE

After purchasing, you can request and receive any two of my products for free!
После покупки вы можете запросить и получить два любых моих продукта бесплатно! Expert Advisor for manual and automatic trading on the trend lines of the indicator Bollinger Bands. The Expert Advisor draws trend lines from the middle band for a specified number of candles. Important!!! - you need to test the adviser in visual mode.
You may be interested in my other products: https://www.mql5.com/ru/users/vy
FREE

Introduction to GARCH Indicator GARCH is the short initial for Generalized Autoregressive Conditional Heteroskedasticity and it is the volatility prediction model commonly used in financial industry. GARCH model was first appeared in the work by Danish Economist, Tim Peter Bollerslev in 1986. The 2003 Nobel Prize winner, Robert F Engle also added much contribution for the refinement of GARCH model with Tim’s work. Our GARCH INM predictor took the original method of Nelder Mead for GARCH model bu
FREE

TİCARİ BAKİYE - YATIRIMCI ŞİFRE - KOPYA TİCARET - MT4 x MT5 CROSS PLATFORM
Not: Müşteri hesabının takip edeceği ana hesapta hem "Mirror Copier Master"a hem de ana hesabı takip edecek müşteri hesabında "Mirror Copier Client"a ihtiyacınız vardır.
Bloglar : https://www.mql5.com/en/blogs/post/756897
NASIL ÇALIŞIR :
https://www.youtube.com/watch?v=V7FNpuzrg5M
MT4 Sürümü
Usta : https://www.mql5.com/en/market/product/114774
Müşteri: https://www.mql5.com/en/market/product/114843
FREE

Did you ever feel irritated by manually adjusting Fibonacci retracement levels? Do you ever want to have a tool that was automatically adjust to certain Fibonacci levels with your trading? Well here is a tool for you: Fast Fibonacci indicator and Grid trader allows you to quickly adjust Fibonacci retracement levels or construct Fibonacci extension grid! You can also quickly setup your grid trading based on these levels - only with few clicks. Adjustable graphics, font sizes and graphics panels m
FREE

HM (Yatay İşaretleme), yatay seviyelerin manuel olarak işaretlenmesi için tasarlanmıştır. İşaretleme, seviyeyi ve fiyat değerini içerir. Hattın kalınlığı ve rengi ve fiyat değeri ayarlarda ayarlanır. Seviyeler yerel olarak zaman dilimlerine yerleştirilebilir veya tüm zaman dilimleri için herkese açık olarak gösterilebilir.
Onun işi çok basit:
1) - Seviyeyi işaretlemek için ayarlarda ayarladığımız tuşa basıyoruz;
2) - çizgiyi istenen yere getiriyoruz;
3) - Farenin sağ düğmesine tı
FREE

Three Bar Break is based on one of Linda Bradford Raschke's trading methods that I have noticed is good at spotting potential future price volatility. It looks for when the 1st bar's High is less than the 3rd bar's High as well as the 1st bar's Low to be higher than the 3rd bar's Low. This then predicts the market might breakout to new levels within 2-3 of the next coming bars. It should be used mainly on the daily chart to help spot potential moves in the coming days. Features :
A simple met
FREE

The Candle High Low Exit indicator uses the highest high and the lowest low of a range to draw trailing stop lines (orange under buys, magenta over sells) that advance with the trend until the trend changes direction. Moreover, the trailing stop lines are generated to support the order’s trend direction (long or short): In an upward trend, the long trailing stop line (orange line under buy) appears and advances upward until the close crosses under the line.
In a downward trend, the short tra
FREE
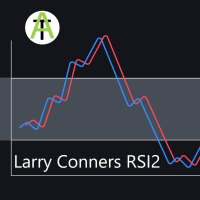
This MQL5 Expert Advisor is an adaption of the trading strategy made famous by trading legend Larry Conners. The EA essentially buys on the dips and sells on the rises. Buy Signal
Current candle is above the 55 EMA
RSI 2 period is below 10 Sell Signal
Current candle is below the 55 EMA
RSI 2 period is above 90 This strategy has been adapted into a scalping strategy. Default settings are for EURUSD 1H time-frame 2018/01/01 - 2020/05/30
FREE
Template name allows you to write custom text that will show up on your charts. It allows you to position the text anywhere including selecting any color that you prefer. You can position the text at any of the 4 corners of your chart screen. This custom text can aid as a watermark for your screen shots. This text can act as a unique and true signature for your charts.
FREE

Trading Signal for MetaTrader5 PC platform
The Signal is based on the Investologic EA trend strategy . Trend following indicator’s and oscillator’s, can work with any symbol or market in MT5 platform FOREX, GOLD, OIL, STOCKS, INDEXES, NASDAQ SPX500 The strategy
the strategy uses multi time frame combination of indicators and moving averages to find the best entry point wen the fast MA slow MA Crossover And Stochastic , RSI , Average Directional Movement Index ,combined together
FREE

Necessary for traders: tools and indicators Waves automatically calculate indicators, channel trend trading Perfect trend-wave automatic calculation channel calculation , MT4 Perfect trend-wave automatic calculation channel calculation , MT5 Local Trading copying Easy And Fast Copy , MT4 Easy And Fast Copy , MT5 Local Trading copying For DEMO Easy And Fast Copy , MT4 DEMO Easy And Fast Copy , MT5 DEMO
Can set the cycle for other varieties of K line graph covered this window, fluctuations obse
FREE

This indicator allows us to identify unusual volatility conditions.
If the ATR line is below the middle bollinger line, volatility is assumed to be below average. If the ATR line is above the middle bollinger line, volatility is assumed to be above average.
If the ATR line breaks the upper bollinger band, volatility is assumed to be high. If the ATR line breaks the lower bollinger band, volatility is assumed to be low.
FREE

Daily Monitoring : The indicator automatically calculates and displays the daily drawdown on your trading chart, allowing you to see how well you're performing on a daily basis. Risk Management : By monitoring daily drawdown, traders can better manage their risk. It helps to keep daily losses within acceptable limits. Real-Time Information : Daily drawdown is updated in real-time, providing accurate and up-to-date information about your trading performance. How to Use: Activate the "Daily Drawd
FREE

The Moving Average Slope (MAS) subtracts the moving average level n-periods ago from the current moving average level. This way, the trend of the moving average can be drawn on the moving average line.
Features Observe uptrends and downtrends at a glance. The indicator is non-repainting. Returns buffer values for the trend of the moving average to be used as part of an EA. (see below)
Inputs Moving Average Period : The period of the moving average (MA). Slope Period : Number of periods betwe
FREE

Basing Candles indicator is an automatic indicator that detects and marks basing candles on the chart. A basing candle is a candle with body length less than 50% of its high-low range. A basing candle or basing candlestick is a trading indicator whose body length is less than half of its range between the highs and lows. That's less than 50% of its range.
The indicator highlights the basing candles using custom candles directly in the main chart of the platform. The percentage criterion can be
FREE

MACD RSI THUNDER The idea behind this indicator was initially to be used on RSI_THUNDER EA that we have deveoped towards giving a more granular control of the trend direction and momentum in which, in order to correlate corretly with RSI indicator, it's required.
I have converted the indicator into a signal that can be passed and integrated to the RSI_THUNDER EA or you can use it your own way. It's here for you to use and abuse and we hope you enjoy the experience that it provides.
Support:
FREE
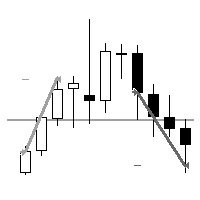
"AV Level EA MT5" is an Expert Advisor for the MetaTrader 5, which is intended exclusively for the german DAX (DE40, GE40, etc.) and is also available as a free version with MinLot to try out.
NEW: More ways to close, third entry.
Strategy:
- Level Trading, DAX M15 (also M5 or M30)
- Entry: Buy level 75, sell level 25
- Exits: TP = 25 (i.e. approx. 00 level) or TP = 50 (buy 75 level, sell 25 level)
- Second entry in the event of a reset, distance e.g. 25 or 50 (it does not ta
FREE

This software uses classical rules to the entry and exiting of the trades when trading using the ichimoku style. The EA trades in the current timeframe on the charts. According to testing results yielded more than $1k using the 1hr chart in the past year. The EA should not be expected to perform well when the price is ranging and too volatile. The best results should be achieved when the EA is turned on in the trending market only and under a solid money management plan. The results shown on the
FREE

This is a simple EA Can only open ONE trade EVER then MUST be reattached to the chart everytime you want to use it. Designed to help manual traders Has lot sizes and stops / targets in pips. For a buy trade the engulfing bar must close above the previous red bars high Includes Alarm and Phone notifications
Basically if you find a price zone you like and will take a trade if there is an engulfing bar . use this.
FREE

Trade in the opposite directions with HedgeTerminal HedgeTerminal is a full-featured trading terminal inside MetaTrader 5. This is a graphic panel resembling MetaTrader 4 terminal. It allows you to track oppositely directed positions in the manner it is possible in MetaTrader 4. In other words, we can open unlimited number of positions on a single symbol even if positions are in complete or partial hedge (lock). Thus, you can maintain long and short positions simultaneously, which is impossible
FREE

Points of Inertia, fiyat hareketlerinin ataletini hesaplama fikrine dayanan güçlü bir fiyat hareketinin kritik noktalarını tespit etme aracıdır.
_________________________________
Gösterge sinyalleri nasıl kullanılır:
Gösterge, yeni bir fiyat çubuğunun ortaya çıkmasından sonra bir sinyal oluşturur. Oluşturulan sinyalin, belirtilen yönde kritik bir noktaya çarptıktan sonra kullanılması önerilir. Gösterge sinyallerini yeniden çizmiyor.
_________________________________
Gösterge seçenekl
FREE

An Fast Bucks MT5 Expert Advisor combines the power of indicators and moving averages to create a robust trading strategy within the MetaTrader 5 platform. This expert advisor utilizes the Moving Average indicator in conjunction with a custom indicator (let's call it "CustomIndicator Expert Advisor") for enhanced decision-making in trading.
The Moving Average indicator serves as a foundational tool, offering insights into the market trend and potential entry/exit points based on the moving av
FREE

The ShowSessions indicator for MT5 shows up to two, self-selected, time intervals, for a free choosen number of days past and a few future days. Weekends are marked with an additional red vertical line. The indicator makes manuel backtesting of strategies more easily, but you can use ist for daily trading as well. Please note that the server time does not always correspond to the actual time.
FREE

I present the well-known Moving Average indicator connected to the ATR indicator.
This indicator is presented as a channel, where the upper and lower lines are equidistant from the main line by the value of the ATR indicator.
The indicator is easy to use. The basic settings of the moving average have been saved, plus the settings for the ATR have been added.
Moving Average Parameters:
MA period Shift MA Method
Moving Average Parameters:
ATR TF - from which timeframe the values are t
FREE

For those Price Action traders who love to trade strong Price points, like today's Opening Price (or even yesterday's Price), here is an indicator to ease the identification of those values, drawn directly on your chart! Opening Price will automatically draw a line showing you this point for you, AND, if you like any OPENing price in the past, not just today's price. A must-have in your Price Action toolbox!
SETTINGS
How many past days do you want to be drawn? Do you want to draw the current
FREE

Countdown timer till the bar closure, + % Progress status: My #1 Utility : includes 65+ functions | Contact me if you have any questions In the settings of the indicator, you can configure: Timeframe for Calulculation; true / false: Higher TimeFrame option (next from the currently used: M15->M30, H4->D1...) Position:
1 = Bottom Left corner;
2 = Bottom Right corner;
3 = Top Left corner;
4 = Top Right corner; Font Size; Color; Font Style;
FREE

This utility is designed to receive volumes from order books from larger crypto exchanges and transfer information to the indicator RealCryptoLevels . The RealCryptoLevels indicator by downloading the order book of crypt exchanges with maximum depth shows horizontal volumes of popular crypto currencies on the chart, so you can see not only the volumes, but also the levels and them strength (see screenshots), which is very important for successful trading in all strategies from scalping to m
FREE

The key to success is always good optimisation.
The system has a number of variables and in this case its simplicity is the key to its success. The system looks for the different "Gaps" as market entry failures and then debugs them through a stochastic analysis, i.e. the analysis of two moving averages to see if the price is overvalued or undervalued, and once this is done, the expert advisor will decide whether to perform an action or refrain from performing it. It is a very simple but power
FREE
This expert advisor can enter and exit trades at specific times and on specific weekdays, expressed in GMT Time. It offers weekday selection, trade management settings, a martingale function and money management features. [ Installation Guide | Update Guide | Troubleshooting | FAQ | All Products ] Easy to use and supervise Fully configurable entry and exit times (up to 5 trades)
Enable or disable trading weekdays in inputs
Customizable break-even, stop-loss, take-profit and trailing-stop setti
FREE
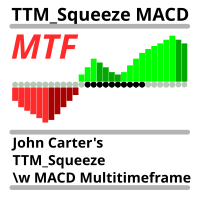
The same indicator as here https://www.mql5.com/ru/market/product/105089?source=Site+Market+My+Products+Page but with timeframe change possibility. It is convinient to see picture from different timeframes in the single chart. When using multiple timeframes, it is recommended (A.Elder "The new trading for a living") to adhere to a coefficient of 5 or 6. That is, the two older timeframes for a 5-minute chart will be 30 minutes and 3 hours.
FREE

SWISS BURGER
Kindly use this expert Advisor in Higher time Frame
HAI FRIENDS AM KARTHIK GOPALAKIRSHNAN Before going for Demo make sure the Your MT5 Broker. Every broker has different rules and regulation. when you going for demo. just change the different settings and try it I have used fixed lot size if you want you can change it. As per your wish.
FREE

Estratégia de negociação MACD O cálculo do MACD é executado uma vez a cada tick, e são considerados para fim de cálculo os três últimos resultados, para analisar o cruzamento da linha de zero, ou seja quando o último resultado for maior que 0 e o antepenúltimo não então há um cruzamento para cima e analogamente para baixo, quando um cruzamento é constatado o estado de uma variável de controle é alterado de "false" para "true", permitindo o abertura de uma posição caso a média de sinal também cru
FREE

Maximum Minimum Candle indicator is a basic indicator (but useful) that shows the highest and lowest candle in a period of time .
The indicator shows the maximum candle and the minimum candle for a defined period of time. You can choose the number of candles that make up the period The indicator will show with color points the maximum and minimum values. A message tells you when the price reaches the maximum or minimum.
Parameters number_of_candles: It is the number of candles that will b
FREE

Simple indicator to calculate fibonacci retracement levels on time. Add to chart and move trend line to set the fibonacci retracement levels. Inputs Levels - levels for which to calculate values, separated by space, default are fibonacci levels Show time - if true, time will be shown on levels Show date - if true, date will be shown on levels Show fibonacci level - if true, value of levels will be shown Fibonacci lines color - color of levels Trend line color - color of trend line which de
FREE

Smart Lot-Size Calculator And Trade Assistant for Mobile Trading Overview: This is the tool every trader in the market must have no matter if you are scalper, swing traders, day trader, or long term trader. This On-The-Go trading tool will help you stay disciplined and also stay free from daily trade management chores, Most traders face common problems like 1. Calculation of proper lot-size of a position to take controlled risk 2. Managing every trade and trailing stop-loss if trades goes in
FREE
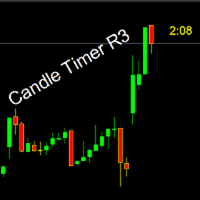
Timer remaining to finish the candle. A simple informative indicator of how much time is left until the current candle ends. In a simple, easy and objective way. In the input parameters, enter the desired color of the clock, the font size and the displacement to the right of the candle. I hope I helped with this useful and free tool. Make good use and good business.
FREE

To download MT4 version please click here . - This is vortex indicator. - It is used to detect trend strength and direction. - It consists of two line(buffers). ==> VIM and VIP - There are three types of signals related to this indicator: 1. crossing VIM and VIP 2. threshold on distance between VIP and VIM 3. VIP above VIM vice versa. - This is a non-repaint indicator with light processing.
FREE

A Unique Neural Network Model This project is a significant endeavor that uses an Expert Advisor (EA) to pinpoint the best times to enter and exit trades. This EA is unique because it uses a dataset trained by a neural network, rather than relying on traditional indicators to generate signals. The training data is specifically tailored to three Forex pairs, and it’s not recommended to apply it to other pairs. This decision was made due to the substantial memory space needed after training. The
FREE

This indicator calculates trend via two different moving averages and draw zigzag trend lines. You can change fast and slow Moving Averages settings for customization. Inputs:
Fast MA Time Period : 64 Fast MA Shift: 0 Fast MA Method: Smoothed Fast MA Apply To: Median Price Slow MA Time Period: 32 Slow MA Shift: 0 Slow MA Method: Smoothed Slow MA Apply To: Median Price ZigZag Color: Red ZigZag Type: DashDot ZigZag Width: VeryThin
FREE

Tick imbalance bars (TIB), described in the book Advances in Financial Machine Learning (2018) by Marcos López de Prado. Indicator that show candlestick bars with an different sampling method than time fixed. Real time data is sourced to the indicator and it may be used as substitute of the default graph. Each bar is formed when a predefined tick balance is exceeded, showing in the graph the OHLC of this cluster of ticks. The input variable is the amount of ticks of each bar. The indicator may
FREE

Fractals ST Patterns Strategy is a modification of Bill Williams' Fractals indicator. It allows setting any number of bars to find a fractal. This simple indicator corresponds to the parameters specified in the ST Patterns Strategy ( https://stpatterns.com/ ) . Structural Target Patterns are essentially the market itself, which is consistently divided into components. To form ST Patterns , no trend lines, geometric proportions of the model itself, trading volume or open market interest are neede
FREE

This indicator sums up the difference between the sells aggression and the buys aggression that occurred in each Candle, graphically plotting the waves of accumulation of the aggression volumes. Through these waves an exponential average is calculated that indicates the direction of the business flow.
Note: This indicator DOES NOT WORK for Brokers and/or Markets WITHOUT the type of aggression (BUY or SELL). Be sure to try our Professional version with configurable features and alerts: Agr
FREE

Multi-timeframe trend indicator based on the ADX / ADXWilder indicator with Fibonacci levels
The indicator shows trend areas using ADX or ADXWilder indicator data from multiple timeframes. The impulse mode of the indicator allows you to catch the beginning of a trend, and several "Screens" with different timeframes allow you to filter out market noise. Fibonacci levels are added to the price chart, which have flexible settings.
How the indicator works: if PDI is greater than NDI, then it`
FREE
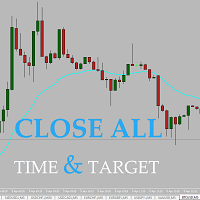
Easy and simple tool which close all trades in defined point of time. It can also close all open trades when opened positions reach defined target profit or stop loss.
For all pairs, indexes etc. Works with all instruments.
All types of orders. All charts.
Users inputs:
- close time (hour,min,sec)
- take profit (in users currency)
- stop loss (in users currency)
Save & Load settings option.
Fast, simple and reliable.
Check out other tools provided by our team!
FREE

Introducing the "Cybercycle Trend" Forex Oscillator, a powerful technical indicator designed to enhance your trading experience in the foreign exchange market. This innovative tool utilizes advanced algorithms to identify and analyze market trends, providing you with valuable insights and helping you make informed trading decisions.
The Cybercycle Trend Forex Oscillator is specifically designed to detect and measure cyclical price movements in the forex market. By incorporating this oscillato
FREE

ATR is a measure of volatility introduced by market technician J. Welles Wilder Jr. in his book, "New Concepts in Technical Trading Systems". In general, traders are accustomed to seeing the ATR in the form of a sub-window indicator. What I am presenting here is a simplified version of ATR - just the current ATR number - very useful for monitoring just the very moment of the current chart. If you want to monitor several timeframes in the same chart, just add the ATR Monitor indicator several tim
FREE
The USDJPY Trader EA is an automated trend following system that is always in the market and trades using sell stop and buy stop orders with trailing stop losses to capture large movements in the market. It also includes a money management feature which calculates lot size based on account size and risk with an option to set a maximum draw down at which the EA will stop trading. This is a long term strategy combined with money management and will work on any pair but works best on USDJPY M15. Vi
FREE

At first, I got my teeth into Dragon Ultra Expert Advisor. This Lesson is “Awesome”. In fact, It’s probably one of my best trading lessons I have ever written.
It took me at least 2 days of brain power and probably 20 coffees. Please pay it forward, share it with others. Enjoy.
Bruce Lee was arguably the best martial artist of all time, and guess what? He was not born the best martial artist of all time.
He earned that title through dedication and focus…he learned to become a MASTER of
FREE

Purpose DG DayInfo is a free indicator that shows information about: Day's maximum prices; Day's minimum prices; Day's percentual variations; Daily candle direction (Up, Down or Flat); Candle timer; This way, DG DayInfo helps you to see day's maximum and minimum, check day's percentual variation and time left to close candle.
Key features Designed to be simple to use, with a few parameters Works in ALL pairs Works within ALL time frames*
Main Indicator Parameters Days - Set to how many days
FREE

Что такое RSI? Индикатор RSI (Relative Strength Index, индекс относительной силы) — это индикатор, который измеряет соотношение восходящих и нисходящих движений. Расчет ведётся таким образом, что индекс выражается в диапазоне от 0 до 100. Как понять RSI?
Если значение RSI находится равно 70 и больше, считается, что инструмент находится в состоянии перекупленности (ситуация, когда цены выросли выше, нежели того ожидал рынок). Значение RSI на уровне 30 и ниже считается сигналом о том, что инст
FREE

The indicator makes calculations based on data obtained from one of seven (7) moving averages and colors the chart.
Simple moving averages are those that have only one important calculation parameter - the period.
The shift in the indicator is not used.
There is a shift trick setting, it is used to smooth the result of calculations. You can see the changes if you reduce this parameter to 1 (minimum value).
shift trick must always be less than the period value.
Available averages:
MA
FREE
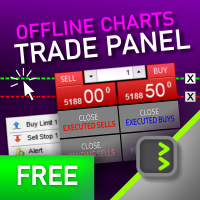
It is a panel that seems common, however, far beyond those of additional buttons for closing multiple orders, it is essential for those using the offline charts generators for Renko, Range, Ticks, and similars because in the Metatrader 5 does not allow the manual operation of orders in these charts that are generated synthetically. The "TRADE PANEL" makes it very easy to handle both orders executed to the market and the placing of pending orders, offering practically the same immediate acti
FREE
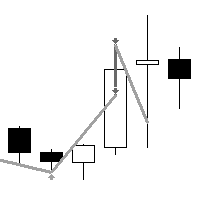
"AV BuyLow SellHigh EA" is an Expert Advisor for MetaTrader 5, which was created from the simple "AV Preview".
The original idea was to buy lower and sell higher from the last entry price. On request, I have developed it further and tried to remove its trend weakness. This EA is only the Minlot version to try out.
Strategy:
The size of a displayed rectangle is used to decide whether range trading is to be carried out (sell above, buy below) or trend trading (buy on rising, continue se
FREE

This indicator is a zero-lag indicator and displays exact trend as is. True Trend Moving Average Pro works best in combination with True Trend Oscillator Pro that displays strength of trend change.
True Trend Oscillator Pro: https://www.mql5.com/en/market/product/103589
If you set PERIOD input parameter to 1 this indicator becomes a sharpshooter for binary options.
Default input parameters: TT_Period = 10; TT_Meth = MODE_SMA; TT_Price = PRICE_MEDIAN;
Before you buy this product, please
FREE

ToolBot Probabilistic Analysis - FREE An effective indicator for your negotiations
The toolbot indicator brings the calculation of candles and a probabilistic analysis so that you have more security on your own.
Also test our FREE tops and bottoms indicator: : https://www.mql5.com/pt/market/product/52385#description Also test our FREE (RSI, ATR, ADX, OBV) indicator : https://www.mql5.com/pt/market/product/53448#description
Try our EA ToolBot for free: https://www.mql
FREE
Special Trailing Sl is a automatic trailing stop_loss. first It will try to free risk your trade then save the profits. first step is to move the SL 50 points below current price for long trades , and 50 points above current price for short trades.First step will happen when the trade get to minimum profit per point. second step : SL will follow the current price with a dynamic distance. This trailing stoploss has been used in my products.
FREE

FractalEfficiencyIndicator A ratio between 0 and 1 with the higher values representing a more efficient or trending market, It is used in the calculation of Perry J. Kaufman Adaptive Moving Average (KAMA), dividing the price change over a period by the absolute sum of the price movements that occurred to achieve that change. The Fractal Efficiency or also known as Efficiency Ratio was first published by Perry J. Kaufman in his book ‘Smarter Trading‘. This is mostly considered a filter for v
FREE

This indicator displays breakouts on Point-And-Figure-like or Kagi-like custom symbol charts, generated by special expert advisers, such as PointFigureKagiCharts . This indicator is applicable only for custom instruments generated in appropriate way (with time-invariant bars which are multiples of a predefined box size). It makes no sense to apply it to other charts. The breakouts in up or down direction are marked by arrows. The breakout price is found at crossing of one of imaginary lines of
FREE

(Kripto Para Tabloları)
Binance Spot'taki tüm sembolleri özel sembollere kaydeder.
Binance Spot'taki sembollere "S" önekini ekler.
Binance Spot'taki sembollerin takip edilebileceği alt yapıyı oluşturur.
Araçlar menüsü >> Seçenekler >> Uzman Danışmanlardan WebRequest'e izin vermeli ve URL'yi eklemelisiniz: https://api.binance.com
komut dosyasına çift tıklamanız yeterlidir.
Tüm listeye saniyeler içinde sahipsiniz.
https://www.mql5.com/en/market/product/69001 bağlantısındaki ürün
FREE

Everyone knows how to analyze the market , which level to buy / sell this is an easy job , which leads to unusual horrible loses , very little few people knows WHEN then enter the market , time is Money , this is the key!!!
This version is a Proof of concept limited version of ZamanCYcles founded here: https://www.mql5.com/en/market/product/81883?source=Site +Market+Product+Page This works Only on 3 Minutes Time frame for 45 Candles Get rest of planets and more than 10 other algorithms to pre
FREE

This indicator measures volatility in a multi-timeframe fashion aiming at identifying flat markets, volatility spikes and price movement cycles in the market. [ Installation Guide | Update Guide | Troubleshooting | FAQ | All Products ]
Trade when volatility is on your side Identify short-term volatility and price spikes Find volatility cycles at a glance The indicator is non-repainting The ingredients of the indicator are the following... The green histogram is the current bar volatility The
FREE

This indicator is designed based on the Moving Origin indicator
When the moving origin indicator breaks the price, this indicator gives a signal
It is useful for better viewing of signals and analysis on them
Attributes: Can be used in all symbols Can be used in all time frames Too many signals Simple and quick settings Easy way to work
Settings: period: like moving average settings alarmShow: If you want to receive an alert in Metatrader after receiving the signal, enable this setting
a
FREE

Measures the average price and Maximum Stop Loss accepted, adjustable Measures too the projected average price (For Pending entrys), in case you have a open position and pending orders to scale in shows how much it will increase or decrease the average price after fullfilling that pending orders! It shows too the Stop Loss based on the projected average entry, how much it has to be stoped out to fullfill your risk management, after fullfilling that pending orders
FREE

The M Extensions are variations of the Golden Ratio (Fibonacci Sequence). It is the World's first technique developed for Candle Projections.
Advantages:
Easy to plot. Candle anchoring; High and accurate precision as support and resistance; Excellent Risk x Return ratio; Works in any timeframe; Works in any asset / market. The M Extensions are classified into:
M0: Zero point (starting candle) RC: Initial candle control region M1: Extension region 1 M2: Extension region 2 M3: Extension r
FREE

Automated trading system it's a professional instrument that allows you to achieve results without the negative influence of a human factor. Effectiveness is confirmed by trading on a real account since 2017. Perform all the tests with the modelling type RealTicks or EveryTick. LINKS Full description of the algorithm; Signal monitoring ( WeTrade + BOA System ); Telegram community; Presets for popular symbols. TRADING STRATEGY DESCRIPTION The trading strategy is based on a breakout of
FREE

QuantumAlert CCI Navigator is a free indicator available for MT4/MT5 platforms, its work is to provide "alerts" when the market is inside "overbought and oversold" regions in the form of "buy or sell" signals. This indicator comes with many customization options mentioned in the parameter section below, user can customise these parameters as needful. Join our MQL5 group , where we share important news and updates. You are also welcome to join our private channel as well, contact me for the pri
FREE

This indicator displays MTF (Multi-Time Frame) Candles on your Chart. It helps to see the overall Trend of Market.. It also help to MTF Analysis in fast way because you dont need look in many Time-Frames.. You get 4TF Bars/Candles on your current chart.. It can help you to identify trend or Reversal early as you get overall picture at one place...
Customizable Settings are : 1. Where to place MTF Candles.. 2. Show or Hide for each Candle 2. Time-Frame for each Candle
FREE

Esse Indicador é uma boa opção para quem gosta de operar a longo prazo e com paciência. Ele trabalho com os níveis de fibo na media de 200 são 9 níveis onde você pode operar nas reversões o mercado partir do níveis abaixo. Level 1 = 550 pontos Level 2 = 890 pontos Level 3 = 1440 pontos Level 4 = 2330 pontos Level 5 = 3770 pontos Level 7 = 9870 pontos Level 8 = 15970 pontos Level 9 = 25840 pontos Level 6 = 6100 pontos
FREE

MetaCOT 2 is a set of indicators and specialized utilities for the analysis of the U.S. Commodity Futures Trading Commission reports. Thanks to the reports issued by the Commission, it is possible to analyze the size and direction of the positions of the major market participants, which brings the long-term price prediction accuracy to a new higher-quality level, inaccessible to most traders. These indicators, related to the fundamental analysis, can also be used as an effective long-term filter
FREE
MetaTrader Mağaza - yatırımcılar için ticaret robotları ve teknik göstergeler doğrudan işlem terminalinde mevcuttur.
MQL5.community ödeme sistemi, MetaTrader hizmetlerindeki işlemler için MQL5.com sitesinin tüm kayıtlı kullanıcıları tarafından kullanılabilir. WebMoney, PayPal veya banka kartı kullanarak para yatırabilir ve çekebilirsiniz.
Ticaret fırsatlarını kaçırıyorsunuz:
- Ücretsiz ticaret uygulamaları
- İşlem kopyalama için 8.000'den fazla sinyal
- Finansal piyasaları keşfetmek için ekonomik haberler
Kayıt
Giriş yap
Gizlilik ve Veri Koruma Politikasını ve MQL5.com Kullanım Şartlarını kabul edersiniz
Hesabınız yoksa, lütfen kaydolun
MQL5.com web sitesine giriş yapmak için çerezlerin kullanımına izin vermelisiniz.
Lütfen tarayıcınızda gerekli ayarı etkinleştirin, aksi takdirde giriş yapamazsınız.