YouTube'dan Mağaza ile ilgili eğitici videoları izleyin
Bir ticaret robotu veya gösterge nasıl satın alınır?
Uzman Danışmanınızı
sanal sunucuda çalıştırın
sanal sunucuda çalıştırın
Satın almadan önce göstergeyi/ticaret robotunu test edin
Mağazada kazanç sağlamak ister misiniz?
Satış için bir ürün nasıl sunulur?
MetaTrader 5 için ücretsiz Uzman Danışmanlar ve göstergeler - 13

Edgeweasel ORB: Tipik Açılış Aralığı Kırılması (ORB) Uzman Danışmanından daha ileri giden EA. Bu çok yönlü çok varlıklı araç, piyasa açıldıktan hemen sonra birden fazla enstrümanı eş zamanlı olarak tarayarak ticaret fırsatları konusunda mükemmel performans gösterir. Yapılandırılabilir RSI filtresi ile, aşırı alım ve aşırı satım piyasa koşullarını hassas bir şekilde hedef alır, genel performansı ve başarı oranlarını önemli ölçüde artırır. Çeşitli küresel kullanıcı tabanımıza hizmet etmek için, d
FREE
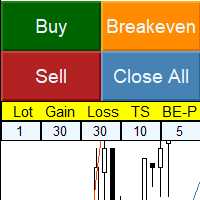
Simple panel with Stop loss (Loss), Stop gain (Gain) , Trailing stop (TS) and Breakeven (BE-P).
Lot is the number of contracts to be traded.
Gain is the number, in points, that the stop gain will be positioned. If you don't want to put stop gain, just put 0 (zero) in place and when you open the order it won't have this stop.
Loss is the number, in points, that the stop loss will be placed. If you don't want to put stop loss, just put 0 (zero) in place and when you open the order it won't
FREE

The 3 Candlestick Engulf indicator is a candlestick pattern indicator that considers the last 3 bearish candles for a Bullish Engulf candlestick pattern signal and last 3 bullish candlesticks followed by a Bearish Engulf candlestick pattern for a bearish signal. Engulfs are also presented in both trending and non-trending situations of the market though recommended to move with signals that are in line with the trend basing on the moving average. The indicator has multiple input features that yo
FREE

The "Dagangduit EA Auto_SLTP" is an Expert Advisor (EA) developed by the Dagangduit Core Team for MetaTrader 5. This EA is designed to provide automated management of Stop Loss (SL) and Take Profit (TP) levels for your trades, as well as other advanced features to enhance your trading experience. Key Features: Automated SL and TP Management : The EA automatically manages the Stop Loss (SL) and Take Profit (TP) levels of your open positions, allowing you to protect your profits and limit potentia
FREE

IDixie is an indicator which shows open and close values of the American dollar index, DXY or "Dixie". The indicator is calculated from weighted values of 6 major symbols: EURUSD, USDJPY, GBPUSD, USDCAD, USDSEK, and USDCHF. In addition to "Dixie" values, the indicator also shows a moving average. You can set the period of the moving average. When bars of the indicator break through the moving average, this creates good opportunities to enter the market. As a rule, signals from this indicator are
FREE

Stochastic RSI makes a stochastic calculation on the RSI indicator. The Relative Strength Index (RSI) is a well known momentum oscillator that measures the speed and change of price movements, developed by J. Welles Wilder.
Features Find overbought and oversold situations. Sound alert when overbought/oversold level is reached. Get email and/or push notification alerts when a signal is detected. The indicator is non-repainting. Returns buffer values for %K and %D to be used as part of an EA. (s
FREE

Kindly rate and comment about the product for upgradation & Support
The 5 EMA is plotted in green color ( Lime ). The 14 EMA is plotted in red color ( Red ). The 20 EMA is plotted in blue color ( Blue ). The 200 EMA is plotted in black color ( Black ). The 200 EMA is plotted in yellow color ( Yellow ).
The Quarter EMA that provided calculates and plots four Exponential Moving Averages (EMAs) on the chart using different periods: 5, 14, 20, and 200. Each EMA
FREE
Unleash the Dark Power of Uncle Reaper FX for GBPJPY H1 Chart – The Foremost Arsenal in Forex Trading The difference is experienced with you go a few rounds with Uncle Reaper and trade like never before. Harness the power of comprehensive strategy, adaptive algorithms, and advanced exits to dominate the Forex market.
Enter the realm where only the daring thrive. Uncle Reaper FX, forged in the depths of market volatility, is tailored for the GBPJPY hourly chart. This formidable system wields a
FREE

"Adaptive Moving Average Envelope" göstergesi, finansal piyasada bilinçli kararlar almanıza yardımcı olmak için tasarlanmış bir araçtır. Trend yönünü net bir şekilde gösterme ve işlemlerde potansiyel giriş ve çıkış noktalarını sunma amacıyla geliştirilmiştir.
Bu gösterge, piyasa volatilitesindeki değişikliklere otomatik olarak uyum sağlayan bir adaptif hareketli ortalama temel alınarak oluşturulmuştur. Bu, hem sakin hem de volatil piyasalarda özellikle kullanışlı hale getirir. Gösterge, adapt
FREE

Investment Castle Support and Resistance Indicator has the following features: 1. Dictates the direction of Buy or Sell trades based on Support and Resistance Levels automatically . 2. Candles stick colors will change to Red for Sell and Blue for Buy (Default settings, user can change from the inputs). 3. This indicator is built-in the Support & Resistance based Investment Castle EA which works with Psychological Key Levels "Support & Resistance".
FREE
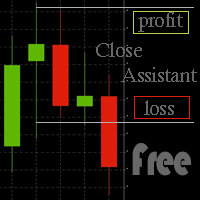
Simple program to automatically close positions by profit or loss.
User can select "Total Profit" to close all positions at the same time, once the total profit or loss is reached.
User can select "Single Profit" to close one by one positions, once single profit or loss is reached. Notes: 1. The assistant will not open any position.
2. The assistant only provide market orders, so due maket volatility positions can suffer slippage.
FREE

The traditional Money Flow Index indicator, this time, EA friendly . There are 3 buffers exposed that can be used by EAs to automatically analyze the Overbought and Oversold conditions of the quote. Just use the traditional iCustom() function to get these signals. This Money Flow Index calculation is based on the traditional Metaquote's MFI indicator.
SETTINGS
MFI Period Volume type to analyze (Real Volume or Ticks) Starting Overbought region Starting Oversold region
USING WITH EAs
Buffer
FREE

El indicador técnico conocido como Líneas de Tendencia Perfecta . Este indicador es una herramienta valiosa en el análisis técnico y se utiliza para mejorar la toma de decisiones en el trading. Aquí tienes una descripción paso a paso de cómo funciona y cómo puede ser utilizado por los traders: Identificación de Tendencias : Las líneas de tendencia perfecta se dibujan conectando dos o más puntos de precio en un gráfico, revelando así la dirección general del mercado. Una línea ascendente indica
FREE

The MelBar EuroSwiss 1.85x 2Y Expert Advisor is a specific purpose profit-scalping tool which success depends on your understanding of its underlying strategy and your ability to configure it. Backtest results using historical data from 6 February 2018 15:00 to 19 February 2020 00:00 for the EUR/CHF (M30) currency pair proves very highly profitable.
Initial Deposit : US$500 Investment returns : US$1426.20 Net Profit : US$926.20 ROI : 185.24% Annualized ROI : 67.16% Investment Length : 2 ye
FREE

1. The Expert Advisor built with a basic, simple and stable trading strategy that is highly effective and accurate with a sniper entry system with a good money management.. 2. The expert advisor works best as from 15 minutes time frame and above.... 3. The expert advisor work with all broker and all currency pair and synthetic indices... 4. Use a reasonable lot size and correct settings if you want to get the best of the Expert Advisor.. Note: To enjoy the full working ability of this Expert Adv
FREE

Relative Volume or RVOL is an indicator that averages the volume of X amount of days, making it easy to compare sessions volumes.
The histogram only has 3 colors:
Green - Above average volume
Yellow - Average volume
Red - Below average volume
The default setting is 20 days, which corresponds more or less to a month of trading.
In this version is possible to choose between tick and real volumes (if you are using a broker which offers future contracts)
With the data obtaine
FREE
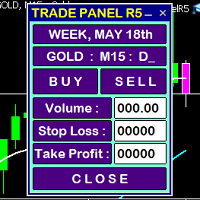
Simple, easy and uncomplicated, you can move to any location on the chart, in addition to having the option to place stop loss and take profit. Very good, it makes day trading easier. The default trading panel of Meta Trader 5 is not very nice, it is fixed on the left side of the screen and flashing red and blue which is annoying. This new panel is more flexible and better to view.
FREE

Value Chart indicator presents the Price evolution in a new form. This indicator, Price Momentum , was developed taking all the calculations presented in the book " Dynamic Trading Indicators " by Mark W. Helweg and David Stendahl (2002). The technique involves de-trended Prices from a user-defined Period of analysis and the addition of a Volatility index correction. The result is an Oscillator with 3 zones: Fair Price Value, Overbought/Oversold and Extremely Overbought/Oversold zones. Adding th
FREE
Saçma Olmayan Forex Yöntemi için Ticaret Paneli Grafiklerinizi temiz tutarken işlem hızınızı artırın
Özellikler: -Konum boyutlandırma: Al/Sat'a tıkladığınızda, bu araç, riskinize en yakın lot miktarıyla (her alım satımda kullanılan bakiye yüzdesi) 2 alım satım açar. Pip değerlerini hesaplamayı unutun!
-SL ve TP: her işlem 1.5*ATR'de Zarar Durdur ve iki yarıdan biri 1*ATR'de Kâr Al ile açılır. Kullanılan ATR değeri, günlük mumun tamamlanmasına 4 saatten az bir süre kalmışsa, mevcut mumdan
FREE

PRICE ACTION Semi-auto trade bot premium: This is a simple quantitative model that trades GOLD(XAUUSD) using automatic price action analysis algorithms Place it on any symbol or timeframe. The position sizes are calculated by multiplying 0.01 per USD 500 on account to ensure low risk exposure and also leaving free margin for hedging positions that reduce the overall risk exposure . This is what leads to stability in the model though it is possible that the model like any other might stop workin
FREE

US 30 BOT This is a simple quantitative model that trades US30 Index from NASDAQ top 30 American stocks It uses volatility contraction and expansion as a basic theory. Place it on US30 chart ,any timeframe. Hedged accounts are advised. NB: Standard accounts are preferred and well regulated brokers eg ICMarkets are advised to avoid unnecessary losses eg slippage ones,commissions and large spreads. Minimum account balance ADVISED : USD 100 HOW TO USE: A VPS is highly recommended. AWS offers 1 y
FREE

Description This is an indicator for MT5 which has enhanced the "Fractals" indicator. "Fractals" indicator is included in MT5 by default but the draw line period is fixed at "5" and it cannot be modified. Thus I have reinvented the Fractals indicator with some useful function added. This tool will be useful especially for those who are learning how to draw good horizontal lines and wants to get some reference. Of course, those who are considering Fractals as an important horizontal line wil
FREE

SI Connect is a utility that establishes the connection to our servers to use FX Volume or the SIEA trading systems.
Technical instructions to prepare your terminal for the usage of SI Connect Allow web requests and insert https://stein.investments to the list of allowed URLs in your Terminal Options -> Subcategory Expert Advisors . You need only one running EA instance per terminal, but it has to run constantly in the background to grab the latest data from our data centre.
In case of quest
FREE

Bu projeyi seviyorsanız, 5 yıldız incelemesi bırakın. instagram'da izleyin: borelatech Kurumsal ticaret büyük hacimler olarak, onlar için nadir değildir
pozisyonlarını belirli oran seviyelerinde savunur. Bu seviyeler, kullanabileceğiniz doğal bir destek ve direniş olarak hizmet
edecektir
Ya bir ticarete girmek ya da pozisyonunuza karşı olası tehlikelerin farkında
olmak. Bu osilatör size yüzde varyasyonu gösterecektir: Gün. Hafta. Ay. Mahallesi. Yıl. Destek ve direnişlerinizi takip ettiğini
FREE

A professional tool for trading - the divergence indicator between the Stochastic and the price, which allows you to receive a signal about a trend reversal in a timely manner or catch price pullback movements (depending on the settings). The indicator settings allow you to adjust the strength of the divergence due to the angle of the Stochastic peaks and the percentage change in price, which makes it possible to fine-tune the signal strength. The indicator code is optimized and is tested ver
FREE

I think you all know Donchian Channels. so I am not going to write about it.
With this indicator I tried to create Donchian Trend Ribbon by using Donchian Channels.
How it works ?
- it calculates main trend direction by using the length that is user-defined. so you can change it as you wish
- then it calculates trend direction for each 9 lower lengths. if you set the length = 20 then the lengths are 19, 18,...11
- and it checks if the trend directions that came from lower lengths i
FREE

Andrew Pitch fork is one of the most interesting string trend & Channel & Fibo technical analysis , it's like ALL in ONE tool would be very enough for you.
FYI, This indicator will expire by end of July 2022.
Using 2 Andrew pitch Forks with 2 different time frames on same chart is really very hard working and might be impossible , but with this indicator is possible now , moreover , using this method as Candle Volume based analysis give strong trust for your trade.
I assume if you are hav
FREE

The given MQL5 code is for an Expert Advisor (EA) that implements a trading strategy using the Alligator indicator and the Standard Deviation indicator. Here's a breakdown of the code:
The code defines various input parameters for the EA, including entry lots, stop loss, take profit, indicator parameters, and expert settings. The OnInit() function initializes the EA by setting some variables and validating the initialization. The OnTick() function is called on each tick of the price data and
FREE
The RMI Scalper EA is a fully automated Expert Advisor that trades pullbacks from the major trend using RMI and limited averaging. The EA trades using market orders and uses averaging to safely turn otherwise negative trades positive. This EA works best on USDJPY, EURUSD, GBPUSD, USDCAD, USDCHF, AUDJPY, EURCAD, EURGBP and EURJPY using the M30 timeframe and has the option to trade multiple pairs but only one pair at any one time to increase trade frequency without increasing draw down.
Please no
FREE

VolumeFlow is a Volume Accumulation / Distribution tracking indicator. It works in a similar way to OBV, but it is much more refined and includes the options to use: Classical Approach = OBV; Useful Volume Approach; Gail Mercer's approach; Input Parameters: Input Parameters: Approach Type: Explained above; Volume Type: Real or Ticks; Recommendations: Remember: The TOPs or BOTTONS left by the indicator are good Trade Location points. This is because the players who were "stuck" in these regions w
FREE

This indicator extracts a trend from a price series and forecasts its further development. Algorithm is based on modern technique of Singular Spectral Analysis ( SSA ). SSA is used for extracting the main components (trend, seasonal and wave fluctuations), smoothing and eliminating noise. It does not require the series to be stationary, as well as the information on presence of periodic components and their periods. It can be applied both for trend and for another indicators.
Features of the m
FREE

Introduction
Auto Chart Alert is a convenient tool to set alert for your trading in your chart. With Auto Chart Alert, you can set the alert line in one click in your desired location in your chart. You can even set alert over the sloped lines in your chart. Auto Chart Alert is a great tool when you have to watch out importnat support and resistance levels for your trading. You can receive the sound alert, email and push notification when the price hit the alert line at you desired location. A
FREE

For those Price Action traders who love to trade strong Price points, like yesterday's HIGH and LOW, here is an indicator to ease the identification of those values, drawn directly on your chart! MIN/MAX of the Day will automatically draw 2 lines showing you those points for you, AND, if you like any HIGH and LOW in the past, not just yesterday's prices. It can also be configured to additionally show today's HIGH and LOW prices - just configure the refresh rate of those lines at your own taste/s
FREE

The indicator plots two lines by High and Low prices. The lines comply with certain criteria. The blue line is for buy. The red one is for sell. The entry signal - the bar opens above\below the lines. The indicator works on all currency pairs and time frames It can be used either as a ready-made trading system or as an additional signal for a custom trading strategy. There are no input parameters. Like with any signal indicator, it is very difficult to use the product during flat movements. You
FREE

Description: The Custom Moving Averages indicator displays three different moving averages on the chart: a 10-period Simple Moving Average (SMA10) in lime, a 21-period Simple Moving Average (SMA21) in red, and a 200-period Exponential Moving Average (EMA200) in thicker white. This indicator helps traders identify trends and potential entry/exit points based on the behavior of these moving averages. Features: Three moving averages in different periods: SMA10, SMA21, and EMA200. Customizable color
FREE

About the indicator: DALA Forecast is a universal tool for predicting the dynamics of time series of any nature. For prediction, modified methods of nonlinear dynamics analysis are used, on the basis of which a predictive model is built using machine learning methods. To get the trial version of the indicator, you can contact me in private messages.
How to use the indicator: Apply the indicator to your chosen financial instrument or indicator with the settings you need. The prediction will b
FREE
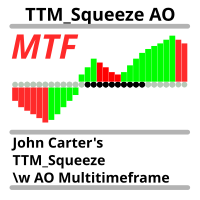
The same indicator as here Скачайте Технический индикатор 'John Carters TTM Squeeze with MACD Multitimeframe' для MetaTrader 5 в магазине MetaTrader Market (mql5.com) , but instead of MACD, Bill Williams' AO (Awesome Oscillator) is used. It goes well with a sleeping Alligator to determine periods of "compression-calm", which may be followed by significant movement.
It is useful to use an indicator from a higher timeframe (coefficient 5 or 6) to determine the possible direction of a breakout.
FREE

The MACD 2 Line Indicator is a powerful, upgraded version of the classic Moving Average Convergence Divergence (MACD) indicator.
This tool is the embodiment of versatility and functionality, capable of delivering comprehensive market insights to both beginner and advanced traders. The MACD 2 Line Indicator for MQL4 offers a dynamic perspective of market momentum and direction, through clear, visually compelling charts and real-time analysis.
Metatrader4 Version | All Products | Contac
FREE

Wyckoff fans, enjoy!
Ideally to be used with the Weis Waves indicator, but it can be easily used alone, the Waves Sizer puts the range (in resulting Price movement) done by the Price on its market swings. You can control how accurate or loose will be the swings. This tool is very helpful for visually know how much the Price has traveled in your Timeframe. This way you can confront this level of effort with the resulting Volume, etc... Weis Waves indicator:
https://www.mql5.com/en/market/pro
FREE

Rua Close All Orders An EA used to preserve profits. EA will close all orders when reaching profit expectations or loss limits in USD or a percentage of the balance. Custom parameters BackTest EA + True: there is a command when running in Backtest mode. + False: Not entered, used for real time Closebyprofit: + true: use payment in USD + false: do not use closed in USD profit win: stop rate (USD) profit loss: stop loss (USD) Closebypercent: + true: use close to percent of bal
FREE

The Rayol Code Hour Interval Lines indicator was designed to assist your trading experience. It draws the range of hours chosen by the user directly on the chart, so that it enables traders to visualize price movements during their preferred trading hours, providing traders a more comprehensive view of price movements and market dynamics. This indicator allows the user to choose not only the Broker's time, but also the Local time. This way, the user no longer needs to calculate local time in
FREE

Axilgo Pip Piper CoPilot Elevate your trading game with the Axilgo Pip Piper CoPilot, the first in our revolutionary Pip Piper Series. This all-inclusive toolset is meticulously crafted for serious traders, focusing on key areas such as Risk Management, Trade Management, Prop Firm Rule Compliance, and Advanced Account Management . With CoPilot, you’re not just investing in a tool—you’re gaining a strategic partner in the intricate world of trading. Important Notice: To ensure you receive the fu
FREE
Active Symbol is a tool that works together with our Trade Panel. Since version 1.2 our panel can manage multiple symbols without having to open it in all of them, just one. This tool make this possible, because with it the actual or remote symbol information are saved for our Trade Panel to use. Remember to enable the panel control mode in the all symbols function. If you have some problemas with the shortcut buttons on chart on unpinned mode of Trade Panel try change the tickets digits option.
FREE

Cybertrade Agile and Flexible - MT5 (Your strategy in any market)
*** PROMOTIONAL LAUNCH PRICE *** Flexible EA regarding parameterization, where the trader can configure his own setup, risk management and trading plan. Our EA is an advanced, high quality solution, always developed with attention focused on performance and flexibility of use and also always attentive to the need of traders to work in different ways. With the diversity of indicators and parameters available, it is possible to de
FREE

The utility draws pivot levels based on a selection from day week month The previous candlestick of the selected timeframe is taken and the values for the levels are calculated using the following formulas:
Pivot = (high + close + low) / 3 R1 = ( 2 * Pivot) - low S1 = ( 2 * Pivot) - high R2 = Pivot + (R1 -S1) R3 = high + ( 2 * (Pivot - low)) S2 = Pivot - (R1 - S1) S3 = low - ( 2 * (high - Pivot));
The style and thickness for all lines are adjusted.
The colors for the R, Pivot and S line
FREE

This indicator is designed to help traders to help them Synchronize objects across all charts that have the same pair/currency.
Applicable objects: -Rectangle
-Trendlines
-Trendlines by Angle
-Horizontal Lines
-Vertical Lines
-Arrow Lines
-Channels
Known Issues : - Visualization is not copied to the other charts. - If indicator is only placed in one chart, other charts with the same pair/currency will have difficulty deleting the objects if there is not Sync Objects In Charts indicato
FREE

En esta versión, las alertas están funcionando y en la versión que publicó, la zona muerta de atr era solo una zona muerta sin atr, por lo que también la convirtió en una zona muerta de atr.
Indicator input parameters input int Fast_MA = 20; // Period of the fast MACD moving average input int Slow_MA = 40; // Period of the slow MACD moving average input int BBPeriod=20; // Bollinger period input double BBDeviation=2.0; // Number of Bollinger deviations input int Sensetiv
FREE

This is my version of the famous VWAP indicator.
Channel Group: Click Here
You get: - Default VWAP Line - First and second deviation zones - Previous day levels Very simple to use, one of the best tools for day trading. Can be used on any TF and on any symbol. Don't use for entries, use as a trend filter. Add supporting indicators
I would recommend to use the indicator on either 15M or 5M chart.
FREE

The indicator draws levels based on the overbought and oversold values of the RSI indicator.
The maximum values are taken into account, which are equal to or exceeded certain limits. That is, for example, when the price has gone into the overbought zone, the highest price is selected from all prices in this zone for this period of time, and as soon as the indicator value returns to a value below the overbought value, the level is fixed and the calculation of new values begins.
The sam
FREE

John Bollinger created this indicator in 2010 as a way to read the original indicator (Bollinger Bands) in a more "technical" way, shown as an oscillator. The typical range of the Bollinger Bands %B is 0 - 0.5 - 1.0, where "0" represents the lower band, the "0.5" the middle band, and "1" the upper band. The line on the indicator represents the Closing prices. As simple as that.
SETTINGS
Bollinger Bands period of analysis Standard Deviation multiplier Shift Price type to be analyzed
If you
FREE

An analogue of the Stochastic oscillator based on algorithms of singular spectrum analysis (SSA) SSA is an effective method to handle non-stationary time series with unknown internal structure. It is used for determining the main components (trend, seasonal and wave fluctuations), smoothing and noise reduction. The method allows finding previously unknown series periods and make forecasts on the basis of the detected periodic patterns. Indicator signals are identical to signals of the original i
FREE

The name Aroon means “ Dawn's Early Light ” in Sanskrit. His creator Tushar Chande chose this name because the indicator is designed to catch the beginning of a new trend. At first sight it seems a little confusing all those jagged lines but after you understand the basics of it, you will find this indicator pretty cool and use it in a variety of ways, i.e.: Trigger, Trend Filtering System, and so on. The Aroon indicator was created in 1995 so it is a "modern" indicator compared to the Jurassic
FREE

FRB Trader - Our mission is to provide the best support to customers through conted and tools so that they can achieve the expected results
FRB Support and Resistance
- Indicator places lines on the chart to show Support and Resistance regions. - You can choose the timeframe you want to calculate, as well as the colors of the lines. - Algorithm calculates the points where the strengths of the asset are considered and are extremely important for decision making.
FREE

Mostra a média móvel quando ADX > 20 e pinta de verde ou vermelho quando os valores de ADX estão subindo indicando tendência. Quando o ADX é menor que 20 indica movimento lateral consolidado. O indicador não define pontos de entrada, somente mostra a média colorida quando a tendência está se fortalecendo. Faz parte do grupo de indicadores do Indicador Tavim.
FREE

If you like to use traditional Moving Averages (like SMAs and EMAs) to provide your trades for dynamic levels of Support and Resistance, you will love the Adaptive Moving Average (AMA). Created in 1995 by Perry Kaufman and presented to the world in his book " Smarter Trading : Improving Performance in Changing Markets ", the Adaptive Moving Average (also known as KAMA - Kaufman Adaptive Moving Average) has the goal to be the perfect companion for following a trend without noise, but s
FREE

XAUUSD USDJPY GPBUSD M1 HEDGE Gerçek Hesap Takibi Analytico - MQL5 Otomatik Ticaretinizde Yeni Müttefikiniz! Piyasada sadece en iyi fırsatları tanımlamakla kalmayıp aynı zamanda sermayenizi diğerlerinden daha iyi adapte eden bir ticaret asistanına sahip olmayı hayal ettiniz mi? İşte bu Analytico, ticaret deneyiminizi iyileştirecek EA'dır!
Başarının 3 Temel Taşı: Yön, Hacim ve Hız Analytico hiçbir şeyi şansa bırakmaz. Piyasada doğru yönlendirme, işlem hacmi ve fiyat hareketlerinin
FREE

The selective pin bar is designed to identify reversals. To use the selective pin bar effectively, traders typically look for Strong Rejection: The tail of the pin bar should extend significantly beyond the surrounding price action. It indicates that there was a sharp rejection of higher or lower prices during the trading period. A strong rejection suggests that the market sentiment may be changing.
FREE

This indicator is especially for the binary trading. Time frame is 1 minutes and exp time 5 or 3 minutes only. You must be use martingale 3 step. So you must put lots size is 10 % at most. You should use Mt2 trading platform to connect with my indicator to get more signal without human working. This indicator wining rate is over 80% but you may get 100% of profit by using martingale 3 step. You should use MT2 Trading Platform to connect meta trader platform and binary platform . You can get mt2
FREE

Outside day trading strategy looks for a specific pattern in the price chart of a security.
The pattern is characterized by a larger range than the previous day, with the high of the day higher than the previous day's high and the low of the day lower than the previous day's low.
Works with many symbols, such as BTCUSD, GBPUSD,USDCAD, oil, gas, and others. PLEASE RATE! Thank you very much!
FEATURES:
- Real Strategy - Daily Bar Strategy - Exit the trade if the day was profitable - ATR multip
FREE

Overlay indicator on chart between 2 pairs
The Timeframe Overlay indicator displays the price action of timeframes on a single chart, allowing you to quickly assess different timeframes from a single chart. The advantage is to observe and follow the correlations of price movements in real time to help you find potential trades at a glance.
---- Symbol 1 ----
Symbol = EURUSD
Correlation Inverse = false
Display = true
Ratio
FREE

Are You Better than Monkey? Prove it...
The trade of this EA is based on random output with customizable lot size (use martingale or not), stop-loss, and take-profit levels. Easy to use and Simple Great for benchmarking tests against other EAs or manual trade. Works for ECN/Non-ECN brokers and 2-3-4-5 digit symbols Support us by open My recommended broker. Exness Tickmill robot monkey uses Adx trend filter for fair game no-trade unfavorable market ( you can turn off set adx = 0) . EA starts
FREE

El **Heiken Ashi Smoothed** es una versión suavizada del indicador técnico Heiken Ashi, que se utiliza en el análisis de gráficos de velas para identificar tendencias del mercado y pronosticar movimientos de precios. Este indicador se basa en el promedio de datos de precios para formar un gráfico de velas que ayuda a los traders a filtrar el ruido del mercado.
**¿Para qué sirve?** Este indicador se utiliza para identificar cuándo los traders deben permanecer en una operación y cuándo está por
FREE
Adım adım "Trailing Stop"
Yardımcı program, "Trailing Stop" aracını kullanırken fiyatı takip eden "Zararı Durdur" hareket adımını ayarlamanıza olanak tanır. "MetaTrader" terminalinde bulunan ve "Kaybı Durdur" hareketini 1 pip'lik artışlarla ayarlamanıza izin veren "normal" "İzleyen Durdurma"nın aksine, bu "İzleyen Durdurma" herhangi bir artışla yapılandırılır. Bu ayar, fiyat bir yönde uzun bir hareketten sonra küçük bir düzeltme için tersine döndüğünde ve ardından tekrar aynı yönde hareket etm
FREE

Reward Multiplier is a semi-automatic trade manager based on pyramid trading that opens additional orders with the running profit of your trades to maximize return exponentially without increasing the risk.Unlike other similar EAs, this tool shows potential profit/loss and reward to risk ratio before even entering the first trade! Download full version here ( In the mini version. Starting lot is fixed at 0.01 (or minimum allowed lot size ) Guide + tips here MT4 version here You only open the
FREE

A new box will be added, if the closing price is higher than the maximum (lower than the minimum) of the current box series no less than for the specified value. Reversal will be made, if the closing price is higher (lower) than the last box on a value no less than the specified.
T his is a trend indicator and it can be used as an alternative for the trend definition instruments which use averaging.
FREE

Volume Weighted Average Price or VWAP is an indicator wich shows different average prices on chart. This is very useful to find strong negotiation price areas and as trend following.
Configurations: Day, Week and Month - Show different VWAPs according to the period. You can change each line style on "colors" tab.
Any doubt or suggestion please contact us. Enjoy! This is a free indicator, but it took hours to develop. If you want to pay me a coffee, I appreciate a lot <3 PayPal, Skrill, Ne
FREE

//// Forex Bulls GBPUSD ////
No Martingale ,No HFT ,NO Grid one Shoot Trader Make Sure to Active Weekdays input For Bcaktesting and Live
This Expert Working 5 day a week 12 month of years Live Signal =
FTMO Mode = unique strategy where it continuously splits a single trade into seven smaller trades. This means that each time the EA executes a trade, it automatically divides it into seven smaller positions. Forex Bulls GBP USD stands out from other expert advisors due
FREE
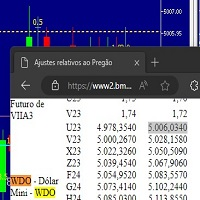
Este script marca no gráfico do ativo MINDOL da activ trades o ponto de ajuste do contrato futuro do Mini Dolar (WDO),
***ATENÇÃO*** para este script funcionar é necessário autorizar a URL da BMF Bovespa no Meta Trader. passo a passo: MetaTrader 5 -> Ferramentas -> Opções -> Expert Adivisors * Marque a opção "Relacione no quadro abaixo as URL que deseja permitir a função WebRequest" e no quadro abaixo adicione a URL: https://www2.bmf.com.br/ este indicador usa a seguinte página para buscar o
FREE

Inicialmente este indicador foi elaborado e pensado para rastrear pontos ou velas onde há força de tendência. Como nas grandes descobertas, cheguei ao indicador que mostra principalmente velas de reversão, pontos de tensão, alta liquidez, resistência. O indicador traz simplificação ao gráfico, indicando todos os pontos onde possivelmente teríamos lta´s, ltb´s, médias móveis, bandas, ifr alto. O indicador não faz o gerenciamento de risco, apenas mostra as velas onde podem ocorrer reversão. Lembre
FREE

Support And Resistance indicator that can display round levels and zones . It shows them directly on the chart, providing an easy help when you want to set stop-loss or take-profit level, or when you want to see the next market target. If an asset price is moving down and bounces back up, the level is called support (think: price floor). If an asset price is moving upward and hits a level where it reverses downward, this is called resistance (think: price ceiling).
FREE
MetaTrader Mağaza, ticaret robotları ve teknik göstergeler satmak için en iyi yerdir.
MetaTrader platformu için ilgi çekici bir tasarıma ve iyi bir açıklamaya sahip bir uygulama geliştirmeniz yeterlidir. Milyonlarca MetaTrader kullanıcısına sunmak için size ürününüzü Mağazada nasıl yayınlayacağınızı açıklayacağız.
Ticaret fırsatlarını kaçırıyorsunuz:
- Ücretsiz ticaret uygulamaları
- İşlem kopyalama için 8.000'den fazla sinyal
- Finansal piyasaları keşfetmek için ekonomik haberler
Kayıt
Giriş yap
Gizlilik ve Veri Koruma Politikasını ve MQL5.com Kullanım Şartlarını kabul edersiniz
Hesabınız yoksa, lütfen kaydolun
MQL5.com web sitesine giriş yapmak için çerezlerin kullanımına izin vermelisiniz.
Lütfen tarayıcınızda gerekli ayarı etkinleştirin, aksi takdirde giriş yapamazsınız.