YouTube'dan Mağaza ile ilgili eğitici videoları izleyin
Bir alım-satım robotu veya gösterge nasıl satın alınır?
Uzman Danışmanınızı
sanal sunucuda çalıştırın
sanal sunucuda çalıştırın
Satın almadan önce göstergeyi/alım-satım robotunu test edin
Mağazada kazanç sağlamak ister misiniz?
Satış için bir ürün nasıl sunulur?
MetaTrader 4 için yeni Uzman Danışmanlar ve göstergeler - 284
Fibo Color Levels is an amazing tool for Fibonacci lovers. You can customize your preferred values, styles and formats of each level and set the color levels according to their importance. Fibo Color Levels Not add object fibonacci retracement automatically . The purpose of this indicator is not it. So you need to manually add the Fibonacci Retracement in your chart, as usually already do. Use the standard tool Fibonacci Retracement in your MT4, draw the Fibo according to the swing-high and/or s

OBV Divergence Formation (hereinafter "Diver") is based on On Balance Volume technical indicator (OBV) that is a momentum indicator that relates volume to price change. Classic (regular) and Reversal (hidden) Divergences - at your choice. Adjustable sizes and all parameters Flexible settings including VOID levels (additional alert function, arrows on price-chart show in which direction to trade) No re-paint / No re-draw (set CalcOnOpenBar =false) "SetIndexBuffer" available for all variable

Stufic is a result of the long way of development. It was created for use in the management of capital of trading groups. The main idea is to preserve capital through unexpected fluctuations of the markets. It is one of the system that can perform on 90% of currency pairs. It's a participant on World Cup Trading Championship 2016 with real 10K USD. Stufic was also between top five traders in real money contest organized by Fidelis Capital (November 2015, Gain +48%).
Why should you have to choo

The Price Action Dashboard is an innovative tool to help the trader to control a large number of financial instruments. This tool is designed to automatically suggest signals and price conditions. The Dashboard analyzes all major Time Frame suggesting price action conditions with graphic elements. The Dashboard can suggest you the strength of the trend identifying directional movement, it is an indispensable tool for those who want to open position themselves using market trends identifiers. The
RSI Alert Pro is a highly configurable RSI indicator with rich alerts and RSI level monitoring features.
Input Parameters Parameter Permitted Values Description
Use Alerts Pro Voice Synthesis module true/false Provides voice synthesized alerts for Traders with the Alerts Pro module (additional purchase required) Enable Push Notifications true/false If set to true the system will send push notifications to any MT4 mobile platform the trader is licensed for RSI Period Integer values from 1
Tipu Parabolic SAR Panel is the modified version of the original Parabolic SAR indicator published by MetaQuotes here . Dashboard Panel (multi symbol) version for this indicator is available here .
Features An easy to use Panel that shows the Parabolic SAR trend and signals of selected timeframe. Customizable Buy/Sell alerts, push alerts, email alerts, or visual on-screen alerts. Customizable Panel. The panel can be moved to any place on the chart or minimized to allow more space. To enable th
FREE
RFX Forex Strength Meter is a powerful tool to trade 8 major currencies in the Forex market, U.S. Dollar ( USD ) European Euro ( EUR ) British Pound ( GBP ) Swiss Franc ( CHF ) Japanese Yen ( JPY ) Australian Dollar ( AUD ) Canadian Dollar ( CAD ) New Zealand Dollar ( NZD )
The indicator calculates the strength of each major currency using a unique and accurate formula starting at the beginning of each trading day of your broker. Any trading strategy in the Forex market can be greatly improved

The RBCI hist indicator is an adaptive trend histogram, that eliminates noise using a Low-pass filter, which passes the lower frequencies and cuts off hight frequencies of the price fluctuations. The signal (depending on the strategy chosen by trader) is the intersection of the zero line by the indicator, as well as the change in the histogram color. The change in the histogram color serves as an early signal for opening positions towards the trend. The position of the indicator relative to the

Better Support & Resistance shows the best support and resistance lines and zones. It is based on Fractals with the factor of your choice. All fractals are assembled, weighted, extended and merged into a clear set of support and resistance lines. The immediate nearby lines are shown as zones when price is in that zone. Better Support & Resistance gives you the best overview of the important price levels.
Settings Better Support & Resistance's default settings are good enough most of the time.

Introduction The Weekly pivots indicator calculates and displays weekly pivot levels on MT4 charts. The indicator allows the trader to adjust the calculation window so that the pivots can be synchronised with the market the trader is active within. So traders looking to trade the London open or the US open can adjust the calculation basis of the pivot system so that the pivots on their chart are the same as the majority of the market participants. All the FX AlgoTrader pivot systems use HOURLY d

Introduction The Monthly pivots indicator calculates and displays monthly pivot levels on MT4 charts. The indicator allows the trader to adjust the calculation window so that the pivots can be synchronised with the market the trader is active within. So traders looking to trade the London open or the US open can adjust the calculation basis of the pivot system so that the pivots on their chart are the same as the majority of the market participants. All the FX AlgoTrader pivot systems use HOURLY
Overview This is the WOODIE version in the Verdure Pivot Trail Series. Verdure Woodie Pivot Trail plots WOODIE pivot levels for every bar on the chart. Pivot levels are great at determining turning points in the market and when period pivot levels are compared to daily pivot level, these turns can be accurately predicted and timed.
Features Dynamically calculates and draws Pivot levels for every bar on the chart (Central Pivot Point, R1, R2, R3, S1, S2 and S3) Pivot level can be used to trail
The MACD Turbo indicator provides a highly configurable enhanced MACD indicator with histogram, push notifications, pop-up and email alerts. Traders can customize the MACD calculation parameters to meet their needs and also control the alert system based on their requirements. The alert module produces alerts when the MACD line crosses the 'Watermark' or zero level and also when the MACD and Signal lines crossover. Traders can choose the nature of the crossover modes which can be 'Printed' - whe

This indicator shows the time before the new bar or candle opens. Examples of how much is left before a new bar opens: An example for the M1 timeframe: 05 = 05 seconds. An example for the H1 timeframe: 56:05 = 56 minutes and 05 seconds. An example for the D1 timeframe: 12:56:05 = 12 hours, 56 minutes and 05 seconds. An example for the W1 timeframe: W1(06): 12:56:05 = 6 days, 12 hours, 56 minutes and 05 seconds. МetaТrader 5 version: https://www.mql5.com/en/market/product/13602 Settings color_ti
Limit and reverse MT4 is a flat Expert Advisor with no indicators.
Trading Strategy Limit and reverse MT4 trades any currency pair and any timeframe. The strategy is based on accompanying an open position with a trailing profit and reversing it when the trailing profit is activated. The first position is opened with the triggering of the SellLimit or BuyLimit order above and below the current price. Additional control is placing a SellStop order much below the current price - new orders cannot

Hello, I am Ayman from Egypt, I want to present an interesting indicator to you. It depends on Ichimoku Kinko Hyo, but there is a secret that i use in it. By using my indicator, you will be able to know a lot of important information in the market such as: Live Signal : https://www.mql5.com/en/signals/821024
Features You can avoid entry during market turbulence You can enter orders on the general trend only You will know if the trend is strong or weak If you entered an any orders by the help o

Tipu Trend is a non-lag, non-repaint, smart indicator, that shows the trend of selected time frames.
Features Customizable Buy/Sell alerts, push alerts, email alerts, or visual on-screen alerts. As easy to trade indicator that smooths the noise in the price action. Highlights ranging markets. Add Tipu Panel (found here ) and unlock the following additional features. An easy to use Panel that shows the trend + signal of the selected time frames. Customizable Panel. The panel can be moved to any
FREE

The Daily pivots indicator calculates and displays daily pivot levels on MT4 charts. The indicator allows the trader to adjust the calculation window so that the pivots can be synchronised with the market the trader is active within. So traders looking to trade the London open or the US open can adjust the calculation basis of the pivot system so that the pivots on their chart are the same as the majority of the market participants. All the FX AlgoTrader pivot systems use HOURLY data for their p

Full Market Dashboard (Multi Pair And Multi Time Frame) : ---LIMITED TIME OFFER: NEXT 25 CLIENTS ONLY ---46% OFF REGULAR PRICE AND 2 FREE BONUSES ---SEE BELOW FOR FULL DETAILS One of the biggest advantages the institutions have, is their access to enormous amounts of data.
And this access to so much data, is one of the reasons they find so many potential trades.
As a retail trader, you will never have access to the same type (or amount) of data as a large institution.
But we created this
The FX AlgoTrader Advanced Moving Average Crossover Alert System is a highly configurable MT4 indicator which incorporates a fully automated alert system for monitoring two trader defined moving averages. Automatic display of fast and slow moving averages Integration with Alerts Pro package - Voice synthesized alerts system - allows complete freedom from the screen (requires Alerts Pro package) Simple, Exponential, Smoothed and Weighted Moving Average options. Configurable calculation price i.e

WindFlow HTF is a useful tool suited to use in conjunction together with my WindFlow indicator. This indicator will give you a background vision about the price action trend on a higher timeframe, so when it runs with the WindFlow indicator you have an almost complete trading solution. At this point, you only need some support/resistance analysis and a bit of focus to become a consistent trader.
The metaphorical "wind's ballet" Professional traders know that every timeframe is governed by its
FREE

This indicator provides tick volume delta analysis on M1 timeframe. It monitors up and down ticks and sums them up as separate volumes for buys and sells, as well as their delta volumes, and volume clusters on price scale within a specified number of bars. This indicator complements VolumeDelta , which uses similar algorithms but does not process ticks and therefore cannot work on M1. VolumeDelta can show its signals on entire history because it reads M1 volumes for calculations on higher timefr

The strategy of this Expert Advisor is based on the assumption that the price sooner or later will come out of range. You will make a profit regardless of the price direction. It is recommended to activate the EA in turbulent days or before the release of important news. Features
You will need a broker with low spreads and fast execution of orders. Testing was conducted on the pair EURUSD. Recommended maximum order size is 0.01 lots for each $150. The EA can be placed on any chart and use it
Concept Mean reversion is a concept in trading based on prices eventually returning to their mean or average level after a period of divergence or departure from the historical mean. Traders deploying mean reversion techniques typically wait for assets to diverge significantly from their mean values and then place trades on the assumption the price will return to the mean at some point in the future- this is also known as re-coupling or convergence. There are several mean reversion based trading

The indicator displays trend strength, including showing the transition from buy to sell and visa versa. It is ideal for trend following strategies and also highlights possible reversals/flattening trend with a yellow X on the indicator window. By default, the indicator does not repaint/flicker, however, there is an option to calculate on the live candle but even then the indicator will not repaint unduly. The indicator can also be used for exit.
Usage Enter long/buy trade when the indicator t
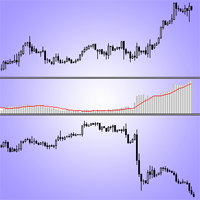
This is an indicator of trading instruments' correlation. It shows the difference of price values of two symbols. The increase in price divergence and the reduction of price divergence can be seen as signals to transactions. The indicator can be used for hedge strategies. The indicator sends Alerts and Push-notifications to the mobile app about the crossing of the moving averages of Envelopes. The indicator has a simple setup. You need to put him in the window of the traded instrument and choose
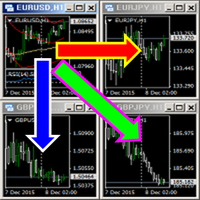
This indicator changes the timeframe and chart profile for multiple charts. If you dispatched many charts (10~20 or more) in single MetaTrader terminal, it is very boring and difficult work to manage the timeframe and chart profile individually. If the indicators you use in a chart are numerous and the setting values are different from the default one, you might give up adding all the indicators to all charts. The changing of timeframes on multiple charts has the same problem, too. Whenever you
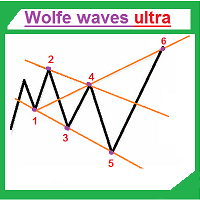
Wolfe waves ultra draws Wolfe Waves automatically. The indicator searches for the Wolfe Waves on three timeframes. This indicator is especially accurate because it waits for a breakout in the wave direction before signaling the trade, resulting in a very high winning ratio.
Features Amazingly easy to trade. The indicator is able to recognize all Wolfe Wave patterns in a specified interval. Thus, we check each extremum for the potential 1,2,3,4,5 points apart from ZigZag vertices. The indicator

RSI Dashboard is a great tool for quickest possible analysis of multiple currency pairs at the same time in terms of Oversold or Overbought .
All displayed and used by indicator symbols are freely to choose and are specified using a space separated list in parameters you're able to analyze not only predetermined ones, but everything that your broker offers, also commodities, equities, indices, ones with prefixes, suffixes etc.
There are 3 types of alerts: alert notifications in the MT4 term

Interceptor - professional volume and price extremes indicator. Interceptor is a powerful indicator, which thanks to a combination of four different types of normalized indicators in one algorithm can correctly identify extremes of the price leading to retracements and reversals in the trend. Algorithm is based mainly on combination of Accumulation/Distribution , On Balance Volume , Money Flow Index and Relative Strength Index . The first parameter of Interceptor is Interceptor_Depth which defin
This is a medium-term conservative system. It tracks quote movements and defines entry points. The Expert Advisor is completely automated and features the unique algorithm. It has been designed for trading CHFJPY, EURCHF, and USDJPY.
Features It does not use Martingale; No grid; No scalping; No excessive parameters; Fixed lot; No complicated settings. Trades are usually opened infrequently. Orders may remain open for a few days for obtaining greater profit. Amount of trades per month – from 5
WindFlow is a powerful solution for manual traders that will drive your trading decisions in no time. I designed this indicator taking into account three main concepts: momentum, break of recent trend and volatility. Just like the wind's flow any trend can have small correction or major change in its direction based on the main trend's strength, so at glance you can have a very good idea on the next "wind's direction" when you look at your charts.
How to properly use WindFlow? WindFlow is the

PipsMinerFast is mainly a trend follower with a bit of price action. At first sight, you will think: "Oh well, one more indi showing everything I've missed today but not giving a clue about what will happen..." Okay, you can believe this when just looking at it but start a test it and you will see that PipsMinerFast: Shows you the trend immediately Is not repainting Has minimum lagging Counts pips immediately Adapts to your spread level Works from M1 to H1 Is heading in the right direction 90% o

Divergence Formation Hurst (hereinafter "Diver") is based on Hurst exponent used as a measurement of long term memory of time series. Classic (regular) and Reversal (hidden) Divergences - at your choice. Adjustable sizes and all parameters Flexible settings including VOID levels (alert function in place, arrows to show in which direction to trade) No re-paint / No re-draw (must set CalcOnOpenBar =false) "SetIndexBuffer" available for all variables (can be used in EA) Auto-detect 4- and 5-digit p

Divergence Formation BBands (hereinafter "Diver") is based on Bollinger Bands Technical Indicator (BB). Classic (regular) and Reversal (hidden) Divergences - at your choice. Adjustable sizes and all parameters Flexible settings including VOID levels (alert function in place, arrows to show in which direction to trade) No re-paint / No re-draw (must set CalcOnOpenBar =false) "SetIndexBuffer" available for all variables (can be used in EA) Auto-detect 4- and 5-digit price function Lite (does not

The Correct Entry indicator displays specific points of potential market entries on the chart. It is based on the hypothesis of the non-linearity of price movements, according to which the price moves in waves. The indicator displays the specified points based on the price movement of certain models, and technical data.
Indicator Input Parameters: Сorrectness – The parameter characterizes the degree of accuracy of the entry signals. Can vary from 0 to 100. The default is 100. Accuracy of si

System Introduction Fx TrendRider is an amazing EA that takes pips as easy as the market itself because it rides with the trends and masters the trend direction and market conditions as it is at any point in time.
Money Management The default lot size setting is 0.10, you can start with that first and see how it goes, then you can increase your lot according to your account balance but do not trade with the money you cannot afford to lose even though with time, you will discover that you can u
This is a medium-term conservative system. It tracks quote movements and defines entry points. The Expert Advisor is completely automated and features the unique algorithm. This demo version trades USDJPY.
Features It does not use Martingale; No grid; No scalping; No excessive parameters; Fixed lot; No complicated settings. Trades are usually opened infrequently. Orders may remain open for a few days for obtaining greater profit. Amount of trades per month is from 5 to 20. Deals are closed by
FREE

3-SMA-Spread - Genişliğini her bir enstrümandan gelen girdiyle orantılı olarak değiştiren görsel iChannel (aşağıdaki formüle bakınız) oluşturarak 3 (üç) farklı enstrümanın piyasa yayılımı (SMA'ya dayalı "İstatistiksel Arbitraj") .
Temel prensip: Her tutarsızlıktan sonra "kendi" sembollerinin fiyatlarını takip eden fiyat satırları, sürekli olarak "sentetik" merkezin toplamına dönme eğilimindedir. Başka bir deyişle, 3 "ilişkili" enstrüman//çiftten oluşan bir sistem sürekli olarak ortalamalarına

3-Hull-Spread - professional cross-instrument stat.arb (Statistical Arbitrage) Indicator of the SPREAD of 3 (three) different instruments via building visual iChannel (see the equation below) that is changing its Width proportionally to the input from each instrument ("Statistical Arbitrage" based on Hull MA =HMA). Core principle: price lines following the prices of "their" symbols after each discrepancy, constantly tending to return to the total of "synthetic" central. In other words, a system

This indicator is a logical extension of the product at https://www.mql5.com/en/market/product/12526 . The only difference is that price movement is displayed using a histogram with levels, allowing to assess the direction and strength of the movement. How to interpret the signal: 0 - the middle of the channel; above 0.5 - the breakdown of the channel up; below -0.5 - the breakdown of the channel down. Both indicators are displayed in the attached screenshots. Install the indicator and you will
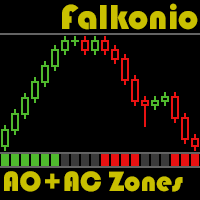
According to Bill Williams' trading system, the zone is formed by the combination of Accelerator Oscillator (AC) and Awesome Oscillator (AO). When they go up, we are in the green zone. When AO and AC bars are red, we are in the red zone. If one of the bars is red, while another is green, we are in the gray zone. When the current AC and AO histogram bars exceed the previous ones, the indicator is colored in green. If the current AC and AO histogram bars are below the previous ones, the indicator

Tipu Heikin-Ashi Panel is the modified version of the original Heiken Ashi indicator published by MetaQuotes here . A professional version of this indicator is available here .
Features An easy to use Panel that shows the Heiken Ashi trend of selected timeframe. Customizable Buy/Sell alerts, push alerts, email alerts, or visual on-screen alerts. Customizable Panel. The panel can be moved to any place on the chart or minimized to allow more space. Heikin means "the average", and Ashi means "foo
FREE

The Expert Advisor (EA) generates an advanced trading tool to place a pending or market order on any currency pair symbol , as selected from a drop-down menu in the panel. A market order is placed by clicking appropriate Sell or Buy button. On the other hand, a pending order is placed by selecting a pending order type and thereafter clicking Place button. Moreover, the panel provides various options to define exact parameters for every order before placing it. For instance, the triggering price

This is a realization of the chart based on the history of the transaction. The indicator is very intuitive, shows you all of the trades, review and summary of your trading problems, allowing to optimize and improve trading ideas in order to avoid similar errors, to continuously improve your trading level by making your trade more clear. This indicator can be very flexible through customization parameters, so you can adjust according to your own preferences, customize color of trade entry and ex
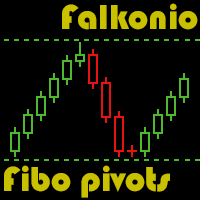
The indicator presents reversal points by Fibo levels based on the previous day prices. The points are used as strong support/resistance levels in intraday trading, as well as target take profit levels. The applied levels are 100%, 61.8%, 50%, 38.2%, 23.6%. The settings allow you to specify the amount of past days for display, as well as line colors and types. Good luck!
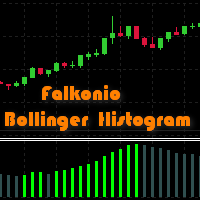
The histogram of the difference between upper and lower levels of the Bollinger Bands. Growth of the histogram means the expansion of the range on a trend interval, reduction means the narrowing of the range during corrections. The histogram is colored: the bullish trend areas, the bearish trend areas and corrections areas are displayed with different colors. Like other trend indicators it gives clear signals, but with delay. There is additional information about the color changes (change or end

And stop and reverse MT4 is a trend Expert Advisor which uses no indicators.
Trading Strategy: And stop and reverse MT4 trades any currency pair and any timeframe. The strategy is based on accompanying an open position with a trailing stop and reversing it when the trailing stop triggers. The first position is opened with the triggering of the Buystop or Sellstop order above and below the current price. On Friday at 23:00 terminal time all positions and orders are closed for the weekend. Addit
The aim of this indicator is to provide statistical information about the user trading activity as recorded in the MetaTrader Account History . It can be loaded on any chart and timeframe and the information is shown on the main window and refreshed every time a new bar is formed. The orders can be selected according to various meaningful criteria: their type (long and/or short), those having a given magic number, those executed in a given time interval, on a particular weekday, on a given symbo
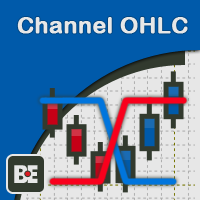
The creation of this indicator was inspired by the phrase of the famous trader Michael Covel "Price is the best indicator in the world". Not everyone is able to see the market through the eyes of a professional. Probably an indicator that does not distort the price and visualizes what is happening on the market can help you. Indicator "BE Channel OHLC" has been created for this purpose. The indicator name has not been chosen by chance. The indicator draws a channel using OHLC prices (OPEN, HIGH,

Veya "Saf Momentum " ilkesini kullanarak fiyat değişim oranını ölçen bir endeks olan (TDO).
Bir menkul kıymet fiyatı 10'dan 15'e yükseldiğinde, fiyat değişim oranı %150'dir, ancak 15'ten 10'a düştüğünde, fiyat değişim oranı sadece %33.3'tür. Bu nedenle, "Fiyat Değişim Oranı" (ROC) veya "Momentum" gibi teknik analiz göstergeleri, artan fiyat hareketleri için azalan hareketlere göre daha yüksek değerler verir. TDO, yatırımcıların momentumu doğru okumalarına yardımcı olmak için bu sorunu düzeltir
With this EA you can say goodbye to your coder and save bucks from your pocket! Did you find out an interesting holy grail indicator and you want to test it on your own? Eager to know if it will be profitable on long term? Well, here it is the Koder Killer EA.
Simple steps to follow open your indicator source code search for the Set Index Buffer values copy the values into the EA set all the other features backtest your strategy FOR FREE run your EA on live servers paying a small rent fee.
S
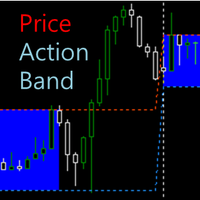
The indicator displays high and low Price Band computed from the period of time. It also contains Price Box based on the both prices. You can measure the box channel in a day by this Price Box and can observe the Price Action in the extended area of the Price Band. Your trading decision will be concluded via watching the Price Action in the Band.
How To Use There are two major external variables, BandSTime and BandETime. This means the start time and the end time respectively to calculate the

We present our totally unique Expert Advisor "Expert trend one point": the EA trades within a trend, it contains a complex strategy (named "one point profit"), does not use stop loss, does not use an adjustable take profit, it adjusts the take profit per one point of profit. The EA works with four or five-digit prices. You can use the Expert Advisor on any currency pairs, however it is recommended to choose symbols with low spread and low stop levels. The EA can work on timeframes M1 , M5, M15,

TradingInfo shows you detailed Information about your Account. It also shows you your Profit, Trades, Ratio and the Spread of current Chart. With integrated function "Draw Profit" you will get all your Orders drawn with Profit on the Chart. You can use it on any Chart and any Timeframe, also for manual Trading or an EA. With this powerful Tool you have a great overview of your Account.
TradingInfo Inputs Menu Background color - the color of menu Manu Label color - the color of the font Menu in
FREE

This automated Expert Advisor is designed to work with ECN brokers and low spreads. The EA works around the clock and there is no need to stop it during during important news releases. Trade is conducted by the levels. The EA features the search for the necessary levels at once on two time periods. The EA uses the built-in filter to select levels, at which it will place the pending orders. All orders are opened with the predefined StopLoss and TakeProfit parameters. Thus, even in the time of big

Mr. Averager MT4 is a Expert Advisor for the MetaTrader 4 trading terminal. The trading algorithm is based on the principle of position averaging. Due to averaging, the EA is not sensitive to the quality of entry points and can work almost at any time and in almost any market. The EA supports 2 trading modes: Automatic start and Manual start. In Automatic start mode, the EA independently starts a new series of orders. In Manual start mode, the first order of the series is opened manually using

Time Range Separator is a useful tool to display a separator period on your platform. You could go in the properties of the indicator, select the desired range and that's ALL. We believe it is a useful and necessary that we wish to share with you for free all our followers.
Input Values: TimeFrame Period Separator GMT_Hour (ex. +1 or -1) to move the lines at Period Time +/- tot hours in input Hide_dates to show or hide the datetime on vertical lines VLine_Color = Vertical Color Line VLine_Styl
FREE
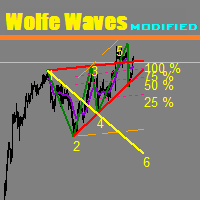
This unique indicator automatically builds Wolfe Waves.
Features Finds the points and builds the lines automatically. Efficient trading strategy. No redraws, no lags. The indicator relaunch button is located directly on the chart. The indicator has multiple configurable parameters.
Use If number 5 appears, wait till the first candle is closed behind Moving Average, then look at the three center lines showing what lot volume should be used if the fifth dot crossed the line 25%. The candle is

Divergence Formation Momentum (hereinafter "Diver") Classic (regular) and Reversal ("hidden") Divers - at your choice: Adjustable sizes and all parameters Flexible settings including VOID levels (alert function in place, arrows to show in which direction to trade) No re-paint / No re-draw (must set CalcOnOpenBar =false) "SetIndexBuffer" available for all variables (can be used in EA) Auto-detect 4- and 5-digit price function Light (does not over-load MT4) In order for Regular Classic Momentum Di

Divergence Formation GDP (Gaussian or Normal Distribution of Probability) hereinafter "Diver" - is used for Fisher transform function to be applied to financial data, as result market turning points are sharply peaked and easily identified. Classic (regular) and Reversal (hidden) Divergences - at your choice. Adjustable sizes and all parameters Flexible settings including VOID levels (alert function in place, arrows to show in which direction to trade) No re-paint / No re-draw (must set CalcOnOp

Divergence Formation RSI (hereinafter "Diver") Classic (regular) and Reversal (hidden) Divers - at your choice: Adjustable sizes and all parameters Flexible settings including VOID levels (alert function in place, arrows to show in which direction to trade) No re-paint / No re-draw (must set CalcOnOpenBar =false) SetIndexBuffer available for all variables (can be used in EA) Auto-detect 4- and 5-digit price function Light (does not over-load MT4) In order for Regular Classic RSI Divergence to ex
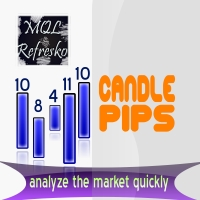
The "Candle Pips" indicator is a tool that helps us a quick way to see the size of the candles on our platform; this is not only of great help to any trader who wants to study the market thoroughly, it is helpful in various strategies that are based on size of the candles. The indicator shows the value in Pips of each candle to our current graph, rounded to an integer.
The indicator also shows the information as a histogram, at the bottom of the graph. It has simple inputs: Candle Type: this en

Divergence Formation MACD (hereinafter "Diver") Classic (regular) and Reversal (hidden) Divergences - at your choice: Adjustable sizes and all parameters Flexible settings including VOID levels (alert function in place, arrows to show in which direction to trade) No re-paint / No re-draw (set CalcOnOpenBar =false) SetIndexBuffer available for all variables (can be used in EA) Auto-detect 4- and 5-digit price function Light (does not over-load MT4) In order for Regular Classic MACD Divergence to

This is a non-trading expert which transforms unstructured web-pages into structured data tables. It downloads and parses an HTML file, then creates DOM ( Document Object Model ) for it, and finally applies specified CSS ( Cascading Style Sheets ) selectors for required fields and extracts data for them. You may consider it as a powerful and highly customizable HTML to CSV ( Comma-Separated Values ) converter. The EA can process web-pages from remote sites (using MetaTrader's WebRequest ) or loc
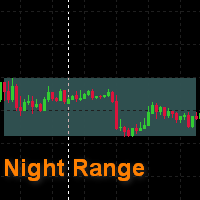
This is a simple indicator that draws a night range. The start and the end of a working day are specified in hours, color rectangles are adjusted as well. It helps to view the history in search for regularities , excluding unpredictable night time. It can be used to search for a breakthrough of the night range. It is drawn as a background , and does not cover a chart and other indicators .
FREE

You can fins our other products from link : https://www.mql5.com/en/users/drbastem/seller Also, you can ask all your questins from email : haskayafx@gmail.com or mobile : +90 530 867 5076 or @MehmetBastem on telegram application This indicator is used to determine the trend. Standard Three Moving Average and ADX indicators are used. It has the indicator warning system (audio, e-mail) and three types of alerts, including messages to mobile phone. It shows the best performance on M5. When

The Expert Advisor does not use any indicators. It has a virtual trailing stop function and designed for 4-5-digit quotes. The EA opens deals in Market Execution mode. Take Profit and Stop Loss are placed after order execution and modified in accordance with the EA settings. Parameters TimeFrame – timeframe for defining the largest bar's Close price within n time period; StartBar – bar, from which the search for the largest bar starts; FinishBar – bar, at which the search for the largest bar is

This Expert Advisor uses martingale and order grid. An initial deal is opened when the price touches or breaks a price channel. The price channel is modified by timer in seconds. The following deals are opened by specified parameters. The EA flexibly configures step and volume, multiplier factor, amount of market orders to start increasing a step or a volume to open new orders. The EA has been adapted for 4-5-digit quotes. The EA is recommended for use on EURUSD, GBPUSD, AUDUSD, USDJPY, USDCHF,

Gösterge, herhangi bir zaman diliminden herhangi bir sembolün küçültülmüş grafiklerini görüntüler. Maksimum görüntülenen çizelge sayısı 28'dir. Çizelgeler hem ana hem de alt pencerede yer alabilir. İki görüntüleme modu: mumlar ve çubuklar. Görüntülenen veri miktarı (çubuklar ve mumlar) ve grafik boyutları ayarlanabilir. Parametreler: Corner - başlangıç köşesini göster (listeden seçilir) CandleMode - görüntüleme modu: true - mumlar, false - çubuklar ShowLastBid - son fiyat gösterimini etkinleştir
FREE
MetaTrader mağazası - yatırımcılar için alım-satım robotları ve teknik göstergeler doğrudan işlem terminalinde mevcuttur.
MQL5.community ödeme sistemi, MetaTrader hizmetlerindeki işlemler için MQL5.com sitesinin tüm kayıtlı kullanıcıları tarafından kullanılabilir. WebMoney, PayPal veya banka kartı kullanarak para yatırabilir ve çekebilirsiniz.
Alım-satım fırsatlarını kaçırıyorsunuz:
- Ücretsiz alım-satım uygulamaları
- İşlem kopyalama için 8.000'den fazla sinyal
- Finansal piyasaları keşfetmek için ekonomik haberler
Kayıt
Giriş yap
Gizlilik ve Veri Koruma Politikasını ve MQL5.com Kullanım Şartlarını kabul edersiniz
Hesabınız yoksa, lütfen kaydolun
MQL5.com web sitesine giriş yapmak için çerezlerin kullanımına izin vermelisiniz.
Lütfen tarayıcınızda gerekli ayarı etkinleştirin, aksi takdirde giriş yapamazsınız.