YouTube'dan Mağaza ile ilgili eğitici videoları izleyin
Bir ticaret robotu veya gösterge nasıl satın alınır?
Uzman Danışmanınızı
sanal sunucuda çalıştırın
sanal sunucuda çalıştırın
Satın almadan önce göstergeyi/ticaret robotunu test edin
Mağazada kazanç sağlamak ister misiniz?
Satış için bir ürün nasıl sunulur?
MetaTrader 4 için yeni Uzman Danışmanlar ve göstergeler - 111

The EA does not use any indicators and is focused on the Daily Close price, we will buy everything that is higher with pending orders, everything that is lower will be sold, but not at random, with using a directional shadows of a smaller timeframe. Customizable reaction to candles of a smaller timeframe: the size of the candle, its body, shadow is set. Distance to a pending order, distance between orders, bar lifetime. You can use averaging with or without the Martin factor. In the "discussion"
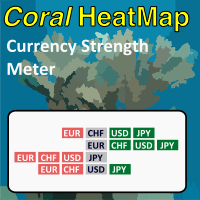
Coral Heatmap is a currency strength meter based on the ATR values for the selected timeframe. There are two main view modes: All Currencies (default) - see the ranked strength of all currencies in a single view Selected Currency - see the relative strength of all other currencies compared to a selected currency You can optionally display the timeframe selection toolbar; timeframe is always synchronized to the current chart timeframe. Use keyboard shortcuts to quickly navigate currencies (up/d

St.Ability
Is a stable long-term algorithm that is 100% based on price action NO Indicators/Grids are used. It scans past price patterns and predicts the most likely outcome for its next trade. The profit to loss ratio is 2:1 which means a losing trade is recovered by the profit of the next winning trade. It takes only 1 trade per pair making it FIFO compatible . Following this, the algorithm can recover its losses while keeping risk relatively low. The EA trades only using the money allocat

This EA is based on a Moving Average and the Parabolic SAR indicator .
REQUIRED EA CONDITIONS ;
1) ENTER BUY POSITION WHEN BUY SIGNAL IS DETECTED
2) CLOSE THE BUY TRADE WHEN A SELL SIGNAL IS DETECTED AND OPEN A SELL POSITION.
3) CLOSE THE SELL POSITION WHEN A BUY SIGNAL IS DETECTED.
ADDITIONAL CONDITIONS ;
1) OPEN A BUY POSITION WHEN THE PARABOLIC SAR IS BELOW THE MA's.
2) OPEN A SELL POSITION WHEN THE PARABOLIC SAR IS ABOVE THE MA's.

This indicator simplifies your entry zones by displaying the areas where you can plan your entry that potentially could give you high risk/reward ratios. Other than picking the most optimal entry points, the Hot Zone indicator can act as your typical support/resistance indicator for pullbacks for all timeframes. You can use this indicator as the only trading indicator or use it with another indicator for reentry purposes. Besides, when using Hot Zones, the risk/reward ratio should be well abov

Chicken EA: Multi-currency EA. It has high accuracy, 90% of all orders are profitable. This EA is NOT sensitive to spread, slippage or any other broker related variables. Minimum balance: $500-$1000 Leverage :1:500-1:2000 Controls 9 pairs simultaneousl EURUSD, GBPUSD, AUDUSD, NZDUSD, EURJPY, GBPJPY, USDCAD, USDJPY, USDCHF
Solid backtest and live performance 1. CHICKEN EA https://www.mql5.com/en/signals/1379016 2. CHICKEN RUN EA https://www.mql5.com/en/signals/1379018
Setting: One Chart Set

CHICKEN RUN is the advanced grid system which already works on real accounts for years. It uses real market mechanics to its advantage to make profit. This EA is NOT sensitive to spread, slippage or any other broker related variables. Minimum balance $500-$1000 Leverage 1:500-1:2000 The EA is optimized for all pairs . Set EA for each pair Recommended : XAUUSD ( GOLD), EURUSD, GBPUSD, EURJPY, GBPJPY
Check out the live results here: 1.CHICKEN RUN https://www.mql5.com/en/signals/1379018 2. CHI
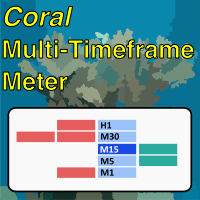
Coral Multi TF Meter allows you to quickly see how price is moving on a single currency pair across multiple timeframes at once. You can select which timeframes to display; the size, position, colors of cells; whether to display values or not; and how often the meter is updated. The calculation is based on ATR distance for each displayed timeframe. Hover over the header cell for the row (with the currency name in it) to see the current ATR value (in pips) for that period. When "Display Values
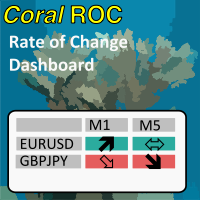
Coral Rate of Change Dashboard displays "rate of change" calculations across multiple symbols and timeframes simultaneously. See at a glance which pairs are moving, and how quickly. Receive alerts when any symbol + timeframe is experiencing very strong movement. You can display data for currency pairs, or for individual currencies (takes the average for each currency across all available pairs). See the CoralDash product description for the core functionality of the dashboard (symbol exposu
Highly configurable Rate of Change (ROC) indicator. Features: Highly customizable alert functions (at levels, crosses, direction changes via email, push, sound, popup) Multi timeframe ability Color customization (at levels, crosses, direction changes) Linear interpolation and histogram mode options Works on strategy tester in multi timeframe mode (at weekend without ticks also) Adjustable Levels Parameters:
ROC Timeframe: You can set the current or a higher timeframes for ROC. ROC Bar Shift:
FREE

CoralDash is a simple symbol shortcut dashboard. The Symbol List has many presets to choose from: Market Watch Open Orders Current Chart Majors A custom list Clicking the symbol has two available actions Set the current chart symbol Filter the list of symbols shown in the dashboard based on one currency (e.g., see all EUR pairs) Click the "PAIR" cell in the header to toggle between the two available actions Click the symbol cell to apply the action For the filter, click the left side to selec
FREE
CoralPage is a simple little utility to add navigation controls to your chart. You can now easily step through the symbols in the Market Watch without having to click-and-drag a symbol from the Market Watch onto your chart. It's a simple but indispensable time-saver! Click move to the first, previous, next or last symbol in the Market Watch. Shift-click to go the the previous or next symbol that has an open order. CoralPage is completely free. If you like this, please check out my other prod
FREE

REV is an Expert Advisor written after many years of studies and researches and it has been developed starting from one of the basic concepts of FOREX, that is the return of the price towards its own average (MEAN REVERSION). The system identifies, mainly, the areas of overbought/oversold with the RSI indicator, used in MultiTimeFrame mode, and tries to exploit the reversals of prices thanks to filters that do not allow market entries in moments of excessive volatility. IT IS A SYSTEM THAT

Williams Trend EA is an automated Expert Advisor uses a combo indicator: Awesome Oscillator & Williams Percent Range
1. Awesome Oscillator Indicator If you have a basic understanding of math, you can sort out the awesome oscillator equation. The formula compares two moving averages, one short-term and one long-term. Comparing two different time periods is pretty common for a number of technical indicators. The one twist the awesome oscillator adds to the mix, is that the moving averages are c
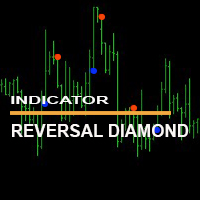
Индикатор " Reversal Diamond Indicator" мощный инструмент для торговли на рынке форекс. " Reversal Diamond Indicator" не перерисовывается и не меняет свои значения при переключении временных периодов. The "Reverse Diamond Indicator" indicator is a powerful tool for trading on the forex market. The "Reverse Diamond Indicator" does not redraw and does not change its values when switching time periods.

Индикатор " Nostradamus ind" мощный инструмент для торговли на рынке форекс. " Nostradamus ind" не перерисовывается и не меняет свои значения при переключении временных периодов. The "Nostradamus ind" indicator is a powerful tool for trading on the forex market. "Nostradamus ind" does not redraw and does not change its values when switching time periods.

Индикатор "Trend direction ind" является трендовым индикатором. Индикатор "Trend direction ind"не запаздывает, выдает сигналы на нулевом баре и не перерисовывает при переключении таимфреймов. С индикатором "Trend direction ind" вы будете с легкостью определять текущую тенденцию. The "Trend direction ind" indicator is a trend indicator. The "Trend direction ind" indicator does not lag, gives signals at the zero bar and does not redraw when switching time frames. With the "Trend direction ind
Индикатор "BO indicator at zero bar" для торговли бинарных опционов. Индикатор выдаёт свои сигналы на нулевом баре не перерисовывает и не меняет свои показатели при переключении временных периодов. Рекомендую использовать индикатор совместно с другим индикатором как фильтр "BO indicator at zero bar" indicator for binary options trading. The indicator gives its signals on the zero bar, does not redraw and does not change its indicators when switching time periods. I recommend using the indicato

2 copies left at $100 Next price - - > $150
**Leave a 5-star review and get a second EA for free** Introduction: Are you tired of losing you money with curve fitted experts or so called holy grails which promise thousands of dollars every day? Did you spent hours o
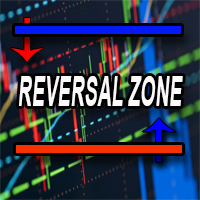
Индикатор "Reversal zone" показывает силовые уровни и возможные точки разворота на текущем графике. Индикатор "Reversal zone" поможет трейдеру разобраться с текущей ситуацией The "Reverse zone" indicator shows power levels and possible reversal points on the current chart. The "Reverse zone" indicator will help the trader to deal with the current situation

Индикатор "Trend zone" Помощник трейдеру, показывает на графике текущую тенденцию. Он надеюсь станет незаменимым индикатором в ваше трейдинге. Индикатор не перерисовывается и не меняет свои значения про переключение временных периодов The "Trend zone" indicator is a trader's assistant, shows the current trend on the chart. I hope it will become an indispensable indicator in your trading. The indicator does not redraw and does not change its values about switching time periods

Индикатор "Zigzag levels" основан на индикаторе зигзаг. Индикатор показывает зоны уровней поддержки и сопротивления относительно индикатору зигзаг. Индикатор "Zigzag levels" сделает хорошую службу в вашем трейдинге. Всем больших профитов!!! The Zigzag levels indicator is based on the zigzag indicator. The indicator shows the zones of support and resistance levels relative to the zigzag indicator. The Zigzag levels indicator will do a good service in your trading. Big profits for everyone!!!

Easy Copier Limited is utility tool to copy trade / Trade copier form one account (master) to other account (slave) . It works only with a single forex ( EURUSD ) .You can use this tool as local copier ( Terminals have to be in same PC / VPS ) as well as Remote Copier ( Terminals can be in different PC / VPS ). For remote copy you can use my server or it can be configured to your server. Trades are possible to copy from MT4 => MT4 MT4 => MT5 MT5 => MT5 MT5 =>

Contact me after payment to send you the User-Manual PDF File. ADVANCE PRICE ACTION TRADING CONCEPT. To test the indicator, you can download the demo version on my product list. it’s free (only shows patterns that have occurred in the past of the market). Quasimodo is a reversal trading pattern that appears at the end of an uptrend. As a price formation, the Quasimodo pattern is depicted by three peaks and two valleys, where: First, the middle peak is the highest, while the outside two peaks

HFX 6.1 Başlatıcı
Bu Uzman Danışman, tüm zaman dilimlerinde piyasaların olası tüm erken eğilimlerini taramaya çalışabilir, ancak EA'yı M15 TimeFrame'e koymak için yeterince iyidir,
Göstergelerde yerleşik bazı osilatörler, piyasa fiyatının nereye gideceğini tahmin etmek için kullanılır, erken trend başarısız olursa, EA kontrollü sipariş mesafesi ile düz lot hedge kullanacak,
EA parametrelerinin altında:
Trade_Set_AUTO, Varsayılan ## OTOMATİK İşlem Ayarı ##, aşağıdaki parametre içi

Ambrosia, hem Kurumsal Düzeyler Göstergesi hem de Merkezi Özet Aracı tarafından oluşturulan düzeylerde işlem yapar.
Bu seviyeler arasında CPR bölgeleri, Fibonacci seviyeleri, Destek ve Direnç, Çeyrek Puanları ve daha fazlası bulunur. Toplamda uzman danışmanın alabileceği 26 farklı giriş seçeneği / kombinasyonu vardır.
Her gün Ambrosia, önceki günlerin fiyat hareketine dayalı olarak yeni Pivot ve Fibonacci seviyelerini hesaplayacaktır. Kurumsal Düzeyler için mevcut fiyatın üstünde ve altında

MetaTrader için Haber Paneli, MetaTrader ticaret platformunda ekonomik takvim verilerini görüntüleyen bir araçtır. Araç, finansal haber siteleri veya veri sağlayıcılar gibi dış kaynaklardan ekonomik haberleri ve veri yayınlarını çeker ve bunları okunması kolay bir biçimde görüntüler. Araç, tüccarların haber bültenlerini kaynağa, saat dilimine, etki düzeyine, para birimine ve bildirim yöntemine göre filtrelemesine olanak tanır. Ayrıca, kullanıcının verileri manuel olarak güncellemesini ve mevcut

Japon şamdanları bize forex piyasasında fiyatın nasıl davrandığı hakkında çok şey söyleyebilir ve bu nedenle bu uzman, işlemleri yerleştirmek için mumları ve boyutlarını analiz eder.
Japon şamdanlarının ardışıklığı ve boyutları, bu uzman danışmanın özel algoritmasını kullanıyor.
Uzman, mevcut piyasa koşulları için optimize edilmiştir ve EurUsd çifti, M15 zaman dilimi için varsayılan ayarlar yapılmıştır.
Diğer çiftler için ek set dosyaları "Yorumlar" bölümünde bulunabilir.
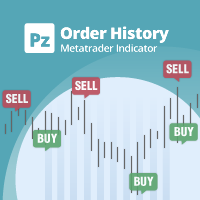
Strateji test cihazının görsel moduna çok benzer şekilde, herhangi bir canlı grafiğin işlem/sipariş geçmişini görüntüleyen genel amaçlı gösterge. Eğitici, iyileştirme, tersine mühendislik veya teşhis amaçlı herhangi bir belirli sembolün gerçek ticaret geçmişini incelemenizi sağlar. Hem ana hem de yatırımcı şifresi ile başarıyla kullanılabilir.
[ Kurulum Kılavuzu | Güncelleme Kılavuzu | Sorun Giderme | SSS | Tüm Ürünler ]
Bazı temel özellikler şunlardır:
yönlü analiz
Her işlem için kar ve
FREE

Koala Trading Solution Kanalına katılın ve MQL5 topluluğunda en son sinyalleri ve tüm Koala ürünleri hakkındaki haberleri öğrenin. Katılım bağlantısı aşağıda: https://www.mql5.com/en/channels/koalatradingsolution Açıklama :
Forex piyasasında (PSAR) profesyonel ve popüler göstergelerden birine dayanan yeni ücretsiz göstergemizi tanıtmaktan mutluluk duyuyoruz (PSAR) bu gösterge orijinal Parabolik SAR göstergesinde yeni bir değişikliktir, pro SAR göstergesinde noktalar ve fiyat tablosu arasında
FREE

(Otomatik çeviri) Çoğu yatırımcı, 1700'lü yıllarda Munehisa Homma tarafından oluşturulan ünlü Japon Heikin-Ashi göstergesinin farkındadır. Bazen Heiken-Ashi olarak yazılır, ancak anlamı aynı kalır, yani Japonca'da "ortalama çubuk". Bu, çok iyi bilinen Heikin Ashi göstergesinin bir uygulamasıdır, ancak birkaç ek özellik eklenmiştir. Birincisi, ister tıklama sayımı hacmi , ister gerçek hacim , ister gerçek aralığa dayalı sözde hacim olsun, değerlerinin hacim ile ağırlıklandırılmasına olanak tanır.
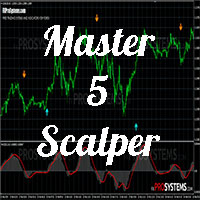
Merhaba tüccarlar, özellikle de yüzücüler bu sefer, 5 dakikalık bir zaman diliminde scalpers için özel bir gösterge tanıtıyorum
Bu göstergenin, anlaşılması kolay bir scalper göstergesi arama konusunda kafası karışmış yeni başlayanlar için yardımcı olması bekleniyor.
tamam devam et
Bu gösterge yalnızca 5 dakikalık bir zaman diliminde çalışır Bu gösterge ayrıca ticaret platformunuza MQID girerek tüccarlara mobil aracılığıyla bildirim sağlayabilir.
Bu gösterge, değiştirilmiş stokastik osil

MT5 Version MA Ribbon MT4 MA Ribbon is an enhanced indicator with 8 moving averages of increasing periods. MA Ribbon is useful to recognize trend direction, reversals and continuation points in the market as well as potential entry, partial take profit and exit points. Entry points for long and shorts position can be found when the price entries or leaves the Ribbon, at retest or a defined number of MA crossovers. It offers a good combination with mostly any volume or momentun indicators to f
FREE

MT5 Version Fibonacci Bollinger Bands MT4 Fibonacci Bollinger Bands is a highly customizable indicator that shows areas of support and resistance. This indicator combines the logic for the Bollinger Bands with the Fibonacci level. Fibonacci Bollinger Bands is the first indicator in the market that allows the user to 100% customize up to 12 Fibonacci levels, the Moving Average type and the price data source to use for the calculations. This flexibility makes the Fibonacci Bollinger Bands easi
FREE

** All Symbols x All Timeframes scan just by pressing scanner button ** ***Contact me after purchase to send you instructions and add you in "RSI scanner group" for sharing or seeing experiences with other users.
Introduction RSI divergence is a main technique used to determine trend reversing when it’s time to sell or buy because prices are likely to drop or pick in the charts. The RSI Divergence indicator can help you locate the top and bottom of the market. This indicator finds Regular div
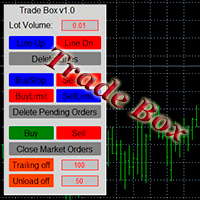
A small trading panel makes it easier for a trader to visually place pending orders, market, as well as trailing and unloading the grid of orders.
It is installed as a regular adviser. Parameters and description:
Lot Volume: 100 - in this field you can set, change the order volume at any time
Line UP - visual horizontal level for pending BuyStop and SellLimit orders
Line DN - visual horizontal level for BuyLimit and SellStop pending orders
Delete Lines - delete all lines f
FREE
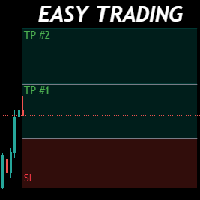
Money Management will help you to Easy Trade with One Click , instance and pending, set SL, and manage number of your TP . You can use this expert for different currency pairs, CFDs, cryptocurrency, and stocks .
The basic formula for calculating pip value and position size which has been used in this expert are:
Pipette Value = Position Size * (Exchange Rate (Base Currency) / Entry Price) * Contract Size * Digits Exp. Account Currency: USD Currency Pair: GBPJPY Position Size: 0.05 Lot = 500
FREE

The Man Exclusivet Expert Advisor can be run on any timeframe, on any currency pair, and on any broker's server. Unique trading system! The expert system works with ticks using sharp tick movements. For the internal algorithm, the elementary unit of analysis is a tick. It is recommended to work on liquid Forex pairs with a low spread and use VPS. You can start using it with $ 100 and 0.01 lot. It is also worth noting that with an acceptable spread level, the bot goes through any historical p
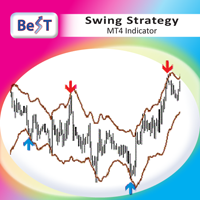
BeST Swing Strategy is a Metatrader indicator based on the corresponding Jim Berg's work about volatility as described in his article "The Truth About Volatility" (TASC 2/2005).The indicator consists of 2 channel lines deriving as (MA +/- times the ATR) and can be used as a standalone trading system.The outlier prices of the Market as of the indicator's values can be used for producing Entry and Exit Signals.
Advantages of the indicator == Uses 2 Swing Strategies (Normal and Reverse)
== Ne

Usual martingale grid. The decision-making logic is based on 3 lines of the Moving Average indicator. In the settings, the period of only the first line is set, the periods of the remaining two are calculated based on the first (the period of the second line = the period of the first line multiplied by 2, the period of the third line = the period of the first line multiplied by four and + the period of the first line)
Buy signal: The first line is directed upwards and is above the second and
FREE

Allows you to find the average volatility / expected price movement for ANY custom period starting at ANY time of day. Simply set a vertical line at the desired entry time and calculate your TP target within the expected volatility range. Indicator places 5 custom vertical lines on chart at the same times each day throughout the history + gives live alerts with custom text each day. 1. Get the average price movement / volatility of ANY time period starting at each vertical line, so you know h

In order to understand the work of a bot Steadily forward , first of all, you need to understand what parameters it has. Therefore, I believe that a detailed description of the parameters will be the best description of the bot. Since it will give the user an understanding of what he is dealing with and will allow him to decide, this bot is suitable for his trading style and will allow his broker to work with the help of this bot. Be sure to set Fake Robot On = false Basic parameters, a number

This tool is very helpful when trading and increasing the profits by placing certain trades (defined in the settings) with equal distances when you place Buy / Sell orders. It helps in securing the account by using the layering method. Once the price hits the first TP, the EA will move the SL to the entry level, then once the price hits the 2nd TP, the EA will move the price to the first TP level. All the TP and SL generated by the EA can be manually adjusted on the chart itself. It works on any

Features:
- Moving Average Slope for Max Past Bars - Slope Period - Slope Thresholds - Multiple Slope Type options - See slope visually as a histogram - Info Panel Show/Hide Slope Calculations and Types:
The slope value is calculated using the Slope Period. Suppose Period is 5, it will check the MA value for bar (x) and bar (x+5). And find the slope angle between them.
Read detailed description about Slope Types and Settings here: https://www.mql5.com/en/blogs/post/747651
FREE

This strategy is best used for Scalping and Binary Options. Strategy: There are 3 EMAs: Faster, Medium and Slower. When Price is Trending, wait for Price to bounce an EMA and scalp at each bounce. Features: - Check if 3 MAs are Stacked - Check Price Bounce Off MAs (Faster, Medium, Slower) - Min Distance Between Faster and Medium MA Filter - Max Distance Between Entry Price and Faster MA Filter - High Volume Check - Heiken Trend Check - Volatility Check - Higher/Lower Timeframes MA Stacked check

Factor EA is a fully automated scalping strategy expert advisor that runs on the M1 timeframe. Advisor settings are based on a safe trading strategy, the essence of which is to close the transaction, upon reaching a positive dynamism of profitability of several points, which allows the user to reduce the cost of opening losing trades. The EA is multifunctional and does not require a certain type of account for normal functioning. The EA’s mechanism of work is arranged so that before opening a
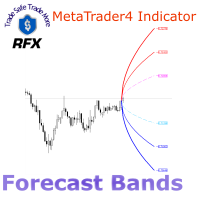
The RFX Forecast Bands indicator calculates the three significant confidence levels, 99%, 95% and 68% of price movement for a configurable number of bars in the future. The essence of calculations is based on statistical analysis of the asset's recent price changes. These levels can be used for many different purposes in trading systems. For example, one can use them for setting the target profit and stop loss levels effectively. The extreme upper and lower bands represent 99% confidence level,

Ilan Universal is an automatic advisor (trading robot) used for trading in all financial markets. It is in demand among beginners and experienced traders due to such advantages as the exact execution of the trading rules of the chosen strategy, the reduction in the number of subjective errors, and the release of the user's time. The recommended deposit is $10,000. The great value of this algorithm is the possibility of optimizing by opening prices and correctness after such optimization of w

The Qv² Halifax - Indicator developed through a complex series of calculations, which aims to easily identify buylng and selling signals.
Buy signal are indicated by up arrows.
Sell signal are indicated by down arrows.
An important detail: In order to make the indicator work, the timeframes M1, M5. M15. M30, H1 D1 must be all updated.
It can be used on all pairs (I use it on Gold).
it is a very good deal in the trending market
To learn more about my work click here

PROMO:
SPEND MORE TIME WITH YOUR FAMILY. ENJOY LIFE… DO NOTHING.
We would like to share our coding skills to fellow traders and most especially to people from all walks of life to have the opportunity to trade or invest using auto-trading way to provide other source of income while letting the robot and your money works for you. Recommendations:
Timeframe: H1 (Any Timeframe) Supported currency pairs: EURUSD , EURCHF, USDCAD, AUDCAD, EURAUD and many more except *** JPY*** Pairs ...

A smart, next-generation Analyst STD robot. Taking into account all imaginable pitfalls when testing and working in real mode. The bot can be optimized by opening prices, and work on all ticks without problems. The bot has two versions, it can successfully work both on mt4 and mt5, both on netting and hedging accounts. For those who bought one of the versions of the bot, the second one will be half price. The EA handles errors correctly and works reliably on the market. The EA uses the followin

This is a multi-currency converter script that can convert the currency of the account history to another currency and output it. Since it supports multiple currencies, it is possible to exchange USD, EUR mutual conversion, JPY, GBP, AUD, or other minor currencies. Currency Exchanger can be converted to other currencies immediately by executing it once, so anyone can easily exchange currency. Let Currency Exchanger do the tedious work! The exchange result from the account history can be output a

RSI Trend Line is a simple indicator that draws trend lines.
Parameters:
Level Step - the step between the highs and lows.
Period_RSI - standard parameter of the RSI indicator.
Upper Line Color - sets the color of the trend lines for UP.
LowerLine Color - sets the color of the trend lines for Down.
Alerts - the parameter is responsible for On/Off notifications when trend lines intersect with RSI. By default, it is On.

If you like this project, leave a 5 star review. Often times we are using brokers that are outside of the GMT-0 timezone, this
not only complicates things, but, it can make seeing when a trading session starts
a bit more difficult than it should. This indicator allows you to set a timezone offset it will draw a vertical line for the: Day. Week. Month. Quarter. year.
FREE

The adviser picks up all positions on any currency pair and in any direction of the transaction, on any time frame: the opening of the transaction is done manually, the adviser is installed separately on any chart window. Closes 5 goals automatically configured by you, call points and volume. You can also set a stop loss, and at what target it will shift to the value you have chosen. There is still a "breakeven" in the setup, which allows you to shift the stop loss by the volume of points you ha
This indicator helps to trade in the right direction of the market, by knowing the bias of the market. If you are a swing trader this is the best indicator for you. You will just see the bias on the top right of your chart/screen. You can sometime wait for reversals then continue with the trend/bias. Indicator is based on moving averages and showing daily bias of the market. KEEP IN MIND THAT THE BIAS IS STRICTLY SHOWING THE DAILY TIMEFRAME TREND ONLY.
You can check the video attached.

NEW : integration with Ofir Signals to send personalized alerts Ofir Notify is a tool which send alerts on trades to Telegram Alert on any event concerning a position : Opening, Closing, modification (SL, TP) Send alerts to Chats, Groups and Channel Alert on Equity change Display Risk, Reward and progress of profit/lost for each position Customization of alerts Sending charts screenshots with alerts Send signals from your indicators or experts Multi-lingual NEW : version 2 brings integratio
FREE
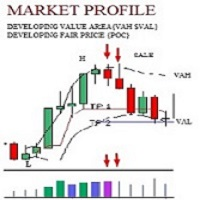
The Market Profile is a unique charting tool that enables traders to observe the two-way auction process that drives all market movement—the ebb and flow of price over time — in a way that reveals patterns in herd behavior. Put another way, the Profile is simply a constantly developing graphic that records and organizes auction data The most important feature is the Value Area, representing the range of prices that contain 70% of a day’s trading activity. This 70% represents one standard devi
Highly configurable Force Index indicator. Features: Highly customizable alert functions (at levels, crosses, direction changes via email, push, sound, popup) Multi timeframe ability Color customization (at levels, crosses, direction changes) Linear interpolation and histogram mode options Works on strategy tester in multi timeframe mode (at weekend without ticks also) Adjustable Levels Parameters:
Force Index Timeframe: You can set the current or a higher timeframes for Force Index. Force In
FREE

Просдка и прибыль зависят от Greed_Size = от 1 до 1000 1% = самый безопасный, будет раньше выходить из позииции при 100% = расчет лота будет максимальный при 200% = максимальный удвоеный, выход из позиции также будет передерживать Символ XAUUSD (Gold (Spot)) Период 1 Минута (M1) 2022.01.10 01:05 - 2022.01.21 23:54 (2022.01.08 - 2022.01.24)
Баров в истории 9896 Смоделировано тиков 629527 Качество моделирования 25.00% Ошибки рассогласования графиков 0 Начальный депозит 10000.00 Спред 1
FxGold Marathon BreakOut is a simple but effective trading system based on breaking out price parttern. EA is a long term stable growth trading system with realistic result . EA designed for XAUUSD (GOLD) which is a volatile and highly liquid commodity Features: Account protection by acceptable consecutive loss. Auto MM Don't need fast VPS just laptop or pc and stable internet connection, you can shut down at the weekend then start it up before market opening like i'm doing. All opened positi

торговая система с риском 1% чем больше денег на счете тем больше лот но риск 1%
Начальный депозит 50.00 Спред 10 Чистая прибыль 6.71 Общая прибыль 51.97 Общий убыток -45.26 Прибыльность 1.15 Матожидание выигрыша 0.02 Абсолютная просадка 26.79 Максимальная просадка 29.21 (55.47%) Относительная просадка 55.47% (29.21) Всего сделок 427 Короткие позиции (% выигравших) 219 (72.60%) Длинные позиции (% выигравших) 208 (72.12%) Прибыльные сделки (% от всех) 309 (72.37%) Убыточные сделки (%

Торговый советник по пробойной стратегии с использованием мартингейла. Vik Plan B Like - это укороченная версия советника Vik Plan B, с минимальными настройками. Для входа в сделку использует свечной анализ. Входные параметры: StartHour - старт торговли StopHour - стоп торговли FixLot - фиксированный лот UseMartin_Mini - вкл/откл мартин Kol_ord - ограничение количества ордеров Step - шаг мартина MuitiLots - множитель лота для мартина MaxLot - ограничение лота для мартина UseCloseAllP

Индикатор Super Ma Arrows состоит из модифицированной средней скользящей и стрелок. Индикатор предназначен для скальпинга. Индикатор Super Ma Arrows не перерисовывает не меняет значения при переключении таймфреймов The Super Ma Arrows indicator consists of a modified moving average and arrows. The indicator is designed for scalping. The Super Ma Arrows indicator does not redraw does not change values when switching timeframes

Hello traders nice scalping tool
this indicator design for find best point to enter market in all time frame
indicator no repaint , no redraw , no lagging very accurate indicator just test it in strategy tester and see yourself !
you can use it for any pairs and indices CFD base of this indicator is cci so you can change period of it in input taps of indicator but default is optimized before ! good luck
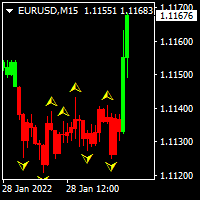
This indicator helps you to build position and profit when market turns in your favor. You will build your full position by trading many small position. If there is green colored candle on the chart, you could add long position. If there is red colored candle on the chart, you could add short position. I personally spread my full size position in to 5-10 small position. I use small target of 2-5 pips on eurusd pair.
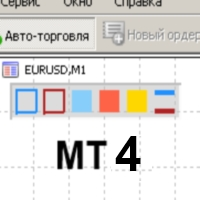
Color Levels - удобный инструмент для тех, кто использует технический анализ с использованием таких инструментов, как Трендовая линия и Прямоугольник. Имеется возможность настройки двух пустых прямоугольников, трех закрашенных и двух трендовых линий. Настройки индикатора крайне просты и делятся на пронумерованные блоки: С цифрами 1 и 2 вначале - настройки пустых прямоугольников (рамок); С цифрами 3, 4 и 5 - настройки закрашенных прямоугольников; С цифрами 6 и 7 - настройки трендовых линий. Объе

Этот индикатор имеет универсальный алгоритм торговли, который основан на импульсе цены . Все максимально упрощено - только сигналы на Buy и Sell . Есть оповещения, чтобы не пропустить открытие позиции.
Не требует оптимизации и дополнительных настроек!
Для любых типов инструментов: валюты, нефть, металлы, криптовалюты. Для любых таймфреймов: от M1 до D1 . Для любых стилей торговли: скальпинг, интрадэй, свинг, долгосрок . Если Вам необходима дополнительная информация или есть вопросы
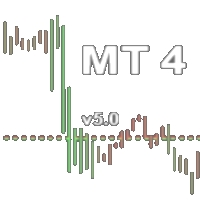
Индикатор закрашивает бары по цвету, выбор цвета ведется из расчета торгового объема валютного инструмента. вертикальную линию есть возможность перемещать для изучения на исторических данных горизонтальные линии отвечают за максимальный и минимальный бар зеленый большой объем красный маленький объем настройки: выбор ширины окраски бара выбор количество баров для расчета
Есть возможность доработать индивидуально: вывод звуковых сигналов вывод сообщения в телеграмм комбинировать с другим индика

The indicator (Current Strength) is represented in a separate window by Blue and Pink histogram . The parameter NPeriod represents the number of bars on which we calculate the variation of forces, the recommended value is 5. The Blue histogram measures the buyers force , while the Pink histogram measures the sellers force . The change in color signifies the change in strength which leads t he price . Each drop (especially below 52.8) after touching levels 96.3 or 1.236 must be condidered
MetaTrader Mağaza, geliştiricilerin ticaret uygulamalarını satabilecekleri basit ve kullanışlı bir sitedir.
Ürününüzü yayınlamanıza yardımcı olacağız ve size Mağaza için ürününüzün açıklamasını nasıl hazırlayacağınızı anlatacağız. Mağazadaki tüm uygulamalar şifreleme korumalıdır ve yalnızca alıcının bilgisayarında çalıştırılabilir. İllegal kopyalama yapılamaz.
Ticaret fırsatlarını kaçırıyorsunuz:
- Ücretsiz ticaret uygulamaları
- İşlem kopyalama için 8.000'den fazla sinyal
- Finansal piyasaları keşfetmek için ekonomik haberler
Kayıt
Giriş yap
Gizlilik ve Veri Koruma Politikasını ve MQL5.com Kullanım Şartlarını kabul edersiniz
Hesabınız yoksa, lütfen kaydolun
MQL5.com web sitesine giriş yapmak için çerezlerin kullanımına izin vermelisiniz.
Lütfen tarayıcınızda gerekli ayarı etkinleştirin, aksi takdirde giriş yapamazsınız.