Смотри обучающее видео по маркету на YouTube
Как купить торгового робота или индикатор
Запусти робота на
виртуальном хостинге
виртуальном хостинге
Протестируй индикатор/робота перед покупкой
Хочешь зарабатывать в Маркете?
Как подать продукт, чтобы его покупали
Технические индикаторы для MetaTrader 4 - 94

DMAX SIGNAL IS VERY POWERFUL TOOL TO HELP YOU ENTRY,ITS CAN DETECT OVERSOLD AND OVERBOUGHT IN FOREX MARKET. ITS CAN TRADE 24 FOREX PAIR IN MARKET, 80% ACCURATE RESULT. MANY TRADER FAIL BECAUSE OF ENTRY POINT AND EXIT POINT , SIGNAL OF DMAX WILL GIVE VERY GOOD SIGNAL TO LET YOU KNOW WHERE TO ENTRY AND EXIT. RISK MANAGEMENT IS VERY IMPORTANT IN TRADING FOREX, PLEASE DONT RISK OVER 5% PER TRADE IS FORE MARKET
The Average True Range (ATR) is a tool to measure volatility. ATR MTF (Multi Time Frame) indicator provides all timeframe trends helps to identify in which kind of volatility environment the market .This indicator can be used with any Trading Systems for additional confirmation of trading entries or exits. It is a very helpful tool to calculate Targets and Stops according the current market conditions.

bull and bear filter helps you choose the most tradable currencies, saves most of you time,so you can focus on trading instead of filtering the tradable currencies exhaustedly. 1. It works in the main chart window, the red currency pair means it's bear market, green mean bull market, white means the currencies are not filtered,neither bull nor bear, they are invisible if the chart background is white. 2. the main chart timeframe has no impact on filtering, it's based on the variable you assign i

Индикатор EasyWay TradePanel для МТ4 - это торговые помощники для ручной торговли любой валютой на Форекс и Криптовалутой как Биткойн, Етериум, Лайткойн и другими. Также EasyWay можно использовать для Золата,Сребра и Акции,Петрол . При установке на график в выбранном вами таймфрейме и торговом инструменте индикатор автоматически рисует следующие пользовательские индикаторы, используемые в торговой стратегии EasyWayTradePanel.
1) Zigzag_Extreme_Indicator, 2) Regression_Channel_Indicator, 3) Bu
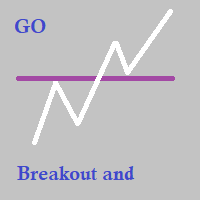
GO Breakout and Retest is probably the best price action indicator you can currently find on the market. Designed for price action traders and not only, the indicator helps you spot retests after breakouts of supply / demand zones.
After purchase, leave a review, a comment or make a screenshot of your purchase and contact me to receive for free the Trade Entry Manager utility !
Please read the full description of the product in order to use the indicator properly !
Feel free to check out
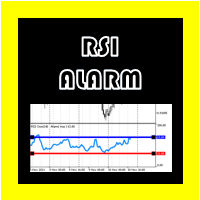
RSI ALARM (для Metatrader 4)
Этот индикатор работает как обычный RSI со всеми его настройками (периодичность, цвета, уровни и т. Д.),
но, кроме того, могут быть установлены сигналы тревоги на верхнем и нижнем уровне (Примеры 70 и 30) с возможностью регулировки этих уровней, перемещая верхнюю и нижнюю линии на индикаторе.
Вы также можете активировать и деактивировать дополнительную функцию, которая помещает стрелку на график при достижении ожидаемого верхнего или нижнего RSI.
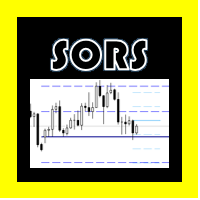
THE SORS COMPLEXES (For Metatrader 4) This indicator is designed to draw the SORS lines on the graph, these are the modern way of calculating market points that it usually respects, they are comprised of supports and resistance, but unlike the classics, these are calculated from volatility endogenous and standard deviation, In the configuration you can change the color of each level linear and hide the ones that are not needed. A = Annual. M = Monthly. W = Weekly D = Daily.

При анализе финансовых временных рядов исследователи чаще всего делают предварительное допущение о том, что цены распределены по нормальному (гауссовскому) закону. Такой подход обусловлен тем, что с помощью нормального распределения можно моделировать большое число реальных процессов. Кроме того, вычисление параметров этого распределения не представляет больших трудностей. Однако в применении к финансовым рынкам нормальное распределение работает далеко не всегда. Доходности финансовых инструмен
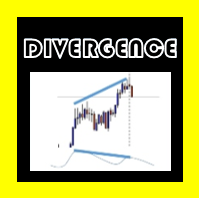
DIVERGENCE OSW (для Metatrader 4)
Этот индикатор работает на дивергенциях и имеет следующие функции:
Генерация предупреждения при возникновении расхождения. Создавайте линии, вычисляя стоп-лосс и тейк-профит согласно проекционным волнам обратных волн. Нарисуйте стрелку, указывающую возможное направление рынка. Сигналы, посылаемые индикатором, подаются, когда свеча заканчивается. Трейдер должен оценить каждое расхождение, чтобы сделать вход. Настройки:
Активация и деактивация предупреждени
PRICE Direction Predictor Indicator (LOW BUY PRICE 4 Limited time) This Indicator provides Buy/Sell Signal based on calculations on Higher frame (main Trend) and Lower frame(Entry signals) * You should select the higher and lower frame for indicator calculations * You select the Trend line colors as you prefer * Enable or disable Alerts! Trend lines UP/Down are drawn when a trend is detected Wait for small arrows for entry : *Normally an UP arrow in an UP Trend is a BUY signal : ---you Close
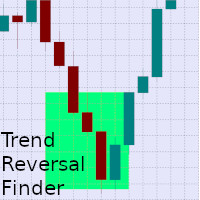
Listed in his faous book "Trading chart patterns like the pros", Suri Duddrella outlines the N-bar rally and decline reversal pattern, which simply states that when stocks make a new high or new low, momentum players will push this stock down or up until eventually they run out of steam. This indicator will look back a certain number of bars to find a continuous uninterrupted rally or decline. Once found, the pattern will look forwards to find the first bar that closes, within a certain range,

Сигнальный трендовый индикатор. Определяет направление тренда и окрашивается в соответствующий цвет.
Имеет встроенные звуковые и визуальные оповещение о смене тренда. Может отправлять уведомления на ваш телефон или на емеил. Позволяет вести трендовую и контр трендовую торговлю. Работает на всех таймфреймах, на всех валютных парах, металлах, индексах и криптовалюте. Можно использовать при работе с бинарными опционами. Отличительные особенности Не перерисовывается; Простые и понятные настройки;

A huge overhaul and improvement on the highly successful Three Line Strike Finder https://www.mql5.com/en/market/product/60396?source=Site+Profile+Seller This fantastic tool will scan your selected timeframes, and display new three line strike patterns as they appear. No more having to flip through different timeframes to check if a new three line strike pattern has emerged. The supported timeframes are, the current timeframe, 15 minute, 30 minute, 1 hour, 4 hour and Daily, all of which can be

COMMERCIAL SESSIONS This indicator shows in the selected graph divided by tables each of the sessions ASIA, JAPAN, LONDON, NEW YORK: Allows you to configure: Session Color ASIA, JAPON, LONDRES, NEW YORK Hide and show each session It works in the lowest timeframes on the market, among which H4, H1, M15, M5 and M1 are recommended. (Don't forget to check out our other indicators)
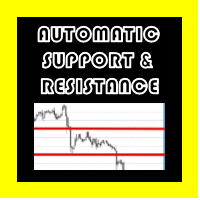
Автоматическая поддержка и сопротивление Osw MT4
Este Indicador grafica líneas en los posibles puntos de soportes y resistencias del activo seleccionado.
funciona en múltiples temporalidades.
конфигуратор пермитов:
Color de las líneas. Анчо де лас линеас. Tipo de líneas. Cuando el indicador empieza su funcionamiento, analiza los soportes y resistencias de niveles superiores para la temporalidad en la que se esta trabajando.
Tired of looking at indicator cluttered charts? Are you a trend trader? I have just the solution for you. Trend Boss.
This indicator allows you to choose some of the most popular trend identifiers such as CCI(Supertrend) or Ichimoku and pair them with some of the most popular entries such as Kijun/Tenkan cross or MACD zero cross. You can now keep your charts clean by hiding all those oscillators and moving averages. Only arrows will be displayed depending on your entry criteria.
Trend filt

The use of indicators is extremely simple and does not contain future functions.
The use of indicators is divided into the following simple parts:
1. The indicator is blue (upward trend) -> only buy orders
2. The indicator is pink (downtrend) -> only sell orders
3. The indicator is white (consolidation trend) -> only wait and see without send orders
4. The price is above the indicator -> Only buy orders can be made
5. The price is below the indicator -> only sell orders
To sum

This indicator needs to be used in conjunction with the " Souline Honma Surf " indicator to achieve a higher winning rate.
The use of indicators is extremely simple and does not contain future functions.
The use of Souline honma wave indicators is divided into the following simple parts:
1. The indicator is blue (upward trend) -> only buy orders
2. The indicator is pink (down trend) -> only sell orders
The use of the Souline Honma Surf indicator is divided into the following parts

FOREX KISS is an indicator that picks out reversal/turning points , it is a combination of levels , clusters and volumes , works on all time frame and all instruments. While doing the paper works which took me 5 years, my aim was to build something that will give me consistent profit all over again while keeping it simple and stupid. My hope that this indicator will bring you confidence and precision.

Модели регрессии описывают взаимосвязь между переменными, подгоняя линию к наблюдаемым данным. В моделях линейной регрессии используется прямая линия, а в моделях логистической и нелинейной регрессии — кривая. Регрессия позволяет оценить, как изменяется зависимая переменная по мере изменения независимой переменной (переменных).
Простая линейная регрессия используется для оценки взаимосвязи между двумя количественными переменными.
Этот индикатор вычисляет разницу двух разных расчетов регресс
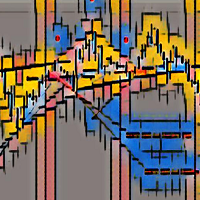
This is the one and only chart pattern indicator you need in your MT4 arsenal to for detection, showcasing and alerting for the following well-known chart patterns:
Bullish Flag Bearish Flag Bullish Pennant Bearish Pennant Bullish Cup With Handle Bearish Cup With Handle Bullish Ascending Triangle Bearish Descending Triangle Bullish Symmetrical Triangle Bearish Symmetrical Triangle Bullish Measured Move Up Bearish Measured Move Down Bullish Ascending Scallop Bearish Descending Scallop Bullish 3

Trend formation channel – это набор линий. Две центральные линии индикатора представляут собой скользящие среднии заданного типа и периода, они также образуют малый канал. Большой канал образуюю – центральные линия индикатора плюс/минус оценка среднеквадратичного отклонения, умноженная на коэффициент, выбранный пользователем. Основное правило при построении состоит в том, что около 5% цен должно находиться за пределами этих линий, а 95% – внутри. Если же цена слишком часто пересекает верхнюю ил

We are an analytics company that believe in solving complicated problems with simple solutions using data. To minimize the complexities of trading, we have created a range of trading advisory products from the essence of our proprietary STAR System to enhance trading aptitude and to guide users into becoming proficient traders.
Our innovative products capitalizes on 3 core functions – Big Data, Artificial Intelligence, and Technical Expertise and it is with this core, we reshape the world
Торговля в направлении сильного тренда снижает риск и увеличивает потенциальную прибыль. Обычно средний индекс направленности (ADX) используется для определения сильного тренда цены. Во многих случаях это лучший индикатор тренда! В конце концов, тренд может быть вашим другом, но он обязательно помогает узнать, кто ваши друзья.
ADX используется для количественной оценки силы тренда. Расчеты ADX основаны на скользящей средней расширения диапазона цен за определенный период времени. По умолчанию

The Progressing Indicator is a trend indicator . The indicator is simple and clear to use. The strategy of determining trend movements is based on the author's method of market analysis. The indicator will help you as an independent trading tool. It can also serve as an addition to your trading system. Progressive indicator accurately identifies entry points. Non-profit deals are few, but if they happen, the loss on them is comparable to the commission for opening a transaction. Summary of the P

Fibonacci retracements can be used to draw support lines, identify resistance levels, place stop-loss orders and set target prices. The Advanced Automatic Fibonacci retracements draws automatically all the levels. You have a lot of options to choose. For exemple you can use the tracements of another time frame (MTF) in the current chart, you can also choose between the closest level or less close to draw the retracements. You can also add 2 levels of your choice. You can add levels extensions o

Что такое Pivot?
Пивот - это заранее известный важный ценовой уровень, который трейдеры считают важным и могут принимать торговые решения вокруг этого уровня. В качестве технического индикатора цена разворота похожа на уровень сопротивления или поддержки. Если уровень разворота будет превышен, ожидается, что цена продолжит движение в этом направлении. Или цена может развернуться на этом уровне или около него.
Что вам говорит Pivot?
Есть развороты и опорные точки. Эти термины могут означат
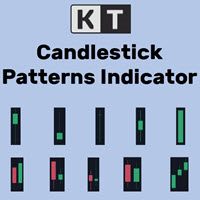
KT Candlestick Patterns finds and marks the 24 most dependable Japanese candlestick patterns in real-time. Japanese traders have been using the candlestick patterns to predict the price direction since the 18th century.
It's true that not every candlestick pattern can be equally trusted to predict the price direction reliably. However, when combined with other technical analysis methods like Support and Resistance, they provide an exact and unfolding market situation. KT Candlestick Patterns

Индикатор StatZigZag представляет собой ломаную линию построенную из различных по своей протяженности отрезков регрессионных прямых, начало каждого из которых исходит из конца предыдущего отрезка. Каждый регрессионный отрезок строится до тех пор, пока дисперсия цены вокруг него не начинает превышать критического значения, после чего построение данного отрезка заканчивается и начинается построение следующего отрезка. Такой подход обусловлен тем, что дисперсия цены вокруг регресси

Трендовый стрелочный индикатор. Для анализа использует несколько скользящих средних на разных таймфреймах и соотносит их с важными уровнями цены. Не перерисовывает стрелку, т.к. использует для расчета фиксированное количество исторических данных.
Пример работы индикатора приведен на скриншотах.
Лучше работает на трендовых участках рынка и показывает подтвержденное изменение направления цены. Не требует оптимизации.

Индикатор IndicateMe был специально создан, чтобы убирать как можно больше шума из сигналов, которые он подает.
Индикатор был объединен с несколькими другими хорошо известными индикаторами. Использованные индикаторы: «Скользящая средняя, стоастический индикатор, индекс относительной силы, скользящая».
Все используемые индикаторы можно настроить самостоятельно. По умолчанию установлены те значения, которые мне нравятся.
Легко настраивайте оповещения, чтобы всегда быть в курсе сигналов
Торговля в направлении сильного тренда снижает риск и увеличивает потенциальную прибыль. Обычно средний индекс направленности (ADX) используется для определения сильного тренда цены. Во многих случаях это лучший индикатор тренда! В конце концов, тренд может быть вашим другом, но он обязательно помогает узнать, кто ваши друзья.
ADX используется для количественной оценки силы тренда. Расчеты ADX основаны на скользящей средней расширения диапазона цен за определенный период времени. По умолчанию
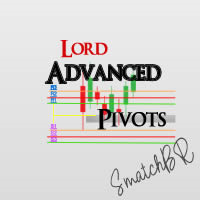
The LordAdvancedPivot Indicator is an indicator for META TRADER 4, with the function of analyzing the main daily channels of the currency pair, known as RESISTANCE, SUPPORT and PIVOT (center), to determine the levels at which market sentiment can change from "bullish" "to" low ".
Pivot points can be points that correspond to trend lines, Fibonacci levels, moving averages, previous highs / lows or closings and many more indicators, depending on the trader's philosophy.
LordAdvancedPivot has
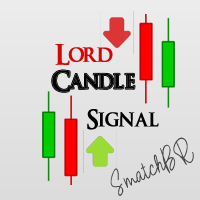
LordCandleSignal is an indicator for META TRADER 4, using by default ENVELOPES, STOCHASTIC, RSI techniques with Lord strategies in its source code.
LordCandleSignal issues a new buy / sell signal through its strategy before the action, that is, the signal comes before it happens.
Difficult to make mistakes, each signal sent, it is possible to close profitably even before the next signal, or using the Lord strategy, closing profitably every 20-50 pips in a comprehensive and safe way.
LordC

Сигналы подаются только на Buy Индикатор предназначен для бинарных опционов Сигнал подаётся во время появления новой свечи сигнализирует на 1-2 минуты рекомендуется Использовать время експирацыи не более одной свечи используемого таймфрейма Правильность в зависимости от рынка и сессии Рекомендуется торговать во время Американской сессии За период тестирование продукта перерисовки не было обнаружено если возникнут какие-либо обращайтесь возможна тестовая версия на 2 дня так как из-за специфики эт

Индикатор показывает точки входа с Risk-Reward-Ratio 1 к 5. Основной таймфрейм H1. Рабочие инструменты - все. Принцип работы - найти разворотный уровень, а потом отследить реакцию цены на этот уровень. В настройках не нуждается. Откладывает стандартно 5 уровней одинаковых тейк-профитов (красный/синий для селов и баев) и 1 уровень стоп-лосса - оранжевый.
ВНИМАНИЕ! Полная платная версия индикатора. Чтобы проверить полноценную работу индикатора на паре USDCAD перейдите по ссылке https://www.m
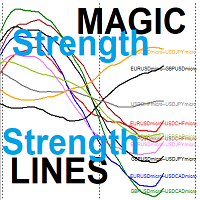
the MAGIC Smooth Strength lines for Currencies couples Each line represents the relative strength of two couples out of 5 user input symbols -> 10 indicator lines Your Strategy is based on selecting the weaker strength line and wait for a reversal sign OR Your Strategy is based on selecting the stronger strength line and wait for a reversal sign When reversal occurs you will trade on the two symbols represented by this line like the strength relative line for EURUSD and USDCAD when it is th

Vous pouvez par exemple surveiller le croisement MA en D1, pour la tendance de fond, les niveaux de surachat et de survente du RSI en H4 et du Stochastique en H4.
Cet indicateur surveille: les croisement de moyennes mobiles le niveau de surachat / survente du RSI le niveau de surachat / survente du stochastique IL vous alerte quand les trois filtres correspondent à vos paramètres (push, pop, mail) Vous pouvez choisir de l’utiliser sur un graphique pour une seule unité ou suivre plusieurs

Description Candle Power Color indicator which shows when the market is trending and when it is in a sideway movement KEY LINKS: How to Install – Frequent Questions - All Product How is this indicator useful? It allow to detect trend and sideway movements in market NEVER repaints. It adapts to any market and asset. It can support any other trading strategy. Note 1: This indicator should only be considered as a part of any trading strategy. You should complement this with other filters (e.

A top-quality from the famous XSuper Trend indicator. It is completely loyal to the original algorithm, and implements many useful features Which includes Trend Indicators as Filters like MACD,CCI and Alligator. The Chefs Super Trend Plus Indicator is a great way to identify the current market trend. The indicator shows a clear distinction between uptrends and downtrends. The indicators has optional filters for sound signal. Suitable for the following trending pairs: EUR/USD, GBP/USD, USD/JPY,
This indicators when combine with its master version can help you a better view in backtesting visual mode. https://www.mql5.com/en/market/product/61572 They will help you in developing a multi time frame trading strategy.
1) Run backtest in visual mode
2) Add the master indicator to the backtesting chart
3) Add the slave indicators to other charts of the same symbol with different time frames.
Run the backtest and you will see all the charts auto scrolling.
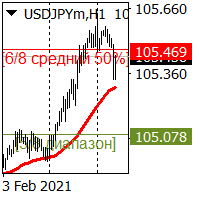
Индикатор точно отображает уровни поддержки и сопротивления. Визуализирует на графике важные сильные уровни и уровни средней силы.
Важно, индикатор не перерисовывается в зависимости от смены таймфрейм.
Индикатор можно использовать для любой формы торговли, скальпинг, среднесрок.. на любой валютной паре.
Для среднесрочной торговли рекомендуем использовать параметры по умолчанию. Все параметры в индикаторе настраиваемые. Линии индикатора выводится в основное ценовое окно.
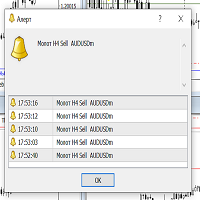
Индикатор полезен для опытных трейдеров и новичков. Отображает свечной паттерн МОЛОТ. Одновременно сканирует Н1, Н4, D1 и выводит соответствующий alert на экран в сопровождении звукового сигнала. В alert отображается информация о таймфрейм паттерна и торговом символе на котором паттерн появился. Принимать решение о входе в рынок на основании паттерна только Вам. Поскольку входить в рынок лучше от уровней поддержки и сопротивления, рекомендую использовать данный индикатор одновременно с индикатор

Описание
Bitcoin Manager - лучший индикатор для торговли на криптовалюте Биткоин. Он рассчитывается на базе отклонения цены от канала скользящих средних линий. Восходязие и нисходящие стрелки указывают потенциальные точки и уровни для открытия позиций на покупку и продажу.
Как использовать?
Настоятельно рекомендуем использовать этот индикатор на таймфрейме H1. Стрелка вверх указывает на уровень для покупки. Стрелка вниз - уровень для продажи.
Параметры
Maximum History Bars - максима
Binary options are the markets where the selected assets are traded according to the estimates in which direction they will move in a certain period. What is called active; are investment tools such as stocks, foreign exchange and gold.
For example; You think one of these instruments will move up in 10 minutes. You have purchased one of the suitable options. When your expectation comes true at this expiry, you will earn almost double your money.
The logic of the market; to make predictions
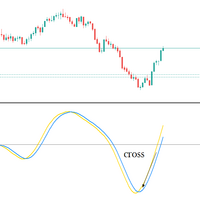
Upgraded version 1.5 , Arrow added on to indicate Buy and Sell Signal, The indicator is an ossicaltor that targets the highest buying and lowest selling levels , the signal indicated by the two lines crossing above and below zero line 0 HOW IT WORKS? Buying : you want to place your buy Entry when the yellow line is above the blue line ; stop loss just a few pips below the swing low , take profit when the lines cross again - A Buy arrow will also appear when the crossing appears Selling: yo

This strategy is best used for Trend based trading. While market is trending, price still makes smaller ranges. Darvas boxes show breakouts from these small ranges, while still following the original market trend. Detailed Description:
https://www.mql5.com/en/blogs/post/747919
Features:
- Check Darvas Box Breakout - Check Price Above/Below MA or Darvas Box has crossed MA - Min, Max Box Height - Max Distance Between Entry Price and Darvas Box - NRTR Trend Check - Heiken Trend Check - MA Slo
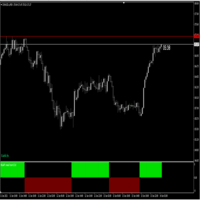
Follow Trend indicator , indicator works on Currencies , Indices ,Stocks Gold etc , good for follwoing trend on the markets suitable for scalping Buy Rules; When the histo changes to Blue you place buy order ,stop loss just below the previous swing low Sell Rules; When the histo changes to Red you place sell order ,stop loss just below the previous swing high Trade on a timeframe which best suits your trading style

This indicator calculates Correlation among currency pairs (Selected by user) to find the least and/or most correlated symbols in real time. Correlation ranges from -100% to +100%, where -100% represents currencies moving in opposite directions (negative correlation) and +100% represents currencies moving in the same direction.
Note The Correlation more than 80 (Adjustable) between two currency pairs, Shows that they are quite similar in the kind of movement and side. The Correlation less than
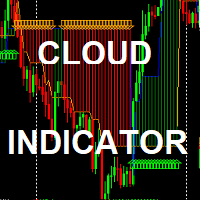
The Simple Cloud Indicator : (FREE limited time for evaluation) Strategy: Strategy is based on moving averages indicator in addition to support /resistance levels crossing *It works on any timeframe *it works on any symbols *it generates alerts *it draws uptrend / Downtrend clouds and BUY/SELL arrows inputs : *drawn start point ( in bars): not affecting strategy - it just gives you indicator history depth *alerting enable/disable

Day Trades Resistance and Support (daytradesSR) is an indicator composed of 1. The main line (support/resistance line), which shows i. either UP or DOWN trend ii. levels of dynamic support or resistance 2. A specific range defined by a line for range high and another line for range low. These lines serve as weak secondary support or resistance . 3. When the main line (support/resistance line) is first hit by the price after a detected trend reversal , either an UP ARROW (sup

Are you unhappy with the size of the main chart when using oscillators? You can add MACD, RSI, Stochastic, ATR and Momentum indicators using Main Chart Oscillators. Vertical Size : Vertical size of indicator's window Drawing Mode : Add Oscillators on same section or create a new section for any of them Draw Top Line : Draws a line in the top of indicator's section to separate it Top Line Style : Style of top line Top Line Color : Color of top line Top Line Width : Width of top line Show Indicat
Any Moving Average draws a moving average of * any indicator in a sub-window. Many Indicators included with MT4 are supported by default. You can add custom indicators as well. Settings Name Description Timeframe Select timeframe for calculation Source Indicator Select Indicator Custom Indicator Name Enter Custom Indicator Name ( when Source Indicator is set to Custom) Indicator Settings Source Indicator parameters ( separated by comma ) Moving Average Settings Moving Average parameters (
Hello Traders, A very simple but useful tool for an automatic traders. An indicator that allows you to adjust the speed of the strategy tester in a very simple way. Just drag the indicator into the chart before launching the strategy tester and adjust the speed manually, and that's all! Buttons can be located in any part of the chart as you like, just enter the x and y coordinates --------------------------------------------------------------------------------------------------------------------

Perfect Entry Spotter Indicator with Alert is based on a combination of Support Resistance, Fractals, Alligator and Moving Average indicators, based on an intense research. It has alert included with option to enable/disable it. You can trade based on it with high accuracy. Recommended trading rules: 1. Buy - Wait for the Lime arrow to appear and trade in the direction of the trend (trend going up). 2. Sell - Wait for the Red arrow to appear and trade in the direction of the trend (trend going d

This indicator is customizable to whatever settings you preferred
you only buy above the ema, and sell only under the ema using the stochastic as an entry and the ema to filter bad trades DEFAULT SETTINGS: Stochastic(8,3,3) EMA (200) *Non-Repainting
*For Desktop MT4 Only
*Great For Scalping
*Great For Swing Trading
*Arrow Entry Alerts
*Mobile Alerts
*Works On Any Timeframe
*Works On Any Mt4 Pair
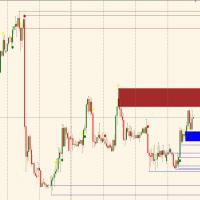
It automatically tracks the supply and demand zones and indicates the current trend. Once you have identified the trend on the main time frame just wait for the price on the operating time frame to arrive in the near future of a demand (buy) or supply (sell) zone and execute the trade. It is recommended to wait for the higher time frame trend and operational time frame to be aligned and operate exclusively on the areas indicated by the. Developed the right awareness you can achieve more and more
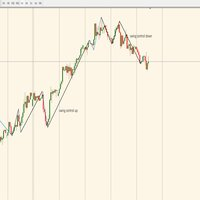
Indicator automatically translates control swings (trend-dominated market) and correction swings (retracing market); It is a simple indicator to be combined with your strategies in order to improve them and enter the market only when the trend is in control; Check on the largest time frame how the market is moving (swing black color control or swing blue color correction) from here, going down from time frame to set its operation in the direction of the trend. OPERATIONAL EXAMPLE: LOCATE DOWNWAR

We Trade Live Trend Max Our team of engineers have programmed a great tool which we have used to success and will aid you in making better decisions when placing a trade, we believe it is better than anything available on the market at the moment! try & Test Against other products and see for yourself how amazing this is. Our Main Objective is to help you as traders discover how you can take a simple trading setup and make consistent profits. We provide the fundamentals needed to trade the marke

This indicator identifies the major and minor swing high and low points on a chart. It then takes the most recent swing and draws a fibonacci pattern of retracement and extension levels to give you an idea of where price may move next. It allow allows you to set a pair of moving averages to help identify the direction of the overall trend. There are configuration parameters for the major and minor swing and the moving averages.
индикатор для бинарных опционов сигнал появляется вместе с открытием новой свечи сигнализирует на неё полное отсутствие перерисовки рекомендации сигнал на покупку синяя стрелка направлена вверх сигнал на продажу красная стрелка направлена в низ время экспирацыи рекомендуется 1 свеча используемого таймфрейма если сделка оказалась убыточной можно увеличить сумму и отрыть сделку ещё раз на следующем сигнале
инструмент прост в настройках всего два периода оптимальные настройки иже установле

LinearRegressionDecomposition ( LRD ) Linear Regression Decomposition has been calculated using a very complex method.
Basically, by examining the retractions of the price movements of the instruments on the Metatrader platform, it is aimed to decompose these movements linearly.
The indicator is shown on the graph with two separate lines.
The red line is our main indicator and handles the price divergence.
The blue line filters the red signal.
For example, for a buy signal to occur: the red

After Purchase, Please Contact
t.me/hakimsann
These Indicator are Mixed on All Logical Value Such As
Trend
Support and Resistance
Candle Pattern
Price Action
we Combine
2 Bollinger Band
6 Zigzag Periods
4 Relative Strength Index Period
1 MACD Trend
Support and Resistance
Price Action
Pattern Candle
Avoiding Doji On Market Can Be Applied On Every Market
24-7
Maksimum Martingale lv 5.
First stake 0.4% Balance

Murrey Math Multi Timeframe Indicator Support/Resistance
Murrey Math Lines are strong tools to plot the support and resistance levels.
Murrey Math Multi Timeframe Indicator draws multi timeframe MM lines on a smaller tf chart.
General Information: According to Gann, prices move in 1/8's, these 1/8's act as points of price support and resistance as an entity's price changes in time. Given this 1/8 characteristic of price action, Murrey assigns properties to each of the MML's in an a given
We Trade Live Trend Entry & Exit is another fantastic addition to the the We trade Live trend Indicator collection This Indicator works fantastically well with our other Indicators. This Indicator is primarily used to enter a trade & Exit a Trade , and to alert you when you could possibly take a short or long on a current trend , it provides alerts on when there is a change in direction on the trend you are trading but please make sure you take into account all variables, before entering a trade

Индикатор Velocity of price change ( VP ) показывает среднюю скорость изменения цены на тех характерных промежутках времени, где эта скорость была приблизительно постоянной. Используемый в VP робастный алгоритм сглаживания цены от ее случайных скачков, обеспечивает надежность показания индикатора, который не реагирует на простую волатильность цены и её незначительные подвижки. Индикатор позволяет отслеживать тренды и моменты их разворотов , во время которых показ

Koala Trend Line Введение: Я сделал этот индикатор, чтобы помочь трейдерам лучше находить тренд, этот индикатор может показать вам текущую линию тренда. Как вы знаете, линия тренда должна проходить между двумя самыми высокими или самыми низкими точками. Итак, основная логика - найти самые высокие и самые низкие точки. Индикатор находит все самые высокие и самые низкие точки в истории и показывает их красными и синими точками. Эти самые высокие и самые низкие точки рассчитываются в соответствии

The ATR Levels Indicator For MT4 is an indicator that is built specifically for traders who use the Meta Trader 4 for their trading analysis, charting of different currency pairs and trading assets, doing their technical analysis and making trading decisions all through the trading day as they work.
One of the first major advantages of using the ATR Levels Indicator For MT4 is that it automatically helps the trader to spot very important levels in the markets based on the Average True Range In
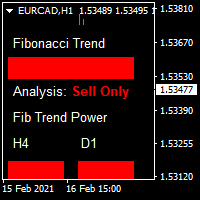
buy and sell indicator It will show you the exact entry where to buy and sell along with the indicator that will tell you the bias of the trend. For it has the ability to make your drawdowns less painful and your winning % higher, as you are following with the trend. Entries will be indicated via blue and red boxes right beside with the candles, if blue boxes will show in the charts it means buy and for the red it means sell, you follow it up with the secondary indicator which is the fib trends.
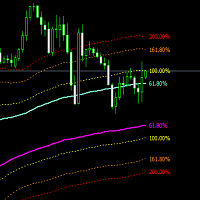
DYNAMIC CHANNEL Forex is a Metatrader 4 (MT4 (MT4)) indicator and the essence of this technical indicator is to transform the accumulated historical data. Forex DYNAMIC CHANNEL Indicator provides for an opportunity to detect various peculiarities and trends in price dynamics which are invisible to the naked eye. Based on this information, traders can assume further price movements and adjust their strategy accordingly.
Dynamic channel, which is calculated based on the maximum distance between
А знаете ли вы, почему MetaTrader Market - лучшее место для продажи торговых стратегий и технических индикаторов? Разработчику у нас не нужно тратить время и силы на рекламу, защиту программ и расчеты с покупателями. Всё это уже сделано.
Вы упускаете торговые возможности:
- Бесплатные приложения для трейдинга
- 8 000+ сигналов для копирования
- Экономические новости для анализа финансовых рынков
Регистрация
Вход
Если у вас нет учетной записи, зарегистрируйтесь
Для авторизации и пользования сайтом MQL5.com необходимо разрешить использование файлов Сookie.
Пожалуйста, включите в вашем браузере данную настройку, иначе вы не сможете авторизоваться.