Смотри обучающее видео по маркету на YouTube
Как купить торгового робота или индикатор
Запусти робота на
виртуальном хостинге
виртуальном хостинге
Протестируй индикатор/робота перед покупкой
Хочешь зарабатывать в Маркете?
Как подать продукт, чтобы его покупали
Технические индикаторы для MetaTrader 4 - 31

Bollinger Bands Stops Indicator for MT4 The Bollinger Bands Stops Indicator is a versatile tool designed to help traders make informed decisions in the financial markets. Developed for the MetaTrader 4 (MT4) platform, this indicator provides valuable insights by visually representing the Bollinger Bands along with stops and signals. Key Features: Bollinger Bands Analysis: The indicator incorporates Bollinger Bands, a widely used technical analysis tool. These bands help traders identify potentia
FREE

EMA Separation рисует 2 экспоненциальные скользящие средние, и заполняет пространство между ними. Цвет заполнения выбирается в зависимости от направления тренда: восходящий (EMA с коротким периодом выше EMA с длинным периодом) или нисходящий (EMA с коротким периодом ниже EMA с длинным периодом) Это небольшой инструмент для помощи в визуализации разницы между средними с длинными и короткими периодами. Надеемся, он вам понравится. EMA Separation также можно сочетать с бесплатным инструментом EMA S
FREE

3 стратегии с RSI! Алерты! Проверка на свежесть сигнала! Индикатор основан на классическом RSI. Рекомендую посмотреть моего советника - Night Zen EA
Подпишись на мой telegram канал, ссылка в контактах моего профиля . В него включены 3 стратегии: Вход индикатора RSI в зону перекупленности (для сделок на покупку) / перепроданности (для сделок на продажу) Выход индикатора RSI из зоны перекупленности (для сделок на продажу) / перепроданности (для сделок на покупку) Касание предельного уровня пе
FREE

Moving Average Dashboard Bars ago - это уникальная мультивалютная, мультитаймфреймовая панель. Эта панель очень проста. Выбираете две скользящие средние, инструменты и таймфреймы После этого, панель Moving Average Dashboard Bars показывает сколько баров назад скользящие средние совершили бычье или медвежье пересечение. Он также в реальном времени показывает наличие бычьего или медвежьего пересечения. Индикатор рисуется в подокне. Панель Moving Average Dashboard Bars ago может быть полезна при то
FREE
Highly configurable Rate of Change (ROC) indicator. Features: Highly customizable alert functions (at levels, crosses, direction changes via email, push, sound, popup) Multi timeframe ability Color customization (at levels, crosses, direction changes) Linear interpolation and histogram mode options Works on strategy tester in multi timeframe mode (at weekend without ticks also) Adjustable Levels Parameters:
ROC Timeframe: You can set the current or a higher timeframes for ROC. ROC Bar Shift:
FREE

Introducing the Pivot Point Selector Indicator: Your Ultimate Tool for Custom Pivot Levels Are you ready to take your trading to the next level? Say hello to the Pivot Point Selector Indicator, a game-changing tool that puts you in control of your pivot levels. This innovative indicator empowers you to choose three specific points that will determine the pivot level calculations, giving you unparalleled customization and precision in your trading strategy. Key Features and Benefits: Custom Pivo
FREE

Индикатор вычисляет нарастающий итог от линейно взвешенных результатов виртуальных торгов. Это преобразует котировки в интегрированный, разностно-стационарный ряд с легко различимыми зонами покупок и продаж. Зоны покупок - синие, зоны продаж - красные. Параметры: period - количество баров для расчета линейно-взвешенной суммы; по-умолчанию - 96; smoothing - период EMA-сглаживания; по-умолчанию - 5; mode - целое число, определяющее режим расчетов: 0 - долгосрочная торговля; 1 - среднесрочная торго
FREE
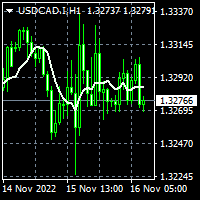
To download MT5 version please click here . Metatrader users are limited to few moving average types. Therefor I decided to create a package consisting of all MAs I knew. This package suggests 12 different types: { SMA, EMA, DEMA, TEMA, WMA, VWMA, SMMA(RMA), HullMA, LSMA, ALMA, SSMA, TMA } You can configure them via input tab. This is a non-repaint indicator with light load. To implement them I referred to standard libraries of pine script.
FREE

Индикатор предназначен для определения уровня пивота группы свечей и направление тренда. не перерисовывается расчет на активной свече если свечи вверху основной линии, тренд вверх если свечи внизу основной линии, тренд вниз пробитие основной линии сигнализирует о смене тренда или отскоке цены два режима отображения, обычный и с ускорением (ModeLite) присутствует вспомогательная линия-отображающая линию сопротивления
Настройки BarsHistory - сколько баров использовать для показа индикатора. Mod
FREE
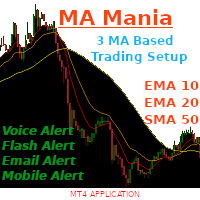
The Indicator includes three of the most prominent moving averages indicators. These are : Ten Period Exponential Moving Average Twenty Period Exponential Moving Average Fifty Period Simple Moving Average This is one of my favourite trend follow setup that is solely based on these three moving averages. The indicator has the following abilities: It can notify you through voice alerts when price touches any of the moving averages . For example if price touches Fifty Period Simple Moving Average t
FREE

A flexible 2-Line MACD indicator The default MACD indicator inside MT4, limits you to using the MACD with a fast-EMA, slow-EMA, and signal-SMA. This MACD indicator allows you to set your own MA-Method choices for these 3 components, separately! You can select from SMA-EMA-SMMA-LWMA, and can even use a separate method for each 3 fast-slow-signal periods. A more featured version is available with colored candles+conditions, full alerts+conditions, line coloring, DEMA and TEMA options; MACD MAX
FREE

The product Divergence Cci Force Stddev Ac Atr is designed to find the differences between indicators and price. It allows you to open orders or set trends using these differences. The indicator has 4 different divergence features.
Divergence types Class A Divergence Class B Divergence Class C Divergence Hidden Divergence
Product Features and Rec ommendations There are 5 indicators on the indicator Indicators = CCI, Force, Stdandard Deviation, Acelereator, Atr 4 different divergence ty
FREE

The ' Average OHLC ZigZag ' indicator was designed for entry confirmations as well as scalping with a larger trend. A custom formula to average the last two bars to generate arrows following market trends with bar 1 confirmation.
Key Features An extreme scalper calculating the averages between the last two market periods to generate a buy or sell arrow. No settings are available due to it's simplicity of custom price action pattern and using repainting four OHLC prices.
Input Parameters Zig
FREE

Индикатор Laguerre VIX Trend Extrema (LVTE) находит вершины и впадины рынка. Как следует из названия, LVTE - это процентный ценовой осциллятор, который распознает крайние диапазоны рыночной цены. Согласно описанию в книге Джона Элерса "Кибернетический анализ фондового и фьючерсного рынков," внедрение уравнение Лагерра может способствовать более продвинутому распознаванию трендов и более сглаженным фильтрам, требуя при этом меньше данных. Здесь используется несколько вариантов уравнения Лагерра д

Sends price alerts conveniently to your Android/IOS device. Make sure push notifications are enabled in Metatrader settings and the PC/VPS is online 24/7. Price levels are updated automatically, but you can modify them in global variables, if needed. Suitable for any market instrument, but if notifications are too frequent, increase point value of the indicator parameter.
FREE
Простой, но полезный индикатор для контроля волатильности при внутридневной торговле. Индикатор наносит на текущий график уровни средней волатильности (ATR) за указанное количество дней. На текущем торговом дне уровни динамические и перемещаются в зависимости от минимума и максимума цены текущего дня в режиме "реального времени". Во входных параметрах мы задаем: - количество дней для расчета и отрисовки уровней среднего АТР - цвет линий уровней среднего АТР - толщину линий уровней среднего АТР
FREE

Moving Average Convergence Divergence (MACD) Signal Input parameters: signal mode: set it to true if you want to plug it into STAT (Signal Tester and Trader) arrow shift: distance between fast EMA line to arrow on chart standard entry mode for MACD fast EMA period slow EMA period MACD period MACD price method Standard Entry mode: buy when slow EMA cross and close above fast EMA while above the 0 line sell when fast EMA cross and close above slow EMA while below 0 line You can find the best set
FREE

Индикатор Fractals ST Patterns является модификацией индикатора Fractals Билла Вильямса и позволяет задавать любое количество баров для нахождения фрактала. Этот простой индикатор соответствует параметрам ST Patterns Strategy ( https://stpatterns.com/ ) . Structural Target Patterns по своей сути и есть сам рынок, последовательно разделенный на составляющие. Для формирования ST Patterns не нужны линии тренда, геометрические пропорции самой модели, объем торгов или открытый рыночный интерес. Они л
FREE

Описание индикатора Наверное, почти каждый трейдер хоть раз, но мечтал про незапаздывающие МА. Я воплотил эту мечту в своем индикаторе. При помощи этого индикатора можно прогнозировать будущие значения МА! Индикатор можно использовать четырьмя разными способами: Первый - это непосредственно прогноз на желаемое количество баров. Таким образом, вы можете оценить примерное поведение цены в будущем. Второй - создание незапаздывающих "средних". Это можно реализовать, сдвинув МА назад на половину пери
FREE

Smart Reversal Signal - это профессиональный индикатор для платформы MT4, разработанный группой профессиональных трейдеров.
Этот индикатор подойдет для работы на Forex и на бинарных опционах.
Приобретая данный индикатор вы получаете: Отличные сигналы индикатора. Бесплатную поддержку по продукту. Регулярные обновления. Возможность получать сигналы различными способами: алерт, на телефон, по почте. Можно использовать на любом финансовом инструменте(Forex, CFD, опционы) и периоде.
Параметры

Instant Trend Line this indicator has been designed for multi time frame
Buy Call: When the Blue Moving average (MA) line crossed above the Red Moving average (MA) . Sell Call: When the Blue Moving average (MA) line crossed below the Red Moving average (MA) .
Happy and profitable trade for ever!!! this indicator is suitable for all time frame, but our recommended time frame is above 15 min chart. Suitable to all the forex chart
FREE
This Dashboard is free to download but is dependent on you owning the Flag Trend Pro MT4 indicator. Down load the indicator: Flag Trend Pro
The Dashboard will show you on a single chart all the timeframes (M1 to Monthly) with their own status for the indicator: Gold Pro MT4
all time frame and all symbol: smart algorithm detects the trend, filters out market noise and gives entry signals!!!
How to understand the status: symbol - Fill All the Pair what you want. M1, M5, M1
FREE

PLEASE HELP REVIEW/ SUPPORT/ SHARE THIS OTHER INDICATOR HERE https://www.mql5.com/en/market/product/51637 AS YOU DOWNLOAD THIS ONE FOR FREE. THANKS.
This Indicator is based on four moving averages and the PIVOT points. The indicator provides clarity to trading, especially in ranging markets when price is very slow and tight. You can trade intensively daily, every day with this indicator. You may decide to trade with this indicator alone and get the maximum out of the market. The indicator w
FREE

Индикатор показывает объем каждого бара в пунктах в виде гистограммы. Вторая версия индикатора. Теперь в виде осциллятора. Более информативный и функциональный. При этом не загружает основной график. Вы можете изучить код или самостоятельно модернизировать индикатор: Исходник на GitHub Показывает: объем бара в пунктах в виде гистограммы (буфер 0) среднее значение объема за весь период (буфер 1) другим цветом бары, которые выше клиентского среднего значения (буфер 2) среднее значение за количеств
FREE

TREND MATE is an useful indicator that will support your decision to trade according to the current trend. It is possible to configure alert and push notification to receive when entering to first candle for bull / bear trend. If you want to use this indicator for a EA, use the function iCustom as follows:
DOWNTREND : iCustom(NULL,0,"Trend_Mate",0,0) . If downtrend result is "1", otherwise is "0".
UPTREND : iCustom(NULL,0,"Trend_Mate",1,0) . If uptrend result is "1", otherwise is "0".
Fo
FREE

Economic Calendar Viewer
This economic events reader is adapted to load data from a csv file. You can prepare the csv file yourself according to this template, you can do it in notepad or csved. The file should normally be named Calendar-MM-DD-YYYY.csv. And contain lines with data column headers according to this example. In the Impact column, i.e. impact on the market depending on the importance of the event, the names accepted from the least important are: None, Low, Medium, High. In column
FREE
The LWO is a tool that effectively indicates the end of trends. Being an oscillator, it has values between 0 and 100, defining the areas of hyper-sold and those of hyper-bought. Its effectiveness is due to the weighing of prices at the end of individual periods on a logarithmic scale; this allows you to have a perception of the will of the market.
The parameters
The indicator has only 2 settable values, period and smooth factor.
The period indicates how many bars the weighing is performed,
FREE

It is a very simple and useful micro indicator. Shows the current ask price, and the maximum relative ask price up to the current moment, on the chart, in the first N candles. It facilitates quick decision making by offering a visual reference. Likewise, when we position ourselves with the cursor over it, it shows us the maximum spread since the indicator is applied, until the current moment. It is perfect for scalping . By default, the parameter N has the value 4.
Especially recommended ind
FREE

Bigger chart labels would allow the user to be entirely aware of which chart he/she is on. Each chart window is unique, containing different patterns and economic motives so acknowledging the chart window would be absolutely essential! There are well known Economic Time Zones included in clear view, by choice! Simple does it! Use your computing mouse scroller, clicking with the right finger on the label, in order to customize the label properties. From there, choose your preferred color,
FREE

This is an indicator based on a standard ZigZag . The indicator puts points on the chart where the ZigZag has drawn another top or bottom. Everyone knows that the ZigZag indicator redraws its values. The Pointer View marks these values. The indicator gives an alert when a new point appears. Parameter Applied Price - expands the possibilities of building the indicator. It is possible to build at OPEN , CLOSE and standard HIGH/LOW prices. Input parameters
----------- Depth - period of the
FREE

This Dashboard is free to download but is dependent on you owning the Advanced Trend Breaker . Get the indicator here: https://www.mql5.com/en/market/product/66335
The Dashboard will show you on a single chart all the timeframes (M1 to Monthly) with their own status for the indicator: Advanced Trend Breaker
all time frame and all symbol: smart algorithm detects the trend,Support and resistance, filters out market noise and find breaker of entry signals!!!
!!!
How t
FREE

Потому что стиль имеет значение
Я знаю, как надоедает каждый раз нажимать свойства, чтобы изменить цвет свечи, фон на светлый или темный, поставить или убрать сетку. Вот решение, которое можно найти одним щелчком мыши: Три настраиваемые кнопки для выбора нужного трейдерам стиля свечи. Одна кнопка для переключения между дневным и ночным режимом. Одна кнопка, чтобы показать или скрыть сетку на графиках. *****В настройках вы можете выбрать, где кнопки должны отображаться на экране*****. Пож
FREE

Индикатор Multiple RSI работает на основе стандартного индикатора RSI. Этот индикатор отобразит индикатор RSI с разных таймфреймов на одном экране. Вы сможете следить за значениями индикатора RSI со всех таймфреймов на одном экране. Этот индикатор освобождает вас от необходимости постоянно переключать графики. В то же время вы сможете отслеживать состояние других графиков относительно друг друга.
Особенности И1ндикатор показывает график RSI таймфрейма, на котором вы работаете, а также графики
FREE

The " Multi Kernel Regression " is a versatile trading indicator that provides graphical interpretations of market trends by using different kernel regression methods. It's beneficial because it smoothes out price data, creating a clearer picture of price movements, and can be tailored according to the user's preference with various options.
What makes this indicator uniquely versatile is the 'Kernel Select' feature, which allows you to choose from a variety of regression kernel types, such
FREE

TrendFinder VolumeI are Colored candlesticks showing the trend based on Volume and Slope of Trend
This indicator will give you the color change on the next bar on the confirmation candle and will never repaint Lime Green = Possible Buy (Volume up), Teal Green = Bullish Weak (Volume Decreasing), Red = Possible Sell (Volume up) , Orange = Bearish Weak (Volume Decreasing)
TrendFinder Volume is optimize to trade on any market and to be used trending and None trending markets. For best results us
FREE

Индикатор SFT Fibo Smart Pivot - это мощное торговое средство, основанное на золотом сечении Фибоначчи, которое помогает определить ключевые уровни поддержки и сопротивления на рынке. Этот индикатор обладает способностью выявлять важные ценовые уровни, которые могут стать точками входа и выхода из сделок. Он позволяет трейдерам более эффективно анализировать рынок и принимать более обоснованные решения. Вычисляет несколько уровней поддержки и сопротивления, что позволяет трейдерам видеть целый с
FREE

Support and Resistance Levels Arrow Indicator please leave 5 stars to me A support level is a level where the price tends to find support as it falls. This means that the price is more likely to "bounce" off this level rather than break through it. However, once the price has breached this level, by an amount exceeding some noise, it is likely to continue falling until meeting another support level. A resistance level is the opposite of a support level. It is where the price tends to find re
FREE

The Chart Analyzer is an MT4 indicator that provides visual arrow signals without redrawing them. In addition, we have included trendlines to validate your entries. This indicator has been fine-tuned to work with all timeframes and instruments.
The Chart Analyzer has a number of advantages
Does not fade or remove arrows when drawn Sends both email and phone alerts. It is light on computer resources Easy to install. Default setting works just fine. If price opens above the trendline, open

После 7 лет я решил выпустить некоторые свои индикаторы и советники бесплатно.
Если вы находите их полезными, пожалуйста, поддержите меня пятизвёздочным рейтингом! Ваш отзыв помогает продолжать выпуск бесплатных инструментов! Также смотрите мои другие бесплатные инструменты здесь
_________________________________ Индекс Интенсивности Внутридневной Торговли (III) для Точного Анализа Форекса Индекс Интенсивности Внутридневной Торговли, тщательно разработанный в MQL4, - это передо
FREE

Индикатор для обнаружения ценового канала, точек разворота и направления тренда. Работает на всех таймфреймах. Не перерисовывается. Стенки каналов являются линиями поддержки и сопротивления. Расчет на активной свече. Если красная линия выше зеленой, тренд вверх. Если красная линия ниже зеленой, тренд вниз. После пробития ценой зеленой линии индикатор начинает строить новый канал. Отлично работает вместе с шаблоном Forex_Fraus_M15.tpl https://www.mql5.com/ru/blogs/post/703667 Особенности: Настро
FREE

"Trend Guide" - это индикатор, показывающий направление тренда, основанный на быстрой и медленной скользящей средней. Все просто и главное удобно. Параметры индикатора : "_Fast_Moving_Average_Period" - Период быстрой скользящей средней; "_ Slow_Moving_Average_Period" - Период медленной скользящей средней ; "_ MA_SHIFT " - Сдвиг скользящей средней; "_ MA_METHOD " - Метод усреднения; "_ APPLIED_PRICE " - Тип расчета цен; "_ Line_width " - Ш
FREE

"Make it Horizontal" превращает линии тренда в горизонтальные - для этого необходимо выбрать линию и нажать клавишу H. Этот инструмент необходимо запускать на графике как индикатор. Не имеет входных параметров, перетащите на график и всё! Я создал этот инструмент, потому что в MT4 нет похожих инструментов. Сколько раз вы рисовали линию, а затем нужно было дважды кликнуть по ней, чтобы настроить начальный и конечный уровень цен для того, чтобы сделать ее горизонтальной? Это больше не проблема! Ск
Highly configurable Osma indicator.
Features: Highly customizable alert functions (at levels, crosses, direction changes via email, push, sound, popup) Multi timeframe ability Color customization (at levels, crosses, direction changes) Linear interpolation and histogram mode options Works on strategy tester in multi timeframe mode (at weekend without ticks also) Adjustable Levels Parameters:
Osma Timeframe: You can set the lower/higher timeframes for Osma. Osma Bar Shift: Y ou can set
FREE

Алгоритм этого индикатора построен на базе высокоэффективного цифрового фильтра. Уникальный алгоритм цифровой фильтрации позволяет получать своевременные торговые сигналы, а также дает возможность объективной оценки текущей ситуации при проведении технического анализа. Индикатор одинаково хорошо может использоваться как на младших периодах, так и на старших. В отличии от обычных классических индикаторов метод цифровой фильтрации позволяет значительно уменьшить фазовое запаздывание, что в свою оч

Индикатор VictoryCPM (Currency Power Meter) подскажет силу валютных пар. Индикатор создан для тех трейдеров, которые предпочитают вести торги сразу на нескольких валютных парах. Данный инструмент в состоянии выводить на торговый график данные о текущей силе различных валют. Валютный рынок обладает динамической структурой, из-за чего различные валюты оказывают влияние друг на друга. По этой причине для выявления оптимальной точки для создания ордера необходимо ознакомиться с ситуацией как на теку

Данный индикатор был создан на основе оригинальных индикаторов поиска экстремумов,
а в качестве фильтров испольуются доработанные RSI.
Сигналы не перерисовываются ни при каких обстоятельствах, так что рекомендую проанализировать
историю и выбрать для себя свою стратегию торговли.
Рекомендуемые ТФ - 5 и 15 минут, экспирация до конца свечи.
Показывает хорошие результаты при мартине на следующую свечу или сигнал.
Не рекомендую торговать в новости и в начале торговых сессий, а так же избегай

Trend Code (v2.0) Trend Code is a very simple and yet effective trend indicator to capture trend movement, detect the trend reversal, calculate entry price as well as proper stop loss. Trend Code indicator is made up of a series of block, while bull trend block in bull colour and bear block in bear trend colour. For bull trend block, the TrendOpen is the lower edge, TrendClose is the upper edge, for bear trend block, the other way round. Parameters: TrendOpenAdjustment = 0.8, (range 0~1.0) Tr
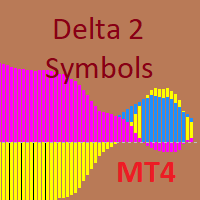
Индикатор предназначен для парной торговли 2-мя инструментами с высокой корреляцией. Графики индикатора могут отображаться линиями или гистограммами. Есть режим МТФ, отображаются максимальные и минимальные дельты за рассчитанное количество баров с проверкой на заданное минимальное значение. Есть возможность включить расчет торговых операций с проверкой текущего коэффициента корреляции на минимальный заданный, текущей дельты в пунктах или процентах от максимальной (минимальной) дельты и расчето

Индикатор изменяет текущий таймфрейм графика в зависимости от просадки в валюте депозита, от количества ордеров или процента от депозита. Вы можете задать просадку в валюте депозита, количестве ордеров одного направления или проценте от депозита, при которых текущий таймфрейм изменится на выбранный. Это значительно сокращает просадку при работе советников использующих сети ордеров.
Параметры индикатора:
Просадка в валюте, ордерах или процент от депозита
Основной таймфрейм
Первый уровень

Graphic Shapes -используя историю,проецирует в текущий момент четыре вида графических фигур, позволяющих определить основные диапазоны движения цены в будущем,а так же даёт понимание основных разворотов рынка ,при этом давая точки входа по приоритету!В панели расположены три вида величины фигур выраженные таймфреймами. Позволяют проводить полный анализ рынка,не используя дополнительные инструменты! Индикатор является мощным инструментом прогноза движения цены на рынке форекс!

"AV Stop Hunter" is an indicator for MetaTrader 4, which draws entry arrows for long and short after so-called Stop Hunt candles and has several notifications about them. Since this is a smart money concept , the periods H1 and H4 are the best. Increasing volume improves the signal, lines and arrows are then thicker. The MQL5 variant has colored stop-hunting candles.
Definition :
Stop hunting, also known as stop running, is the practice of institutional traders (smart money) of driving t
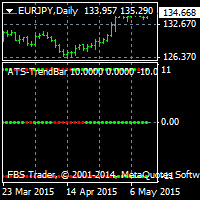
Индикатор ищет наиболее сильный тренд и работает на любом таймфрейме. Рекомендуется использовать на D1. Продукт отображает три линии, показывающие быстрые, средние и медленные бары. Если на каждой из трех линий одновременно появляются красные бары, на рынке наблюдается сильный медвежий тренд.
Если на каждой из трех линий одновременно появляются зеленые бары, на рынке наблюдается сильный бычий тренд. Индикатор не перерисовывается и может быть использован с другими индикаторами. Продукт также под
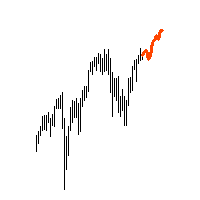
"AV Forecast" is a preview or forecast indicator for MetaTrader 4, which draws forecast future price changes on the chart from historical data. To do this, it primarily uses the everyday rhythm and the seasonality of the year. For timeframes below H1 closer dates can be selected. The lines for calculation can be made visible.
Settings:
- Draw line for x candles: draw x candles in the future
- Show all lines: yes/no
- Look back years or mixed (> H1 same): one year back or less beneath H

This system is currently set for a multi time period. Examines the candles with a formula. The right time also notifies you. You can gain earnings using this system. Re-painting, feature is not available. Several indicator data, channel width and candlestick shadows are calculated. You can adjust the settings according to different time periods by trying the settings. The green line is the "take profit" level.

This indicator guides you like a hunter. Tacheprofit and StopLoss levels. See the difference in the experiment. Works in all periods. Works at all rates. You can win with this system. The crossing of the mean and the re-test were done according to the rule. You can see the transactions by moving backwards on the strategy test screen. The whole system is automatically calculated.

This indicator is just a simple ATR indicator. It calculates the Average True Range and let you tell it to show the percentage of the ATR. You will then see the % of the ATR on the screen. I like to use it to calculate different things for my trading. If I use the really great AW Recovery System ( https://www.mql5.com/en/market/product/28868 ) there is a great strategy made by the developer, where you watch the daily ATR and set the steps calculated on part of the ATR. So if you put the Part of
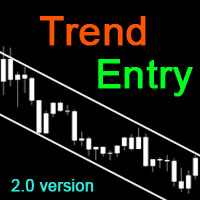
----< High Accuracy Entry Signals and Trend Indicator >----
TrendEntry could tell you the trend direction, resistance and support, when to open orders and where to set stoploss & takeprofit. this is a multifunctional indicator, can work well on all symbols and timeframes.
Features:
real-time analysis of trend direction filter out all the minor waves show resistance and support along as price goes give highly accurate entry signals frequently send alert in popup, email, notification way a

US30 Ninja is a 5 minute scalping indicator that will let know you when there is a trade set up (buy or sell). Once the indicator gives the trade direction, you can open a trade and use a 30 pip stop loss and a 30 pip to 50 pip take profit. Please trade at own own risk. This indicator has been created solely for the US30 market and may not yield positive results on any other pair.
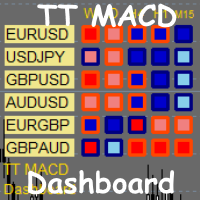
TT MACD Dashboard is multi-time frame and multi-currency market scanner. It is telling you the value of MACD and MACD histogram (a difference between MACD line and Signal line) in a form of small rectangle. If MACD value is above zero (MACD is bullish). Rectangle border color is bullish (Navy by default). If MACD value is below zero (MACD is bearish). Rectangle border color is bearish (OrangeRed by default). If MACD histogram is rising and above zero (Bullish histogram). Rectangle color is bull
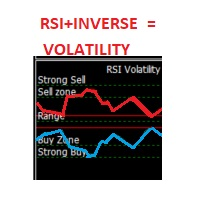
This indicator is an oscillator that shows the RSI (Relative Strength Index) in red and its inverse graph in a light green. Together this shows the volatility of the market (in its default setting). You can also change it to show only the RSI graph. It also gives you the possibility to change its Period. The oscillators zones (80,70,50,30,20) are marked by Strong Sell, Sell Zone, Range, Buy Zone, and Strong Buy respectively.
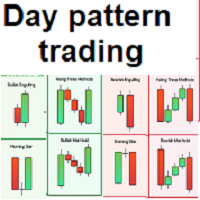
Simple and effective indicator based on some candle patterns recognition Arrows appear on candles when bear signal / bull signal based on candle pattern recognition -----> TWO strategies available you can enable / disable one of them Indicator can work on any chart and time frame I prefer to work on high time frames especially the Daily charts D1 and H4 Red arrows appears above candle showing a bear signal after candle completed - arrow will be blue during candle formation Green arrows appears b
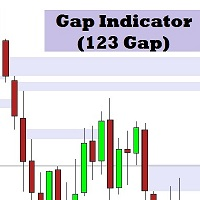
This indicator identifies the gap between the first and third candles in 3 consecutive candles. This area can be used to identify strong areas that the price may return to after a reversal or pullback.
The indicator has 4 user defined settings: 1. Display Distance: This is how many previous candles the indicator will use to identify gaps.
2. BearBarColor: This is the color that will be used for gaps created during a downtrend.
3. BullBarColor: This is the color that will be used for gaps cre

Are you tired of the uncertainty that arises when your orders fail to stop at a specific line due to the spread? Look no further! Introducing our indicator that plots candlesticks based on the Ask price instead of the traditional bid-based chart commonly used in MQL4. With this indicator, you can say goodbye to the frustrations caused by the bid-based chart, as it provides you with a more accurate representation of market movements. By utilizing the Ask price, which represents the price at whic
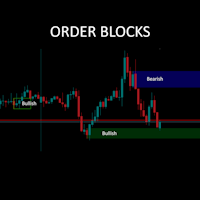
You have been waiting for it I know!! AVAILABLE NOW!! After more than 11000 MT5 downloads, hope it helps you as much as it does me. We added a candle timer and more prominent symbol info display as a bonus as well! This is a straight forward keep is simple style Order Block finder. No fancy algorithms but tends to be quite accurate for some symbols to predict bounce, return-to and break-through channels. It is a retrospective indicator (as they all are) and there to help you with better guesses

This indicator filters the Zigzag indicator to calculate the main support and resistance
levels.
Variables
minimum gap between peaks : is the distance (GAP) between the peaks of
the Zigzag
peaks sensitivity : Minimum number of nearby peaks
look back: it means that it has to test the last 50 peaks in the Zigzag
object name perfix: a prefix for level’s line name on chart
FREE
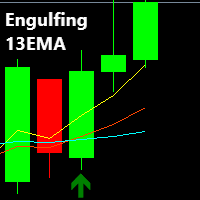
Description:
The Engulfing 13EMA is a Multi Timeframe Indicator that scans Multiple Symbols which will help you to identify potential trade set ups. As well as Forex, it can scan Crypto, Exotics, Metals, Indices, Energies or what ever else you have in your Market Watch list. You also have the option to enable/disable the time frames you want to scan. (M1,M5,M15,M30,H1,H4,D1,W1,MN1) All of these options are made possible from just ONE chart, from which the Indicator is attached
An alert is
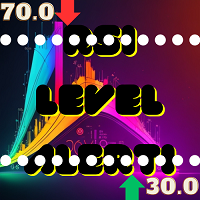
Simple alert system which will alert you on your mobile terminal, email and on the chart whenever RSI crosses below the overbought level or above the oversold level. Use this alert system, so you don’t have to watch the chart all day for the RSI levels to break.
INPUTS: 1. RSI Period- (Default is 14). Number of candles the RSI indicator will look back for the calculations. 2. OB Level- (Default is 70). This is the Overbought level or Upper level for the RSI indicator. 3. O
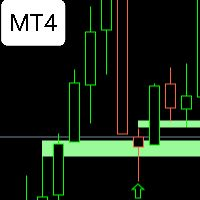
FVG WATCHER is an indicator that helps traders identify fair value gaps in the market. The indicator draws fair value gaps and alerts the user when the fair value gap has been swept. It allows users to specify how it should be swept, what time range to alert, and the size of the fair value gap to alert. It also allows the user to apply a moving average trend filter for better choice of alerts. The indicator also allows push mobile notifications. What makes FVG Watcher special is that it can be
This is a SnR tool.
It is built based on the body candle.
It is a multi timeframe indicator.
There is a powerful scalabar for vertical line slides to limit the candle bars.
Color for each line can also be changed.
It can detect:
1. Support && Resistance
2. Support become Resistance && vice versa
3.Support become Resistance become Support && vice versa
It also can be used for trading tools and studies on SnR *New Version avaiable

In the ever-evolving world of Forex trading, understanding the different trading sessions is paramount to making informed trading decisions. Each trading session brings its own unique characteristics, opportunities, and challenges, and recognizing these can greatly enhance your trading strategies. Whether you're a novice or a seasoned trader, the Forex market's three main trading sessions – Asian, London, and New York – are crucial milestones that dictate market behavior and potential trade set
Узнайте, как легко и просто купить торгового робота в MetaTrader AppStore - магазине приложений для платформы MetaTrader.
Платежная система MQL5.community позволяет проводить оплату с помощью PayPal, банковских карт и популярных платежных систем. Кроме того, настоятельно рекомендуем протестировать торгового робота перед покупкой, чтобы получить более полное представление о нем.
Вы упускаете торговые возможности:
- Бесплатные приложения для трейдинга
- 8 000+ сигналов для копирования
- Экономические новости для анализа финансовых рынков
Регистрация
Вход
Если у вас нет учетной записи, зарегистрируйтесь
Для авторизации и пользования сайтом MQL5.com необходимо разрешить использование файлов Сookie.
Пожалуйста, включите в вашем браузере данную настройку, иначе вы не сможете авторизоваться.