Смотри обучающее видео по маркету на YouTube
Как купить торгового робота или индикатор
Запусти робота на
виртуальном хостинге
виртуальном хостинге
Протестируй индикатор/робота перед покупкой
Хочешь зарабатывать в Маркете?
Как подать продукт, чтобы его покупали
Технические индикаторы для MetaTrader 4 - 21

Всем привет. Предлагаю на обозрения очень достойный индикатор входы очень четкие можно по мартину отрабатывать 30 мин до и после новостей не торгуем можно накинуть индикатор новостей больше вам не чего не надо есть сигнал стрелка за крепилась на следующую входим Экспирация любая валюта тоже любая. осцилляторы и авторский алгоритм.И еще можно через бот авто торговля на скрине.И еще друзья после приобретения или аренды пишем мне свои контакты я вам помогу все настроить что бы работало на авто то
FREE

Motivated from: A market is the story of cycles and of the human behavior that is responsible for overreactions in both directions. - Seth Klarman
NeuroWave Scalper PRO is a advanced powerful cycle algorithm which depicts the cycles of market in a effective manner.This Indicator works in trending as well as ranging market conditions. This indicator is perfect for scalp trades as well as swing trades. NeuroWave Scalper PRO is not just an indicator, but a trading strategy itself. It doesn

Индикатор отображает гармонические модели на графике, основанном на Динамическом ЗигЗаге ( https://www.mql5.com/ru/market/product/5356 ), и представляет собой практически полный аналог одной из версий известного многим korHarmonics. Индикатор распознает следующие фигуры и их разновидности: ABCD, Gartley (Butterfly, Crab, Bat), 3Drives, 5-0, Batman, SHS, One2One, Camel, Triangles, WXY, Fibo, Vibrations. По умолчанию в настройках включено отображение только фигур ABCD и Gartley. Линия реверса помо

The indicator displays two Moving Average lines on the chart with parameters specified in the settings. It issues a signal in the form of arrows and a sound at the intersection of these Moving Average. In the indicator settings, you can set the period of fast Moving Average ( Fast MA Period ) and slow Moving Average ( Slow MA Period ). And also Shift, Applied Price, Method and Timeframe for two Moving Averages separately. Important:
The main difference from oth
FREE

This indicator shows us the trend or direction of the market and a possible stop loss
This indicator works with two parameters, period and multiplier. Buy and sell signals are generated when the indicator crosses the closing price and it changes color.
This indicator is used in all types of markets such as stocks, futures, forex, cryptos, additionally it can be used in different time periods: hours, daily, weekly, etc.
It is recommended not to use it while the market is sideways, this can
FREE

Trend Trading - это индикатор, предназначенный для получения максимальной прибыли от трендов, происходящих на рынке, путем определения времени отката и прорыва. Он находит торговые возможности, анализируя, что делает цена во время установленных тенденций. [ Руководство по установке | Руководство по обновлению | Устранение неполадок | FAQ | Все продукты ]
Торгуйте на финансовых рынках с уверенностью и эффективностью Прибыль от устоявшихся тенденций без проволочек Признать прибыльные откаты,

BolingCustom is a Trend indicator designed for all Time frames and all currency pairs. For a better experience, it is recommended to use in time frames above 15 minutes.
Due to its understandable and simple presentation on the chart, even beginners can easily learn how to use it.
If you have any problems or questions, let us know. We will be happy to contact you: Direct massage
How this indicator works is that it shows the trend using a combination of several indicators such as the Bo
FREE

Индикатор Sonar Mechanic. Свяжитесь со мной после покупки для получения индикатора баланса сил SonarHistogram бесплатно! Индикатор Sonar Mechanic - действительно рабочий индикатор, потому что работает одновременно по трем авторским алгоритмам, которые правильно определяют трендовые и контртрендовые сигналы для входа в рынок. Индикатор работает на всех активах и таймфреймах. Руководство по индикатору здесь: https://www.mql5.com/en/blogs/post/750128
На золоте и на валютных парах хорошие си
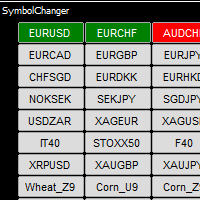
Symbol Chart Changer is an indicator/utility that offers you the option to switch between symbols and timeframes. You can choose any symbol and timeframe on the same chart with just a few clicks. In addition, this indicator also shows the profit of the symbol through the color of the buttons. For MT5: Symbol Chart Changer for MT5 Features
All symbols selected in MarketWatch, that allow you to monitor your favorite instruments on the same chart. Works smoothly on any symbol/instrument, accou
FREE

Выделяет торговые сессии на графике Демо-версия работает только на графике AUDNZD !!! Полная версия продукта доступна по адресу: (*** будет добавлено ***) Trading Sessions Indicator (Индикатор торговых сессий) отображает начала и окончания четырех торговых сессий: тихоокеанской, азиатской, европейской и американской. возможностью пользовательской настройки начала/окончания сессий; возможность отображения только выбранных сессий; работает на M1-H2 таймфреймах;
В индикаторе можно настроить следу
FREE

Индикатор вычисляет и рисует линии на графике. Два типа тренда: Тренд A: линия отрисовывается по локальным минимумам для восходящих трендов и по локальным максимумам - для нисходящих. Тренд Б: линия отрисовывается по локальным максимумам для восходящих трендов и по локальным минимумам — для нисходящих. Нужно, чтобы ситуация полностью удовлетворяла нескольким условиям, которые можно настроить во входных параметрах (см. также рис. 4): MinBarAge : количество баров до последней базовой точки линии н
FREE

please leave 5 stars to me A support level is a level where the price tends to find support as it falls. This means that the price is more likely to "bounce" off this level rather than break through it. However, once the price has breached this level, by an amount exceeding some noise, it is likely to continue falling until meeting another support level. A resistance level is the opposite of a support level. It is where the price tends to find resistance as it rises. Again, this means t
FREE
How To Trade
Execute your trades in 3 Easy Steps!
Step 1: Trade Setup Entry Buy in Signal Arrow color DodgerBlue. Entry Sell in Signal Arrow color RED. Success Rate ≥ 75% 100:25 Step 2: Set Stop Loss Stop loss BUY ----> You can set stop loss on Line RECTANGEL color DodgerBlue. Stop loss SELL ----> You can set stop loss on Line RECTANGEL color RED. Step 3: Set Take Profit Take profit BUY on RECTANGEL color RED. Take profit SELL on RECTANGEL color DodgerBlue. Strategy SIMPLE Day trading / Swi
FREE

Fibonacci SR Indicator Индикатор рисует линии поддержки и сопротивления. Продукт основан на уровнях коррекции и расширения Фибоначчи (Fibonacci Retracement and Extension levels). Индикатор учитывает многочисленные комбинации уровней Фибоначчи и рисует линии поддержки/сопротивления. При этом в расчетах используются значения вершин и оснований, построенных индикатором ZigZag. При необходимости ZigZag также может быть отображен на графике. Индикатор учитывает многочисленные комбинации предыдущих то
FREE

This indicator mostly inspired from BW-ZoneTrade custom indicator from MT5. How To Use:
BUY when both dots colored Green. SELL when both dots colored Red. In addition to original one, MACD-OsMA-generated signal also can be drawn. Input Description:
MA_period_short: Faster EMA period for MACD. Applied when drawMACD is true. MA_period_long: Slower EMA period for MACD. Applied when drawMACD is true. MACDperiod: MA period for MACD. Applied when drawMACD is true. drawMACD: When true, draw an addi
FREE

Note : New in 1.6: the indicator now exports the trade signal (but not displayed). Go long with light blue. Go short with red. Exit otherwise. Signal to be imported to your EA using iCustom. This indicator provides Best of the Best linear filter momentum oscillators that I am aware of (Low Pass Differentiators, LPD's) . All of them are recent developments by this developer, or other researchers. The oscillator line is the first buffer of the indicator, and can be called in other indicators or
FREE

Этот индикатор служит для визуального представления Дончианского канала на вашем торговом графике. Дончианский канал - это простой технический инструмент, используемый для изображения диапазона между самыми высокими и самыми низкими значениями за определенный период. Этот индикатор улучшает визуальный анализ движения цен, предоставляя понимание потенциальных точек прорыва и продолжения тренда. Дончианский канал может быть применен как к текущему временному интервалу, так и к более высокому, если
FREE

Для данного индикатора разработан новый алгоритм определения тренда. Алгоритм с приемлимой точностью генерирует входные сигналы и уровни выхода. Стратегия для торговли по тренду, фильтрация и все необходимые функции, встроенные в один инструмент! Принцип работы индикатора заключается в том, чтобы при размещении на график автоматически определять текущее состояние рынка, анализировать исторические данные, на основании исторических данных и выводить на экран трейдеру указания к дальнейшим действия

Рынок несправедлив, хотя бы потому, что всего лишь 10% игроков управляют 90% капитала. У рядового трейдера мало шансов, чтобы противостоять этим «хищникам». Но выход есть, необходимо всего лишь перейти на другую сторону, необходимо находиться в числе этих 10% «акул», научиться распознавать их намерения и двигаться вместе с ними. Объем - это единственный опережающий фактор, который безупречно работает на любом периоде и любом торговом инструменте. Сначала зарождается и накапливается объем, и толь

If you like this project, leave a 5 star review. Often times we are using brokers that are outside of the GMT-0 timezone, this
not only complicates things, but, it can make seeing when a trading session starts
a bit more difficult than it should. This indicator allows you to set a timezone offset it will draw a vertical line for the: Day. Week. Month. Quarter. year.
FREE

В мире финансов корреляция - это статистическая мера того, как цены двух ценных бумаг движутся по отношению друг к другу. Корреляция применяется в передовых методах управления портфелем ценных бумаг. Индикатор PZ Correlation рассчитывает, как различные ценные бумаги движутся по отношению к выбранной, облегчая управление портфелем. Не совершайте сделок одновременно на нескольких инструментах с высокой степенью корреляции Ищите торговые возможности среди инструментов с высокой степенью корреляции
FREE

Индикатор помогает определить потенциал движения цены внутри дня и на тренде. Для расчётов используется среднее ценовое движение на инструменте. Если у вас проблема выставления TP, индикатор позволяет не завышать ожидания. Для волатильных инструментов также можно учитывать и положение SL. Если вход был в правильном месте соотношения риск/прибыль подскажут выгодный уровень для фиксирования прибыли.
В нижней части экрана присутствует кнопка сброса. Если индикатор потерялся на графике при смене и
FREE

Индикатор индекс относительной силы (RSI - Relative Strength Index) с динамическими уровнями зон перекупленности и перепроданности.
Динамические уровни изменяются и подстраиваются под текущие изменения индикатора и цены, и представляют собой своеобразный канал.
Настройки индикатора period_RSI - Период усреднения для вычисления индекса RSI. applied_RSI - Используемая цена.Может быть любой из ценовых констант: PRICE_CLOSE - Цена закрытия, PRICE_OPEN - Цена открытия, PRICE_HIGH - Максимальная за
FREE
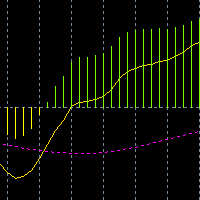
одель MACD, а также добавлены две линии, когда они пересекаются, чтобы получить сигнал покупки или продажи.
желтый сигнал линии в розовой линии сигнала, розовый сигнал вниз, желтый сигнал сверху, что означает больше.
желтый сигнал под линией бледного сигнала, желтый сигнал вниз, розовый сигнал сверху, обозначает пустоту.
линия с нулевыми или выше столбчатыми линиями переводится на светло - зелёные.
под нулевыми линиями столбчатая линия переводится на светло - желтый.
FREE

Fibonacci Retracement object is an object that has been provided by metatrader 4 platform. But Fibonacci Retracement object doesn't automated adjust the chart. You have to put and manage it manually to the chart. Because of that, this indicator was created. If you like using filbonacci retracement indicator, highly recommended to use Automated Fibonacci Retracement Indicator if you want to get better result in here:
https://www.mql5.com/en/market/product/95515
LT Automated Fibonacci Retrace
FREE
if you want more information please pm me
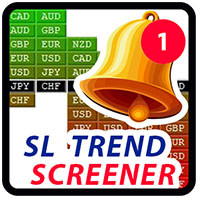
HI guys this my developing indicator 1st version alert logic work well.. this indicator using can you stronger currency and top weaker currency find well,this;s indicator multy MTF time frame strength work.very good for SL trend screener intraday trader and long time trader, very easily can you watch stronger and weaker index.I hope to more improve this future further,thank you

Indicator automatically draw bullish and bearish engulfing without any rules. Bearish and Bullish engulf is well known area for supply and demand area marking. This indicator can be used in any strategy that required supply demand zone. Show Last Engulf : Enable this option to show unfresh engulfing Candle to calculate : set 0 will load all history bar and can use up more memory Bearish Engulfing Colour : Pick any colour that suit Bearish Engulfing Colour : Pick any colour that suit
-Use thi
FREE
Easily track and trade with the trend using this indicator. Uses a circle and line to indicate the trend direction. Excellent for channels. Features alert function.
Parameter TrendPeriod can be changed to your preference. How to use: Simply attach to any chart. Blue circle plus blue line cross below price = Buy. Red circle plus red line cross above price = Sell. Best results when taking higher time frames into consideration before entering a trade. (Hint: Wait for the radar/circle to appear on
FREE
Please feel free to contact me if you need any further information.
Please let me know if you have any questions.
I hope the above is useful to you. MT Magical : is a swing trade and trend and supply&demand strategy through signal filtering with experience. We worked really hard on this project. But it's worth it for investors.
signals uses our secret formula to perform complex calculations to get good results.
TRADE: Forex
TIME FRAME: All Time Frame
SYMBOL PAIR: All Symbol, Rec

Indicador "Trade Zones: Supply and Demand Opportunities" para MetaTrader: Eleva tu Trading con Precisión Estratégica El indicador "Trade Zones: Supply and Demand Opportunities" es una herramienta revolucionaria diseñada para potenciar la toma de decisiones de los traders al identificar claramente las zonas de oportunidad basadas en los principios fundamentales de oferta y demanda. Este indicador, compatible con MetaTrader, proporciona una visión intuitiva de las áreas críticas del mercado donde
FREE
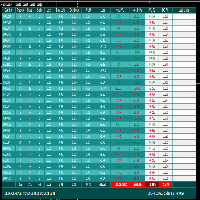
FCK Trade Report This indicator was developed by Fx Candle King. BEFORE CHOOSE CUSTOM PERIOD, GO TO TERMINAL WINDOW (ctrl+T), right click on ACCOUNT HISTORY and CHOOSE ALL HISTORY. This report searches the filtered data in your ACCOUNT CURRENT & HISTORY TRADE, Select your timespan for the report open and closed trades etc... Chose the report type - List only OPEN orders / List only CLOSED orders / List both OPEN and CLOSED orders
FREE
Drawdown Alerts Free ! Meta Trader 4 Indicator. Please leave a review about this product to help other users benefit from it. This Drawdown Alerts indicator shows the drawdown percentage in real time and alerts you when the limit you specify is reached. Calculation of drawdown depends on the amount of the trade balance. You can customize Drawdown Alerts for Corner - Left , Right , Up , Down X Y Color Number of decimal digits Popup messages and sound - Turn on / off notifications Notification
FREE

Please check the " What's new " tab regularly for a complete and up-to-date list of all improvements + parameters. FREE indicator for my trading utility Take a Break . This indicator allows you to manage multiple other EAs with just one Take a Break EA instance. Simply specify the corresponding Chart Group in the indicator(s) and Take a Break EA settings and you are good to go.
Setup example (Indicator + EA)
You want Take a Break to manage 3 other EAs: EA1 on EURUSD, EA2 on EURGBP, EA3 on G
FREE

A simple and highly effective Strength and Weakness currency indicator that can be used to aid your fundamental and technical analysis for winning trade decisions.
The indicator is very easy to use and can be applied to all time frames.
FX Tiger uses an advanced algorithm to calculate a score table for all major currencies. Each major currency will have a score from 7 to -7. A score of 5 and above indicates currency strength and a score of -5 and below indicates currency weakness. Once you
FREE

This indicator allows you to overlay three different moving averages on the chart simultaneously. Each of these moving averages has additional settings such as: -Time frame
-Shift
-MA method
-Applied price
Using this indicator, you can easily set up three moving averages and find the one that suits you the best. You can also use this indicator to determine the trend when the moving averages cross.
FREE

The indicator is a 15-minute signal indicator for all types of traders. Meaning, you could make lots of profits trading two different signals in one indicator.
NOTE: Both indicators are channels for achieving the same result. RED ARROW -- Sell Signal BLUE ARROW -- Buy Signal
Purchase now to be part of our community. We offer standard chart setups for both novice and intermediate traders. Trade with ease!
FREE

MACD divergence Simple edition 原始MACD计算方式,升级为双线MACD,使判断更加直观更加贴合大宗交易平台的研究习惯,同时还会自动用实线标出背离,不用再从0开始苦学钻研。
同时,我还提供了提醒服务,在你忙于家务无暇顾及的时候只需要打开音响,一旦达成背离,第一时间就会让你知晓。
这是一款简单版的看背离指标,MACD的九天均线被称为“信号线”,然后绘制在MACD线的顶部,它可以作为买入和卖出信号的触发器。当MACD越过信号线时,交易员可以买入操作,当MACD穿过信号线以下时,交易者可以卖出或做空操作。移动平均收敛-发散(MACD)指标可以用几种方法解释,但更常见的方法是交叉、散度和快速上升/下降。
FREE

This Scanner Dashboard uses the Extreme TMA System Arrows Indicator to show good BUY/SELL signals. This Product contains dashboard only. It does not contain the Abiroid_Arrow_Extreme_TMA.ex4 indicator. Arrows indicator is not necessary for dashboard to work. To see arrows, you can buy the arrows indicator separately if you like: https://www.mql5.com/en/market/product/44822
Dash shows Slopes for current and Higher Timeframes. - 1st diamond is current TF. Next diamonds are higher TFs
(Please N
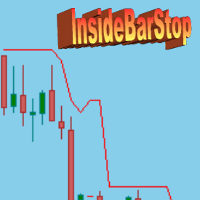
Индикатор предназначен для отображения на графике и визуальной оценки алгоритма трейлинга по внутренним барам "Trailing Stop with Inside Bars", который был впервые предложен знаменитым немецким трейдером и автором Михаель Фойгт (Michael Voigt "Das Grosse Buch дер Markttechnik"). Алгоритм предназначен для фиксирования прибыли при сильных ценовых движениях. Цена трейлинг-стопа показана в виде красной линии. Трейлинг-стоп можно запустить на любом баре графика, указав время открытия необходимой свеч
FREE
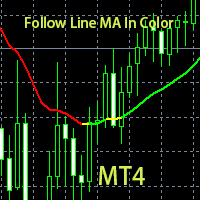
Это пользовательский показатель, основанный на цветовой идентификации.
когда цвет зеленый, сделать больше, чем один.
когда цвет красный, пустой.
когда цвет желтый, то, что конъюнктура будет инверсия, лучше плоского или пустого бункера.
Это я долго следовал за ручной работой, точность высокая, а затем подготовил показатели, которые по цвету линии хорошо обозначают направление, нет времени, валюта ограничения. Нынешний показатель лучше всего работать в течение 15 минут, 30 минут, 1
FREE

The XR Gartley Pattern MT4 is an indicator which displays and alerts Gartley pattern detected on the candlestick chart. It also displays potential trade with calculated Take Profit and Stop Loss, Timeframe H1. After purchasing XR Gartley Pattern, you can immediately download this indicator from the MT4-MT5 Market and start using it because all features are set to default, is not necessary to change any parameter. In addition, we have created a private group for customers who have purchased one
FREE

MASi Three Screens основан на торговой стратегии Доктора Александра Элдера. Данный индикатор является сборником алгоритмов. Алгоритмы основаны на анализе графиков нескольких таймфреймов. Вы можете применить любой из предоставленных.
Список версий алгоритмов ThreeScreens v1.0 - Простая реализация, с анализом MACD линии; ThreeScreens v1.1 - Простая реализация, с анализом MACD гистограммы; ThreeScreens v1.2 - Совмещение двух первых алгоритмов в одной версии; ThreeScreens v1.2.1 - В алгоритм внедр
FREE

TILLSON MOVING AVERAGE Также известен как индикатор TMA или T3. Это скользящее среднее, которое использует EMA и DEMA в своей формуле и рассчитывается с биномиальным расширением 3-й степени . Плюсы; 1- Ошибочные сигналы, встречающиеся в других скользящих средних ( непрерывный зигзаг ). zag ) было максимально сокращено. 2- предотвратило задержки , наблюдаемые в классических скользящих средних . 3- Очень успешен в трендах Минусы 1- Он не эффективен на горизонтальных рынках.
FREE

Эта система поможет найти высоковероятностные сделки в направлении сильных трендов. Возможность заработать прибыль появляется с помощью поиска завершения движения в одну сторону.
Важная информация Для максимального использования потенциала сканера прочитайте полное описание (на английском языке): www.mql5.com/en/blogs/post/718109 Использование индикатора описано в записи в логе (на английском): Professional Trading With Strong Momentum Бесплатная версия индикатора работает только на парах EURU
FREE

Mystic Arrow - уникальный авторский индикатор, отображающий сигналы в направлении основной тенденции, и против нее. Благодаря разнообразию настроек и фильтров индикатор можно настроить под свой стиль торговли. Mystic Arrow подходит для любого таймфрейма, валютной пары. Сигналы индикатора не пропадают ни при каких условиях. Отличительной особенностью является возможность настроить сигналы индикатора отдельно для тенденции и против нее. Имеет в качестве отключаемого фильтра показания ценового кан

Based on famous and useful indicator - Super Trend, we add some features to make this Indicator much easier to use and powerful. Ease to identify the trend of any chart. Suitable for both Scalping & Swing Better to use in the trending market be careful in sideway market, it might provide some fake signals Setting: ATR Multiplier ATR Period ATR Max Bars (Max 10.000) Show UP/DOWN node Nodes size Show Pull-back signals Pull-back filter ratio Period of MA1 Mode of MA1 Period of MA2 Mode of MA2 A
FREE

Следит за текущим трендом, дает сигналы на восходящий тренд, нисходящий тренд и ослабление текущего тренда. Подкрашивает ситуацию на рынке соответствующим цветом. Инструмент - любой. Таймфрейм - любой. Подпишись на мой telegram канал, ссылка в контактах моего профиля . Преимущества: Индикатор не перерисовывает свои сигналы. Есть оповещения сигналов. Легок в использовании. Гибкие настройки. Подходит для торговли любыми финансовыми инструментами. Настройки: Наименование Описание Fast parameter
FREE

Еще никогда отслеживание важных параметров торгового счета не было таким простым занятием! PZ Risk Management помогает поддерживать ваш счет в хорошей форме. Удивительно прост в освоении Не содержит ничего лишнего Вычисляет подверженность активов риску (exposure) по парам и валютам Всегда держит под контролем размер используемого кредитного плеча Быстро оценивает размер валютного риска (currency exposure) Оранжевые метки обозначают зоны особого внимания Красные метки предупреждают об опасности С
FREE
Description
The base of this indicator is an ZigZag algorithm based on ATR and Fibo retracement. This indicator is not redrawing in sense that the ZigZag's last shoulder is formed right after the appropriate conditions occur on the market. The shoulder doesn't change its direction afterwards (can only continue). Note: An indicator with advanced possibilities is also available.
Indicator input parameters
The input parameters allow to change the sensitivity of the ZigZag. ATR period ATR mul
FREE

The Hull Moving Average (HMA), developed by Alan Hull from 2005, one of the most fast-moving Average, reduce lag and easy to use to identify Trend for both Short & Long term. This Indicator is built based on exact formula of Hull Moving Average with 3 phases of calculation: Calculate Weighted Moving Average (WMA_01) with period n/2 & (WMA_02) with period n Calculate RAW-HMA: RAW-HMA = 2 * WMA_01(n/2) - WMA_02(n)
Weighted Moving Average with period sqrt(n) of RAW HMA HMA = WMA (RAW-HMA, sqrt(n
FREE

STOCH AND RSI ALERT https://www.mql5.com/en/users/earobotkk/seller#products (I have created a dashboard from this product, please take a look by clicking here ) (I have also created an EA from this product, NOW user can go automation, click here ) P/S: If you like this indicator, please rate it with 5 stars in the review section, this will increase its popularity so that other users will be benefited from using it. This indicator notifies and draws an arrow on the chart whenever the main sto
FREE
Indicator Rua Alert Trend Line. This indicator will notify when the price breaks any trendline on the chart. Notifications will be sent to the phone and on MT4. Custom parameters: in_NumbersAlert: The number of notifications that will be sent when the price breaks the trendline. A product of Ruacoder Provide code indicator and EA services upon request. Contact: Telegram : https://t.me/Ruacoder
FREE

Key Level Key Level is a MetaTrader 4 Indicator that uses a proprietary algorithm based on Price Retracement/Breakout Method to show the Entry-Line on your trading.
Instead, it analyzes data of market and identify entry points and opportunities. (Price Retracement / Price Breakout)
It's also a trading tool that be used to practice and enhance your manual trading skills.
Key Level is an amazing tool for Scalping Trader. It also a trading tool that be used to practice and enhance your manual t
FREE

Average daily range, Projection levels, Multi time-frame ADR bands shows levels based on the selected time-frame. Levels can be used as projections for potential targets, breakouts or reversals depending on the context in which the tool is used. Features:- Multi time-frame(default = daily) Two coloring modes(trend based or zone based) Color transparency
FREE

Линия безубыточности от MMD
Линия безубыточности является полезным индикатором для людей, использующих стратегии, допускающие одновременные сделки в обоих направлениях, такие как методология MMD. Этот индикатор полезен при игре статистических моделей и усреднении позиций в зонах накопления и распределения. Индикатор строит уровни, суммируя позиции в три группы: позиции входящие в ПОКУПКУ, позиции входящие в ПРОДАЖУ и все включенные позиции.
Описание функционала:
Show BUY BELine - показыва
FREE

Was: $49 Now: $34 Blahtech Better Volume provides an enhanced version of the vertical volume bars. Each bar is compared to the previous 20 bars. Depending on its volume, range and volume density it will be assigned a state and colour. Low Volume – Minimum volume High Churn – Significant volume with limited movement Climax Neutral – High volume with unclear direction
Climax Up – High volume with bullish direction Climax Dn – High volume with bearish direction Climax Churn – High vol

This indicator is designed to find the difference in RSI price and indicator. This indicator shows the price and indicator difference on the screen. The user is alerted with the alert sending feature. Our Popular Products Super Oscillator HC Cross Signal Super Cross Trend Strong Trend Super Signal
Parameters divergenceDepth - Depth of 2nd ref. point search RSI_Period - Second calculation period indAppliedPrice - Applied price of indicator indMAMethod - MA calculation method findExtInt
FREE

Screener Breakout Congestion: Have you ever missed a trading opportunity because you were not looking at the chart of that market in that specific time frame? Here is this screener to help you identify congestion breakouts in the markets you want to follow in the different time frames required. Once you have identified the markets (forex, indices, CDF) and the different time frames (1M, 5M, 15M, 30M, 1H, 4H, Daily), the screener is represented by several buttons that change colour when the conge
FREE

False Breakout Stochastic to be used with our Elliott Wave Indicator as part of the overall strategy on trading the 5th wave.
As we cannot upload multiple files, we have listed this separately. False Breakout Stochastic is best used as a confirmation tool rather than the sole signal indicator The Elliott Wave Indicator Suite is designed around a simple but effective Swing Trading Strategy. The Indicator Suite is great for Stocks, Futures and Forex trading on multiple timeframes You can find the
FREE

This is a multi time frame demand and supply indicator for MT4 platform. You can use multi time frame demand and supply levels on smaller time frames. Additionally you can choose to kill every level has has been tested. you have narrow bands that is you can select the whole demand and supply level or just a narrow section Finally, you also get price range for the zones. Awesome
FREE

Скользящие средние меняются на ходу. Индикатор автоматически подбирает период для расчёта скользящих средних. Чем более направленное движение, тем больше период усреднения. При замедлении тренда период уменьшается и MA становятся более быстрыми. Это позволяет быстрее реагировать на смену тренда. Индикатор хорошо работает в тренде или в точке разворота тренда. В боковике индикатор можно использовать наоборот, например когда быстрая скользящая пересекает медленную вверх-это сигнал на продажу. Или
FREE

The YK-LOT-SIZE is an indicator that displays the total Lot Size and profit/loss of all trade orders for the current symbol on the price chart. It has the following features: Shows the total Lot Size of buy orders (BUY) and sell orders (SELL) on separate lines. Displays the profit/loss of buy orders (BUY) and sell orders (SELL) by calculating the sum of profit, commission, and swap. Users can customize the color of the displayed text through the input parameter. The information is displayed at t
FREE
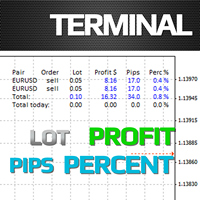
Terminal - индикатор, который служит заменой стандартной вкладке Терминал. Внешне индикатор представляет собой некое подобие таблицы и состоит из нескольких элементов: Строка с описанием столбцов; Открытые ордера; Суммарная информация по открытым ордерам; Суммарная информация по закрытым ордерам за текущий день. Настройки индикатора: Graph corner for attachment - Угол привязки к графику экрана Font - Шрифт Fontsize - Размер шрифта Text color - Цвет текста Profit color - Цвет профита Loss color -
FREE
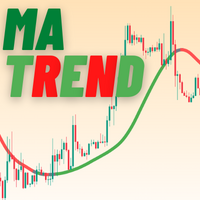
MATrend indicator makes the directional trend of the current market easily recognizable. Settings: MA Period : The amount of candles taken into consideration for the calculation of the moving average; MA Method : The method used for the calculation of the moving average. Selectable methods are: Simple averaging;
Exponential averaging;
Smoothed averaging;
Linear-weighed averaging; Usage: The color of the indcator will change based on the slope of the MA. Green : The indicator has a bullish
FREE

This indicator plots another symbol on the current chart. A different timeframe can be used for the symbol, with an option to display in multiple timeframe mode (1 overlay candle per several chart candles). Basic indicators are provided. To adjust scaling of prices from different symbols, the overlay prices are scaled to the visible chart price space.
Features symbol and timeframe input MTF display option to vertically invert chart, eg overlay USDJPY, invert to show JPYUSD
data window values
FREE

Индикатор использует линии Полос Боллинджера для обнаружения тренда. Очень полезный инструмент для ручной торговли. Кроме того, можно использовать индикатор с ATR в качестве фильтра, а также включить всплывающее уведомление при развороте тренда. Показатели индикатора очень понятны и просты в использовании. Лучше всего индикатор работает на таймфрейме H1.
Параметры советника: BarsCount - количество баров для расчета линии. BBperiod - период полос Боллинджера. BBdeviations - отклонения полос Бол
FREE

Индикатор BB Arrows MTF построен на основе индикатора Bollinger Bands . Представляет собой сигналы на вход в виде стрелок. Все сигналы образовываются на текущем баре. В 2 режимах Сигналы не перерисовываются (Исключение очень резкие скачки) ! Все сигнала в режиме MTF, соответствуют сигналам того периода, который указан в MTF. Максимально упрощен в использовании как для торговли исключительно одним индикатором, так и для использования индикатора в составе Ваших торговых систем. Особенностью ин
FREE

Если вам нравится этот проект, оставьте 5-звездочный обзор. Следуйте на instagram: borelatech Торговля большими объемами требует, чтобы мы рассмотрели несколько
инструментов/чартов для
найти новые возможности, этот показатель поможет вам при составлении конкретных
уровни множественным числом или его суффиксом и обновлять их автоматически
как изменение цены, задача, которая в противном случае будет утомительной. Например, на GBPUSD вы могли бы иметь 4 экземпляра индикатора на
диаграмма к сю
FREE

Стрелочный индикатор, для определения разворотов цены Стрелка появляется на закрытом баре Позволяет входить в сделку в самом начале разворота Можно использовать на любых валютных парах, металлах и криптовалюте Подходит для работы с бинарными опционами
Отличительные особенности Определяет коррекции цены; Дополнительные параметры для точной настройки; Работает на всех таймфмреймах и на всех символах; Подходит для торговли валютами, металлами, опционами и криптовалютой (Bitcoin, Litecoin, Ethereu
FREE

Индикатор Camarilla Pivots Historical строит на графике исторические данные по уровням пивотов Камарилья. Уровни пивотов Камарилья были разработаны в 1989 году Ником Скоттом. Эти уровни используются в качестве основных уровней поддержки и сопротивления при внутридневной торговле. Уровни вычисляются по следующей формуле: R4 = C + RANGE * 1.1/2 R3 = C + RANGE * 1.1/4 R2 = C + RANGE * 1.1/6 R1 = C + RANGE * 1.1/12 PP = (HIGH + LOW + CLOSE) / 3 S1 = C - RANGE * 1.1/12 S2 = C - RANGE * 1.1/6 S3 = C -
FREE
MetaTrader Маркет - торговые роботы и технические индикаторы для трейдеров, доступные прямо в терминале.
Платежная система MQL5.community разработана для сервисов платформы MetaTrader и автоматически доступна всем зарегистрированным пользователям сайта MQL5.com. Ввод и вывод денежных средств возможен с помощью WebMoney, PayPal и банковских карт.
Вы упускаете торговые возможности:
- Бесплатные приложения для трейдинга
- 8 000+ сигналов для копирования
- Экономические новости для анализа финансовых рынков
Регистрация
Вход
Если у вас нет учетной записи, зарегистрируйтесь
Для авторизации и пользования сайтом MQL5.com необходимо разрешить использование файлов Сookie.
Пожалуйста, включите в вашем браузере данную настройку, иначе вы не сможете авторизоваться.