Conheça o Mercado MQL5 no YouTube, assista aos vídeos tutoriais
Como comprar um robô de negociação ou indicador?
Execute seu EA na
hospedagem virtual
hospedagem virtual
Teste indicadores/robôs de negociação antes de comprá-los
Quer ganhar dinheiro no Mercado?
Como apresentar um produto para o consumidor final?
Indicadores Técnicos Grátis para MetaTrader 5 - 20

This indicator shows the value of returns in the selected time frame
They are calculated as logarithm of returns , rather than price or raw returns. For small returns, arithmetic and logarithmic returns will be similar. The benefit of using returns, versus prices, is normalization. It is possible measures all variables in a comparable metric despite originating from price series of unequal values
Inputs You can display data both as a Histogram or a Line It's also possible to display the
FREE

This is a multi frame stochastic indicator, you can attach any time frame of stoch indicator on one chart. It is very useful if you like to check multi time frame stoch data. If you are interested in EA,click below links to take a look: https://www.mql5.com/en/market/product/80170 https://www.mql5.com/en/market/product/81136
How to use: > Atach the first time frame you want on to the currency pair's chart > Atach the second time frame you want on to the currency pair's chart > Atach the thir
FREE
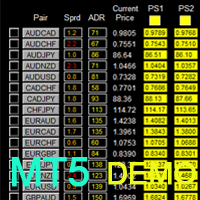
提供专业的EA编程服务,推出特色仪表盘EA编程,将您的交易策略自动化,可视化,一个图表管理多个交易货币对,详情查看: http://www.ex4gzs.com Providing quick Developments and Conversion of MT4/MT5 EAs, Indicators, Scripts, and Tools. If you are looking for an Dashboard EA to turn your trading strategy into auto trading algo and to manage multi trades in one chart with visualizing tool, come and visit http://www.ex4gzs.com/en for more details. 如果产品有任何问题或者您需要在此产品上添加功能,请联系我 Contact/message me if you encounter any issue using the product or need extra featur
FREE

//////////////////////////////////////////////// //////////////////////////////////
An improved version of the standard Average True Range indicator.
It is now a responsive and smoothed line.
The setup is not straightforward - but I hope you can do it. It is very easy to understand the readings of this indicator, the meaning is the same as that of the standard Average True Range.
//////////////////////////////////////////////// ///////////////////////////////////
I hope this indicator
FREE
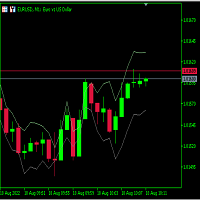
Just learning how to create an indicator from this tutorial .
its just a garbage text to fill the descriptions. Hello there. Hello there Hello there Hello there Hello there Hello there Hello there Hello there Hello there Hello there Hello there Hello there Hello there Hello there Hello there Hello there Hello there Hello there Hello there Hello there Hello there
FREE
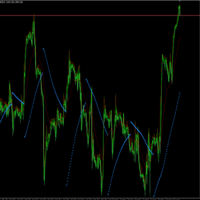
La idea de este indicador es la siguiente: reemplazar los precios High, Low del indicador SAR por los valores del indicador Moving Average. Al final tendremos la siguiente imagen:
Es decir, el indicador SAR cambia su dirección después de tocar el indicador Moving Average.
Parámetros de entrada SAR: Step - parámetro "Step" del indicador SAR; SAR: Maximum - parámetro "Maximum" del indicador SAR; MA: Period - parámetro "período de promediación" del indicador MA; MA: Shift - parámetro "d
FREE

Whether you're an analyst looking for a Fibonacci charting platform for Fibonacci Ratio analysis, or a trader looking for an advanced Fibonacci trading tool, Ultimate Fibonacci has what you need.
Ultimate Fibonacci has the most advanced and full-featured Fibonacci charting and trading software on the market.
GIVE ME A GOOD RATING!
Ultimate Fibonacci measures and calculates Fibonacci projections and Retracement levels for you, as well as Price projections (like Wave 2 vs. 1 or Wave 4 vs. 2
FREE

Что такое Momentum DA? Индикатор Momentum DA- это инструмент техническго анализа, который измеряет скорость, с которой меняются цены активов за определенный период времени. Является модификацией обчного Momentum. Основная идея этого индикатора заключается в том, чтобы помочь трейдерам определить возможные точки разворота ценового тренда, определяя моменты ускорения или замедления роста или падения цен. Он основан на предположении, что быстрое увеличение цены будет вероятно сопровождаться
FREE
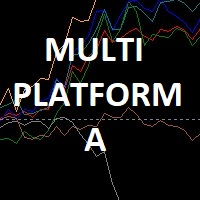
Мультивалютный индикатор в отдельном окне отображает движение валютных пар в пунктах с расхождением от начала дня. Во время работы, динамически возможно включать и отключать различные пары прямо на графике. При первом запуске, возможно, потребуется продолжительное время, пока загрузиться история для основных валютных пар. Для валют CAD, CHF, JPY - график перевернут.
При повторном открытии, все настройки индикатора восстанавливаются автоматически.
FREE

Equidistant bands indicator with calculated moving average, allows you to configure the band size and can be used freely as an entry / exit indicator. Buffer 0 = price, buffer 1 = upper band, buffer 2 = lower band. you can also configure the periods of moving averages used in the calculations and also the shift to previous bars in addition to the price that can CLOSE (default) or OPEN. Excellent for fast daily moving pairs and frequent returns.
FREE

The indicator paints the candlesticks of the chart in colors calculated from the values of the strengths of the bulls and bears.
It works like this:
The values of the two indicators Bears and Bulls are taken, and who is stronger on the candlestick is compared. It's all.
.
FREE

FRB Time Indicador que mostra o Horário do servidor de operação. Você pode editar a cor e o tamanho da fonte do horário.
Configuração Cor da Fonte Tamanho da Fonte Cor de Fundo
Para movimentar o Horário, basta clicar em cima e mover o mouse para onde você quiser deixá-lo. Após posicionar o Horário onde você deseja, clique novamente ou aperte "ESC" e o horário ficará onde você deixou.
FREE

主要城市的时间。北京时间、东京时间、悉尼时间、惠灵顿时间、纽约时间、法兰克福时间、伦敦时间、迪拜时间。 城市时间可选择开启或者关闭。 点差变色提醒。设置点差提醒点数,例如,设置100点,点差大于100点,文字会变红色。 Time in major cities. Beijing time, Tokyo time, Sydney time, Wellington time, New York time, Frankfurt time, London time, Dubai time. City time can be turned on or off. Dot difference color change reminder. Set the point difference reminder points. For example, set 100 points. If the point difference is greater than 100 points, the text will turn red.
FREE

JCStatistics 简繁数据统计 1.显示账户信息:内容显示 交易员、账号、本金、杠杆、保证金、保证金比例、余额、净值; 日周月开盘余额、持仓收益、日收益、周收益、月收益; 收益为正时显示红色字体,收益为负时显示绿色字体; 日收益低于-5%时显示CircuitBreak; 总收益低于-10%时显示MarginCall; 2.显示统计数据: 收益(收益率)(交易量)(胜率) 5日数据;4周数据;12月数据; 3.当前标的统计:Symbol()收益(交易量)(胜率) 4.主流标的统计:收益(交易量)(胜率) 可以选择性显示账户信息、数据信息,调整显示颜色,调整字体,调整字体大小。 指标删除后自动删除桌面文字及背景。 备注:如遇使用问题,请联系邮箱:16692618587@qq.com.
FREE

Main purpose: This indicator calculates the average of previous candles (a half of candle points). This value represent the strength of market (buy/sell) in each candle.
Parameters: . Period: indicating previous candles to calculate average . Shift: draw line at a shift on chart.
Tip: We can use this value to consider TP and SL of a position before opening.
FREE

Not everyone can write an indicator. But anyone can have an idea. The indicator Universal Main Window Free MT5 , which takes as an input parameter the formula by which the indicator line will be drawn, will help to implement it. This indicator is intended for use in the main chart window.
All indicators of the series Universal :
Main window Separate window Free MT4 Universal Main Window Free MT5 Universal Main Window Free MT5 MT4 Universal Separate Window Free MT5 Universal Separate Window F
FREE

Shadow Height mt5 Indicador de sombra.
Exibe o tamanho das sombras do castiçal, em pontos, como um histograma. Funciona em dois modos, selecionáveis pelo usuário. Descrição das configurações do indicador Modo - modos de operação do indicador, dois modos: primeira altura - modo de exibição para as sombras do castiçal superior e inferior; a segunda diferença é o modo de exibição da diferença nas sombras do castiçal, a diferença entre as sombras superior e inferior do castiçal.
FREE
如果产品有任何问题或者您需要在此产品上添加功能,请联系我 Contact/message me if you encounter any issue using the product or need extra feature to add on the base version.
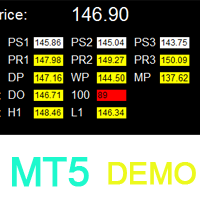
To access the full version, please re-direct to this LINK . To access the dashboard version, please re-direct to this LINK . Critical Support and Resistance Demo is the demo version of Critical Support and Resistance which have full functionalities of the paid version, except only Pivot R1/R2/R3 and Daily Open will be triggered for alert and/or notifica
FREE

This indicator helps keep track of the number of trades taken in the day. It shows losses and potential profit then the total profits which is, profits - losses. Then total profit for the week and month. Soon the indicator will be sharing some trading tips based on your trading. It really does put necessary pressure and helps you to set a goal for yourself for the day. Familiarise yourself to draw your analysis on the same chart with the indicator because it will have to alert you if price brok
FREE

Not everyone can write an indicator. But anyone can have an idea. The indicator Universal Separate Window Free MT5 , which takes as an input parameter the formula by which the indicator line will be drawn, will help to implement it. This indicator is intended for use in the separate chart window.
All indicators of the series Universal :
Main window Separate window Free MT4 Universal Main Window Free MT5 Universal Main Window Free MT5 MT4 Universal Separate Window Free MT5 Universal Separate
FREE
Você sabe por que o mercado MetaTrader é o melhor lugar para vender as estratégias de negociação e indicadores técnicos? Não há necessidade de propaganda ou software de proteção, muito menos problemas de pagamentos. Tudo é providenciado no mercado MetaTrader.
Você está perdendo oportunidades de negociação:
- Aplicativos de negociação gratuitos
- 8 000+ sinais para cópia
- Notícias econômicas para análise dos mercados financeiros
Registro
Login
Se você não tem uma conta, por favor registre-se
Para login e uso do site MQL5.com, você deve ativar o uso de cookies.
Ative esta opção no seu navegador, caso contrário você não poderá fazer login.