Conheça o Mercado MQL5 no YouTube, assista aos vídeos tutoriais
Como comprar um robô de negociação ou indicador?
Execute seu EA na
hospedagem virtual
hospedagem virtual
Teste indicadores/robôs de negociação antes de comprá-los
Quer ganhar dinheiro no Mercado?
Como apresentar um produto para o consumidor final?
Expert Advisors Grátis e Indicadores para MetaTrader 5 - 14

Magic Trend
This MT5 indicator is a Moving Average with 3 signal colors. The 3 input parameters on this Indicator give you a chance to set any Moving Average of choice. A combination of 2 different exponential moving averages, relative strength index, commodity channel index, and William's percent range provide the signals.
White color = Null/No/Exit Signal Green color = Buy Signal Red color = Sell Signal
Point To Note: Confirm the color change only after the current candle closes to avo
FREE

This is a free version and is forecasting only 5 bars The FourierExtrapolationMAFree indicator transforms and extrapolates the Moving Average function by the Fast Fourier Transformation method.
1. The transformation period is set by two vertical lines, by default the first blue line and the second pink.
2. By default, the Moving Average (MA) line is drawn in red.
3. By Fourier Transform, the indicator builds a model of N harmonics, which is as close as possible to the MA values. The model
FREE
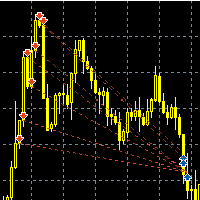
Название советника : Survivor (есть расширенная версия: https://www.mql5.com/ru/market/product/36530 ) Валютные пары : USDJPY, EURUSD, GBPUSD, AUDUSD, GBPJPY, XAUUSD, EURCHF Рекомендованная валютная пара : USDJPY Таймфрейм : М5 Время торговли : круглосуточно Описание : Трендовый советник с возможностью мартингейла и построением сетки ордеров. В советнике используются три группы аналогичных сигналов для открытия, закрытия и дополнительных сделок. При наличии тренда(определяется МА) ловится отс
FREE

Smart Grid MT5 automatically recognizes any symbol, period and scale of the chart and marks it up accordingly. It is possible to mark up the chart by trading sessions. The grid consists of the two main line types.
Vertical lines There are two visualization methods: Standard - the lines are divided into three types, separating: Small time period. Medium time period. Large time period. Trading Session - the lines are divided into groups (a total of ten). Each group has two lines: the first is re
FREE

El indicador técnico Trend Magic es una herramienta de análisis de tendencias que combina el Índice de Canal de Mercancía (CCI) y el Rango Verdadero Medio (ATR) para identificar la dirección de la tendencia del mercado. Aquí tienes un resumen de sus pros y contras, así como las mejores condiciones del mercado para su uso:
Pros: - Identificación clara de la tendencia: Cambia de color para indicar tendencias alcistas (azul) y bajistas (rojo), lo que facilita la visualización de la dirección del
FREE
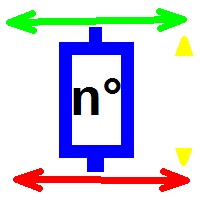
Setup da tia do café Este Robo é uma homenagem ao setup da tia do café postado em 2016 pelo rafa trade em uma live da treta redonda A Carol e o Joaquin Paiffer donos da ATOM S/A aceitaram um convite pra participar da live E nesse video o rafa trade mostrou um setup da tia do café que é o setup que a Carol ensina Operacional do setup A estrategia de trade é operar a primeira barra do dia no grafico M5, se romper pra cima é compra se romper pra baixo é venda Cancelamento Se pegar em qualquer uma
FREE
Tick Chart Monitor with countdown tick volume and easy to change tick size without going back to main chart. This work with Tick Chart Generator , which are available for download from the MQL5 Market: Tick chart generator: https://www.mql5.com/en/market/product/79763 NOTE: Custom symbols on MT5 are not directly tradable. This is by Metatrader5 design. If you want to place trades directly on the custom symbol generated by this product, you will either need a trade panel that offers this functi
FREE

O indicador de Momento do Mercado é baseado no Oscilador de Zona de Volume (VZO), apresentado por Waleed Aly Khalil na edição de 2009 do jornal da Federação Internacional de Analistas Técnicos , e apresenta uma nova visão desses valiosos dados de mercado que muitas vezes são mal compreendidos e negligenciados: o VOLUME. Com essa nova abordagem de "ver" os dados de Volume, os traders podem inferir de maneira mais adequada o comportamento do mercado e aumentar suas chances em uma negociação bem-su
FREE

O Indicador valida a força da tendência utilizando o volume negociado. Os candles são mostrados na cor verde indicando força compradora e cor vermelha na força vendedora. O movimento é encerrado pelo SAR parabólico. Vantagens: Filtra distorções de preço sem volume financeiro; Filtra consolidações e movimentos laterais; Filtra divergências de volume pelo indicador Money Flow. Desvantagens: Não filtra todos os falsos rompimentos, visto que rompimentos importantes geram altos volumes financeiros; N
FREE

Indicador padrão Bill Williams Fractals com a capacidade de especificar o número de velas a serem formadas. O indicador funciona em todos os gráficos e períodos de tempo.
Configuração: candles - número de velas à esquerda e à direita, com base no qual o fractal é construído (num indicador clássico este valor é sempre 2)
Contacto: Se tiver alguma dúvida ou precisar de ajuda, contacte-me através de mensagem privada. Autor: Fertikov Serhii, Mais dos meus indicadores, conselheiros, scripts e
FREE

Indicator Introduction: The indicator comes from network ,It is more stable relative to RSI or CCI. It can be used to analyze market trend and design new expert that is based on trend. If the indicator below the axis ,this is a buy zone. The trend indicator is suitable for M1 and above timeframes. The work of the indicator is shown in the screenshots. My other indicators and EAs can be found at here : https://www.mql5.com/zh/users/hzx/seller
FREE

JCAutoStm 简繁塞壬模型 1.Zigzag3浪,大中小三浪代表市场潮流、趋势、涟漪。 2.自动识别当前三浪的走势,命名每一种结构形态。 Zig123下跌3浪5浪7浪:D3/D5/D7,下跌中继形态:DRF1/DRF2/DRF3,底部反转形态:BRP1,BRP2,BRP3,特殊结构下跌5浪后底部反转结构Zig123D5BRP1/2 Zig123上涨3浪5浪7浪:U3/U5/U7,上涨中继形态:URF1/URF2/URF3,顶部反转形态:TRP1,TRP2,TRP3,特殊结构上涨5浪顶部反转结构Zig123U5TRP1/2 3.趋势线绘制,分别以大中小三浪相邻的高低点进行绘制。 绘制的原则是,收敛形态。 4.三浪有效SR,F3,F6,F12,F15,绘制水平线。 MACD背离线
FREE

HighDaily
The Expert Advisor has been developed for EURUSD H1 based on HighDaily, ATR, and pending orders. It has been backtested on over 20 years of tick data with a modeling quality of 99%. The attached screenshots feature the robustness test through Monte Carlo analysis with 1000 simulations. We recommend using a broker with low spreads and slippage for better performance. There is no need to set up any parameters; these settings are optimized. There is no need to use a large account. We rec
FREE

A pin bar pattern consists of one price bar, typically a candlestick price bar, which represents a sharp reversal and rejection of price. The pin bar reversal as it is sometimes called, is defined by a long tail, the tail is also referred to as a “shadow” or “wick”. The area between the open and close of the pin bar is called its “real body”, and pin bars generally have small real bodies in comparison to their long tails.
The tail of the pin bar shows the area of price that was rejected, and
FREE

This indicator evaluates the market sentiment using raw price action measurements, and it is an amazing trading confirmation. It can be used to take a trend-trade approach or a contrarian approach using reversal patterns. [ Installation Guide | Update Guide | Troubleshooting | FAQ | All Products ] Find early reversals Confirm short-term trades Detect indecision on the market Take contrarian trades near support and resistance levels Trade inside bars confirmed by overall direction of the market T
FREE

The seven currencies mentioned are: GBP (British Pound): This is the currency of the United Kingdom. AUD (Australian Dollar): This is the currency of Australia. NZD (New Zealand Dollar): This is the currency of New Zealand. USD (United States Dollar): This is the currency of the United States. CAD (Canadian Dollar): This is the currency of Canada. CHF (Swiss Franc): This is the currency of Switzerland. JPY (Japanese Yen): This is the currency of Japan. Currency strength indexes provide a way to
FREE
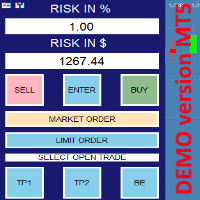
this is DEMO VERISON (for demo acc.) of TRADING OVERLAY with PARTIAL take profit ("virtual TP") and % risk lot size
--- full version available on my 'seller page' as well as version for MT4 Take better control of your trades with ease ! Easy lot size calculation with easy SL/TP setting. Your trading will be much more comfortable with this tool!
Main goal with this tool is very SIMPLE and FAST operation! Works like any EA, add it to selected chart and trade !
Features: start
FREE

Koala Trend Line atualizado para a versão 1.2
Última atualização de melhoria: Novo parâmetro adicionado que permite ao usuário conectar a linha de tendência ao 2º, 3º ou Xº ponto mais alto ou mais baixo.
Meu pedido :
** Prezados clientes, por favor, liberem sua avaliação sobre a linha de tendência Koala e deixe-me melhorar com seus comentários.
POR QUE O KOALA TREND LINE É INDICADOR GRÁTIS?
Acredito que o indicador livre deve ser uma ferramenta qualificada.
E OS OUTROS PRODUTOS G
FREE

I present the well-known Fractal indicator.
Levels have been added to this indicator.
At the extreme points, you can see the continuation of the price line, which changes when the values of the Fractal indicator change.
The indicator is easy to use. The basic Fractal settings have been saved.
FractalLevels Parameters:
LeftBars - the number of bars on the left
RightBars - the number of bars on the right
FREE

VWAP RSJ é um indicador que representa as linhas horárias, diárias, semanais e mensais do VWAP.
Grandes compradores institucionais e fundos mútuos usam o índice VWAP para ajudar a entrar ou sair de ações com o menor impacto possível no mercado.
Portanto, quando possível, as instituições tentarão comprar abaixo do VWAP ou vender acima dele.
Dessa forma, suas ações empurram o preço de volta para a média, em vez de afastá-lo dela.
Com base nessas informações, desenvolvi este indicador que
FREE

Expert advisor based on your own personal moving average strategy. Whatever your strategy is, it's him. You can use it on all parities. No restrictions. Settings Buy Settings : 1.Moving Average Period 1.Moving Average Method 2.Moving Average Period 2.Moving Average Period Buy Lot Size Buy Stop Loss Level Buy Take Profit Level
Sell Settings : 3.Moving Average Period 3.Moving Average Method 4.Moving Average Period 4.Moving Average Period Sell Lot Size Sell Stop Loss Level Sell Take Profit Level
FREE

Эксперт, способный приносить прибыль при открытии позиций случайным образом. Показывает хорошие результаты при долгосрочном трейдинге – на периодах от H12.
Особенности
Доступен полностью автоматический режим работы. Открытие позиций производится случайным образом. Применяется Мартингейл – в случае, если предыдущая позиция закрылась с убытком, текущая открывается с объемом, компенсирующим данный убыток. Параметры
Mode – режим работы Эксперта: Automatic – автоматический (рекомендуется); Ma
FREE

There is a science, named Quantitative Finance, that allows to study the financial derivative pricing models using the methods of theoretical and mathematical physics.
Lately I came across a paper that describes a new indicator for technical analysis that combines ideas from quantum physics and brings them to finance. I got interested in it and decided I would teach how to implement indicators based on a scientific papers in MQL5.
The original Moving Mini-Max paper [2] is written by Z.K. Sila
FREE

Daily pivot are relatively important in trading.
This indicator have options to select 5 commonly use pivot point calculations.
User input Choose Pivot Point Calculation (Method Classic, Method Camarilla, Method TomDeMark, Method Fibonacci or Method Woodies.) Choose Applied Timeframe for the calculation (M5, M15, H1, H4, D1, W1 etc) Can be attached to any timeframe Choose color of Pivot point Note:
For MT4, please refer here : https://www.mql5.com/en/market/product/22280
FREE

Este indicador é um indicador de volume ele altera a cor dos candles de acordo com um determinado números de ticks, e esse número de ticks pode ser informado pelo usuário tanto o numero de ticks quanto a cor dos candles, este indicador funciona em qualquer tempo gráfico ou qualquer ativo, desde que esse ativo tenha um numero ticks para serem informados. Este indicador procura facilitar a visualização do usuário ao analisar candles com um determinados números de ticks.
FREE

The indicator shows Jake Bernstein's MAC (Moving Average Channel) System signals ---------------------------------------- System assumes several types of entering in trade, in this indicator only one type implemented - on closing of second trigger bar. It is recommended to start using this indicator together with Jake Bernstein's free lessons https://www.youtube.com/@JakeatMBH/videos Arrow shows signal bar - enter on closing or on opening of the next bar, cross - stop level, dot - minimum profi
FREE

The index makes it easy for traders to know the opening and closing times of global markets :
- Sidney - Tokyo - London - New York
Where it misleads each time zone and enables us to know the times of overlapping the markets when the liquidity is high.
To get more indicators and signals, follow us on the Telegram channel link
https://t.me/tuq98
Or our YouTube channel, which has explanations in Arabic and a technical analysis course
https://www.youtube.com/@SSFX1
FREE

Análise de derrapagem projetada para negociação de alta precisão e todo o mercado Ele funciona em contas ativas e demo e permite que você analise todas as suas posições com take profit e stop loss, para que você possa analisar a derrapagem do seu corretor.
O que é Slippage no comércio? O slippage ou deslizamento é a diferença de preço que pode ocorrer entre o momento em que uma ordem de negociação é colocada e sua efetiva execução no mercado.
Isso porque, a partir do momento em que a ordem
FREE

O Pz Oscillator é um acelerômetro muito suave e sensível que fornece uma série de informações úteis e detecta automaticamente as divergências . É uma grande confirmação de negociação e pode ser usado para identificar a direção e força da tendência. Ele foi projetado como um complemento para as nossas ferramentas de negociação.
Direção de tendência O oscilador plota duas médias móveis para mostrar a direção da tendência. Se a média móvel rápida está acima da média móvel lenta, o mercado está em
FREE

Что такое Awesome Oscillator? Создателем данного индикатора является Билл Вильямс. Этот трейдер разработал собственную торговую систему. Её основой служит постулат: «Рынок движется хаотично. Какие-либо закономерности этого движения вывести довольно сложно, так как многое зависит от психологических факторов.» Поэтому Вильямс разработал собственные инструменты для анализа рынка.
Одним из таких инструментов и является индикатор АО. Это осциллятор, который дает возможность выявить силу текущего
FREE

Camarilla Swing Trade Indicator is an Indicator. Support and resistance points are calculated from the High Low Close of the previous TF Week's price.
What are Camarilla Pivot Points?
1.Camarilla Pivot Points is a modified version of the classic Pivot Point. 2.Camarilla Pivot Points was launched in 1989 by Nick Scott, a successful bond trader. 3.The basic idea behind Camarilla Pivot Points is that price tends to revert to its mean until it doesn't. 4.Camarilla Pivot Points is a mathematical
FREE

This is an indicator that shows total pips ,order counts and the total profit accumulated for the open orders of the pair attached. The colors change depending on if the total profit is positive , negative or zero. Contact:
If you have some questions or if you need help, kindly contact me via Private Message. Author: A.L.I, fintech software engineer and a passionate forex trader.
FREE

Description : Enhance Your Trading Strategy with the Advanced Vortex Indicator for MT5! Discover the power of the Vortex Indicator (VI), a robust technical analysis tool now available for MetaTrader 5. This custom-built indicator is designed to help traders identify trends and reversals, offering a critical edge in the dynamic Forex market. Key Features: Dynamic Trend Identification : With the VI's unique calculations of VI+ (positive) and VI- (negative) lines, you can easily spot trend strength
FREE

CINDERSHOT FX IS NOW FREE!!! AS PART OF A PUSH TO OFFER MORE FREE TRADING SYSTEMS TO THE COMMUNITY I AM INCREASING MY OFFERINGS OF FREE HIGH PERFORMANCE SYSTEMS AT ZERO COST!!! Introducing CinderShot FX: The Premier Expert Advisor for NZDUSD H1
Experience the pinnacle of trading precision with CinderShot FX, the ultimate Expert Advisor meticulously engineered for the NZDUSD H1 chart. This exceptional trading system is the culmination of relentless research and development, featuring 100 rigor
FREE

CANDLESTICK_MT5
A very interesting indicator of candlestick patterns, converted from the free version of the CANDLESTICK indicator for the MetaTrader4 terminal to the version for the MetaTrader5 terminal. In addition to candlestick patterns, it draws support and resistance lines, which are perfectly worked out by the price on the chart. It can work on any timeframe. Has simple settings. When converting, the logic of work and the design of the original CANDLESTICK indicator for the MT4 termina
FREE

TG Ponto de Cobertura Este Indicador verifica o seu resultado das operações no dia relativo ao ativo do gráfico e adiciona uma linha no preço correspondente ao ponto de cobertura para a posição aberta, considerando o preço de entrada e o tamanho do lote. O ponto de cobertura será recalculado após novas entradas, se baseando no preço médio da operação aberta e o tamanho do lote.
Se o resultado do dia estiver zerado, uma linha será exibida no preço da operação atual. Se o resultado do dia estive
FREE

A small utility displays the time in five time zones. You can customize the display of one to five time zones. For each time it is configured: show or not; name; time offset from GMT; color; In general settings, you can change: date / time format ("hh: mi", "hh: mi: ss", "yyyy.mm.dd hh: mi", "yyyy.mm.dd hh: mi: ss") font name; font size; offset from the left edge of the chart; offset from the top edge of the chart;
FREE

Descrição :
estamos felizes em apresentar nosso novo indicador gratuito baseado em um dos indicadores profissionais e populares no mercado forex (PSAR) este indicador é uma nova modificação no indicador SAR parabólico original, no indicador pro SAR você pode ver o cruzamento entre os pontos e o gráfico de preços, este crossover não é sinal, mas fala sobre o potencial de fim de movimento, você pode começar a comprar pelo novo ponto azul e colocar o stop loss um atr antes do primeiro ponto azu
FREE

Genaral: Not martingale, not a grid; Use on EURUSD Use on M5 EA was opimized only on 2020 year
Signals: There is a good rational algorithm. Work of 3 indicators: WRP, DeMarker, CCI (from 3 timeframes) (you can set a separate Timeframe for each indicator)
Stop Loss/Take Profit: There is a good money management system (there are several type for trailing stop loss); There is virtual levels of Stop Loss / Take Profit; There is smart lot (percent by risk) or fix lot
Important: EA can work
FREE

The Big Mac B MQL5 expert advisor is a based off a Bollinger breakout strategy. The MACD indicator is used to confirm either a buy or sell trend. The MFI indicator to act as a trading range to ensure that the buy or sell is not activated when the price is in an overbought or oversold condition.
Trades will only be entered if the current price is within the trading range of the MFI indicator. Default settings are for the USDJPY on the 5 minute time-frame.
To work with the news server, you must
FREE

The "Simple Trading Controller" for MetaTrader 5 sets a new standard for speed and efficiency in opening and closing market positions. Crafted with a clean and intuitive design, this tool is a response to the specific needs of traders, ensuring a seamless and rapid trading experience. All it provides is: Quick BUY and SELL Buttons Open multiple operations at the same time Set Trade Size Set Stop Loss Take Profit Points Close All Positions Let's go and see the advantages of using "Simple Trading
FREE

The Fisher Transform is a technical indicator created by John F. Ehlers that converts prices into a Gaussian normal distribution. The indicator highlights when prices have moved to an extreme, based on recent prices. This may help in spotting turning points in the price of an asset. It also helps show the trend and isolate the price waves within a trend. The Fisher Transform is a technical indicator that normalizes asset prices, thus making turning points in price clearer. Takeaways Turning poi
FREE
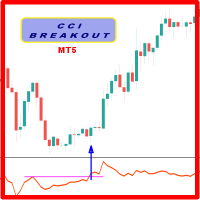
Probability emerges to record higher prices when oscillator breaks out oscillator historical resistance level when exhibit overbought values. Since, oscillator breakout of support and resistance have similar effect as price breaks support and resistance levels, therefore, its highly advised to confirm price breakout with oscillator breakout; certainly, will have the same output in short trades. Concept is based on find swing levels which based on number of bars by each side of peak or trough -
FREE

Seeing and interpreting a sequence of Candlesticks is easy to spot when you are a human... Higher Highs, Higher Lows, are the panorama of a Buying trend, at least in a short period of time... Seeing a current candlestick higher high and a lower candlestick low, as a human, you can immediately spot a "divergence", an "alert", a "starting range", but in the end and based on other analysis a human trader can understand and behave accordingly to this kind of candlestick data... But what about EAs (r
FREE

This indicator monitors the vital constants of your trading account to keep it healthy and away from excessive risks. It monitors all trades, absolute exposure, account floating point and leverage currently in use, using different color codes for your interpretation. [ Installation Guide | Update Guide | Troubleshooting | FAQ | All Products ] Amazingly easy to understand The indicator is clean and simple It calculates exposure by pairs and currencies Keep your used leverage controlled at all t
FREE

Este é um indicador de agressão comprador e vendedor que analisa o formato de cada vela e projeta esses dados em forma de histograma.
Há 4 histogramas em um só. Na parte frontal temos dois: Superior - força compradora Inferior - força vendedor Na parte de trás temos também dois histogramas, ambos da mesma cor. Eles medem a força conjunta dos compradores e vendedores. Esses histogramas podem ser desativados nos Parâmetros de Entrada. É possível também ter o volume real ou de tick para fazer essa
FREE

The SyntheticaFX Zones Indicator simplifies the process of identifying key levels in the market where price reversals are likely to occur. By incorporating this tool into their trading strategies, traders can improve their decision-making, enhance risk management, and ultimately increase their chances of success in the financial markets. However, like all technical indicators, it should be used in conjunction with other analysis methods and not relied upon as the sole basis for trading decisions
FREE

The strategy for this expert advisor works more effectively only if you set buy only or sell only,the most important part I took into consideration are the main market turning points.You would want to say reversals or change in direction in trends,the key to making profitable trades with this advisor is to set your stop loss on the previous high for sell only signal and previous low for buy positions ,This advisor can trade any Market,but mainly was developed for Boom and Crash,vix75 and Jump 25
FREE
A 'Seconds Period' chart, offering enhanced precision for charting and analysis. Especially beneficial during volatile market conditions and intraday trading. This indicator addresses the limitations of MT5's predefined timeframes, allowing for finer granularity down to second intervals.
Since only one EA can run per chart, being an Indicator allows for the additional advantage of running an EA alongside the Seconds Timeframe Candles Indicator on the same chart. Compatible with any intraday t
FREE

The SMTrendLine indicator is based on the principles of graphical construction of Bollinger bands.
Graphically, the Bollinger is two lines that limit the price dynamics from above and from below, respectively. These are a kind of support and resistance lines, which most of the time are located at levels far from the price.
As we know, the Bollinger bands are similar to the envelopes of moving averages. The difference between them is that the envelope boundaries are located above and below t
FREE

Whether you are a scalper or daily trader, you will always look for bullish / bearish engulfing candles. This can be a bit tricky and stressful when you try to visually identify the engulfing candles on the chart. Not only that, you might be trading on the M15 time frame but the engulfing candle is forming or has already formed in the H4 time frame. This indicator is made to do that on your behalf. You can trade on any time frame and see Engulfing candles of another time frame, this means that
FREE

Introducing the "Super Trend Filter Oscillator," your ultimate trading companion designed to enhance your technical analysis and help you make informed decisions in the financial markets. This innovative oscillator is crafted to provide valuable insights into market trends and price movements, assisting traders like you in identifying potential entry and exit points. Features: Trend Identification: The Super Trend Filter Oscillator excels in detecting prevailing market trends, whether they are b
FREE

Drawdown Monitor EA Risk management made easy. Balance and equity monitoring, closing positions, deleting orders, notifications by email and/or push on mt5-mobile.
Security for your Money or Prop Trading accounts. This Expert Advisor constantly monitors the account balance and equity. If the maximum daily drawdown is reached, all open positions will be closed, open orders will be deleted, a notification will be sent by email/push. In addition, the EA creates a global variable, which ensures t
FREE
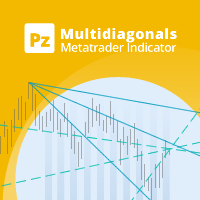
This indicator connects past price points drawing diagonals and trend lines, which converge in the future creating hidden reversal points. [ Installation Guide | Update Guide | Troubleshooting | FAQ | All Products ] Find hidden reversal points Spot convergence zones easily Dense criss-cross zones are reversal points Configurable amount of lines and price points Configurable colors
How to use the indicator The indicator draws several lines on the chart, and where many of these lines converge a
FREE

Hi All ! I want to share with you my favorite indicator to identify strong trend bias. It helps me a lot with my entries and exits. You can use it on any market and any instrument. It works best on daily tiimeframe 1D but you can also use it on 1H and be carefull with lower timeframes This indicator uses MACD, RSI and Stoch. The idea is simple, when MACD crosses above a Signal line and RSI > 50 and Stoch > 50 we consider the trend is going UP on the opposite we consider its DOWN Feel free to us
FREE

AliPivot Points is a Meta Trader 5 Indicator that draws you the latest pivot points. You can choose from timeframes ranging from 1 Minute to 1 Month. Calculation methods for pivot points includes: Classic Pivot Points Camarilla Pivot Points Fibonacci Pivot Points Woodie Pivot Points You can personalize the line colors, style, and width to suit your preference. The indicator displays values on the right side of the chart. AliPivot Points values can also be utilized by developers for creating Expe
FREE

This tool will remove buttons and text labels from the chart, after you remove Trading box Order management or Trading box Technical analysis .
You just need to drag this tool to your chart and after cleanup of objects is finished, the tool will remove itself from the chart.
Please check images below that present Before and After using the Removal tool.
There is also a short YouTube video at the bottom to show how easy it is to clean your chart after using Trading box tools.
- input var
FREE

The Advanced Pivot Point Indicator is a powerful tool designed to help traders identify key support and resistance levels in the market. This versatile indicator offers a customizable and user-friendly interface, allowing traders to select from five different pivot point calculation methods: Floor, Woodie, Camarilla, Tom DeMark, and Fibonacci. With its easy-to-read lines for pivot points (PP), support (S1, S2, S3, S4), and resistance (R1, R2, R3, R4) levels, the Advanced Pivot Point Indicator pr
FREE

Monte Carlo simulation is an Indicator that uses a Monte Carlo model to calculate the probability of the price going up or down. If the price has a probability of going up or down more than 90%, the system will enter a trade by doing a back test of gold assets. It was found that it was able to generate a return of more than 20% in a period of 5 months while having a MAX DD of less than 7%.
What is a Monte Carlo simulation?
A Monte Carlo simulation is a model used to predict the probability o
FREE

This indicator uses a different approach from the previous version to get it's trendlines. This method is derived from Orchard Forex, and the process of making the indicator is demonstrated in there video https://www.youtube.com/watch?v=mEaiurw56wY&t=1425s .
The basic idea behind this indicator is it draws a tangent line on the highest levels and lowest levels of the bars used for calculation, while ensuring that the lines don't intersect with the bars in review (alittle confusing? I kno
FREE

The "Moving Average Range Painter" is a robust MetaTrader 5 (MT5) indicator meticulously crafted to illustrate the fluctuating range between an exponential moving average (EMA) and a simple moving average (SMA) on any financial chart. This tool offers traders a comprehensive visual depiction of the price range within which an asset is oscillating. Here's a succinct interpretation of what this range signifies for technical analysis: Trend Dynamics : The range delineated by the EMA and SMA unveils
FREE

GiGa FX is designed to work on EURUSD Subscribe to our new channel for promo/FREE and updates! : https://www.mql5.com/it/channels/genkidamasolutions Subscribe to profile to get new announcements and look behind the scenes! https://www.mql5.com/en/users/asodoco Please support us to building FREE EAs! Leave a review ! Thank you
Recommendations
Timeframe: H1 Symbol: EURUSD An Ecn broker is always recommended A low latency vps is always recommended. The recommended Leverage a
FREE

Expected Range is a great tool for understanding the possible price deviation from daily open price.
This Indicator can be interpreted as follows --> I want to identify a price level with an "x%" probability of the price revisiting it.
Then you choose these "x%" price levels and the indicator is gonna find them for you.
So for example, if you select value of 15, it means that the indicator is gonna find you a price level which has a 15% chance of price revisiting it.
You can choose up
FREE

BEETLEJUICE IS NOW FREE FOR ALL COMMUNITY MEMBERS!!! EXPERIENCE THE AWESOME PERFORMANCE WITHOUT COMING OUT OF POCKET!! Introducing the 'Beetlejuice' EA: a powerhouse in the forex trading arena, meticulously crafted for the EURGBP H1 chart. This expert advisor embodies precision, profitability, and unparalleled performance, making it a must-have tool for serious traders. Key Features: Astounding Profitability: The 'Beetlejuice' EA has turned a modest $3,000 starting balance into a staggering $70,
FREE

The "SyntheticaFX Power Indicator" is an exceptional trading tool designed to offer valuable insights into market strength and potential changes, without revealing its proprietary methodology. This powerful indicator is ideally utilized in conjunction with our specialized tools, the " SyntheticaFX CrashSlayer and " BoomSlayer " Spike Indicators, to provide traders and investors with a comprehensive and dynamic trading experience. When employed alongside our SyntheticaFX CrashSlayer and BoomSlaye
FREE

Máxima e Mínima de Candles
Indicador que mostra a Máxima e Mínima de X candles através de uma linha.
Configurações Números de Candles para o cálculo - Definir a quantidade de candles para o indicador achar a máxima e a mínima daquele período de candles. Continuação da Linha até a margem direita - Se você deseja que a linha da Máxima e Mínima se estenda até a margem direita do gráfico Cor da Linha de Máxima - Definir a cor da linha de máxima Style da linha de Máxima - Definir o estilo da linha
FREE

Introducing Market Maven FX – The Comprehensive Trading Solution for GBP/USD H1 Unlock the potential of your Forex trading with Market Maven FX, a cutting-edge expert advisor designed specifically for the GBP/USD H1 chart. With an ensemble of 16 sophisticated strategies, Market Maven FX meticulously monitors the market dynamics, ensuring trades are executed with precision and strategic insight. Key Performance Metrics: Total Net Profit: $28,593.77, showcasing robust profitability in a challengin
FREE

The advisor NewsCatcher Free opens trades when the price makes a reversal move from support and resistance levels. Market entries should be confirmed by the Relative Strength Index (RSI). The RSI is implemented as a tachometer. It is recommended to use this advisor in a highly volatile market after a political event or a release of major economic data.
You can use this advisor in the semi-automated mode (the RSI performs an information role) or in the fully automated mode (the RSI decides when
FREE

ClickDrag desenha linhas e move objectos no gráfico facilmente.
Clique e depois Drag para começar a desenhar uma linha de tendência.
Movendo o rato na horizontal, desenha uma linha de preço.
Movendo o rato na vertical, desenha uma linha de data.
As linhas e objectos existentes podem ser movidos pela Click&Drag.
Mostra o preço e a diferença de tempo entre o ponto inicial e o ponto final.
Após o ponto inicial Click&Drag,
Sacudir a esquerda e a direita para mudar a cor.
FREE

Индикатор PivotPointSuperTrend отлично показывает данные Тренд на основе мат данных от Pivot и ATR и очень удобен для входа в сделку и выставления стопов. Если кто то сможет добавить в код мултитаймфрем, я и многие пользователи будут очень Благодарны, то есть чтобы ондикатор показывал значение старшего таймафрема на графике младшего таймфрема, Заранее Спасибо!
FREE
O Mercado MetaTrader é um site simples e prático, onde os desenvolvedores podem vender seus aplicativos de negociação.
Nós iremos ajudá-lo a postar e explicar como descrever o seu produto para o mercado. Todos os aplicativos no Mercado são protegidos por criptografia e somente podem ser executados no computador de um comprador. Cópia ilegal é impossível.
Você está perdendo oportunidades de negociação:
- Aplicativos de negociação gratuitos
- 8 000+ sinais para cópia
- Notícias econômicas para análise dos mercados financeiros
Registro
Login
Se você não tem uma conta, por favor registre-se
Para login e uso do site MQL5.com, você deve ativar o uso de cookies.
Ative esta opção no seu navegador, caso contrário você não poderá fazer login.