Conheça o Mercado MQL5 no YouTube, assista aos vídeos tutoriais
Como comprar um robô de negociação ou indicador?
Execute seu EA na
hospedagem virtual
hospedagem virtual
Teste indicadores/robôs de negociação antes de comprá-los
Quer ganhar dinheiro no Mercado?
Como apresentar um produto para o consumidor final?
Pagamento de Indicadores Técnicos para MetaTrader 4 - 13

WaveTrend Momentum Oscillator is an upgrade to the popular and easy-to-use WaveTrend Oscillator. The WaveTrend Momentum Oscillator adds a momentum component to the original WaveTrend calculation, in order to provide faster and more accurate entry points during trendy market conditions. Do you prefer the original WaveTrend Oscillator? The WaveTrend Momentum Oscillator allows you to switch between momentum and original WT versions. Both provide valuable information depending on the market conditio
Hello dear friend! Here's my story. I'm fast. After many attempts to trade manually, I decided to use expert. I started writing my robot. But testing took a lot of time! In parallel, I tried other people's robots. And again I spent a lot of time testing. Night scalpers, news scalpers, intraday scalpers, and many other classes... you needed to know exactly when the robot was trading, when it was making a profit, and when it Was losing. Some robots have time-based trading features that are not de

MultiCurrencyWPR (MCWPR) indicator applies conventional WPR formula to plain Forex currencies (that is their pure strengths extracted from Forex pairs), market indices, CFDs and other groups of tickers. It uses built-in instance of CCFpExtraValue to calculate relative strengths of selected tickers. Unlike standard WPR calculated for specific symbol, this indicator provides a global view of selected part of market and explains which instruments demonstrate maximal gain at the moment. It allows yo
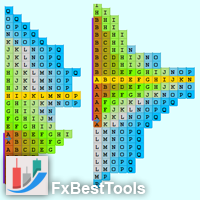
Definition : A Market Profile is an intra-day charting technique (price vertical, time/activity horizontal). Market Profile is best understood as a way to see order in the markets. Market Profile was a way for traders to get a better understanding of what was going on, without having to be on the trading floor. The current indicator is developed based on Easy-to-Use architecture including a wide range of visual settings.
Major Features of Indicator : Various Views of Market Profile The indica

Currency Power Meter shows the power of major currencies against each other. The indicator shows the relative strength of currency/pair at the current moment in a period of time (H4, daily, weekly, monthly). It is useful for day traders, swing traders and position traders with suitable period options. Currency power is the true reason of market trend: The strongest currency against the weakest currency will combine into a most trending pair. As we know, trend makes money and all traders love tre

"Trend reversal ml4" is a unique indicator designed to determine the moments of price reversal in real time. This is a ready-made trading system for Metatrader4. The indicator does not redraw its values! Based on advanced algorithms and technical analysis, this indicator provides you with clear signals about possible market entry and exit points, helping you make informed decisions.
Advantages of the indicator: high signal accuracy. the indicator itself shows the trader whether it is configur

A Real Trade negocia em prazos inferiores a 1 hora. Negocie em tendências de alta e direções de tendência de baixa. Negocie com as direções de tendência de tempo mais altas e negocie a primeira vela. Use o oposto para sair ou use a proporção para sair de 1:1 ou superior junto com paradas finais. Negocie tendências reais durante horas ativas e com direção de tendência mais alta para obter os melhores resultados. Indicador de carga no testador para estudar os resultados e potencial. Use as setas

Advanced Currency Strength Indicator
The Advanced Divergence Currency Strength Indicator. Not only it breaks down all 28 forex currency pairs and calculates the strength of individual currencies across all timeframes , but, You'll be analyzing the WHOLE forex market in 1 window (In just 1 minute) . This indicator is very powerful because it reveals the true movements of the market. It is highly recommended to analyze charts knowing the performance of individual currencies or

Apresentando o Auto Trendline, o inovador indicador MT4 que automatiza o processo de
desenho de linhas de tendência em seus gráficos. Diga adeus à tarefa tediosa e demorada de desenhar linhas de tendência manualmente
e deixe o Auto Trendline fazer o trabalho para você!
*Entre em contato comigo após a compra para enviar instruções e guia passo a passo.
Com seu algoritmo avançado, o Auto Trendline detecta e desenha automaticamente linhas de tendência para você,
economizando tempo e e

Modificação multimoeda e multitimeframe do indicador Fractals. Exibe os dois últimos fractais — sua sequência (e qual está quebrada) ou a distância entre eles. Você pode especificar quaisquer moedas e prazos desejados nos parâmetros. Além disso, o painel pode enviar notificações sobre o rompimento de um fractal. Ao clicar em uma célula com ponto final, este símbolo e ponto final serão abertos. Este é o scanner MTF.
A chave para ocultar o painel do gráfico é “D” por padrão.
Parâmetros Cal

VR Sync Charts é uma utilidade para sincronizar o layout entre as janelas. Com ajuda de VR Sync Charts Vossos níveis de tendência, níveis horizontais, e marcação Fibonachi serão sincronizados com todos os gráficos. Esta utilidade permite sincronizar todos os objectos padrão gráficos no terminal MetaTrader, todas vossas tendências, linhas de Gunn e outros objectos serão copiados com precisão para os gráficos adjacentes. Você não precisa mais copiar manualmente suas linhas reguladas e marcações. A

1. Compound Drawings (1) Line segment with arrow (2) Continuous line segment (broken line) (3) Parallelogram (4) Polygon (5) Profit and loss ratio measurement tools
2. Backtracking By the Z key in the process of drawing the line Line types that support Z-key backtracking: continuous line segments (broken line) ,channels,parallelograms,polygons, and fibo extensions.
3.Automatic Adsorption (1) Click the "Lock-Button" to switch the automatic adsorption switch before drawing the line (2)

This is first public release of detector code entitled "Enhanced Instantaneous Cycle Period" for PSv4.0 I built many months ago. Be forewarned, this is not an indicator, this is a detector to be used by ADVANCED developers to build futuristic indicators in Pine. The origins of this script come from a document by Dr . John Ehlers entitled "SIGNAL ANALYSIS CONCEPTS". You may find this using the NSA's reverse search engine "goggles", as I call it. John Ehlers' MESA used this measurement to
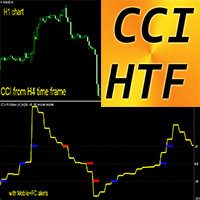
Indicador Forex Oscilador CCI HTF para MT4
Atualize seus métodos de negociação com o oscilador CCI HTF profissional para MT4. HTF significa - Prazo Maior O Commodity Channel Index (CCI) mede a diferença entre o preço atual e o preço médio histórico Níveis importantes: +/-200, +/-100 É ótimo receber entradas de venda acima da zona +200 e entradas de compra abaixo de -200 Este indicador é excelente para sistemas de negociação Multi-Time Frame com entradas de Price Action ou em combinação com ou

Scanner and Dashboard for Cycle Sniper ATR Fibo Channels Indicator
As users know indicator draws Fibonacci Channels and arrows according to the user's settings.
With CS ATR Fibo Channels Scanner, you will have the ability to watch the market.
- Multi Timeframe - Multi Instrument
Enter your parameters to watch (as explained in Cycle Sniper ATR Fibo Channels Indicator )
- If you cho0se "Arrows by ATR Levels" , you will receive the potential reversal arrrows. - If you choose "Arrows by M

The Fair Value Gap (FVG) is a price range where one side of the market liquidity is offered, typically confirmed by a liquidity void on the lower time frame charts in the same price range. Price can "gap" to create a literal vacuum in trading, resulting in an actual price gap. Fair Value Gaps are most commonly used by price action traders to identify inefficiencies or imbalances in the market, indicating that buying and selling are not equal. If you're following the ICT Trading Strategy or Smart

O indicador "Two Moving Average Crossover" para MetaTrader 4 (MT4 é uma ferramenta de análise técnica que apresenta duas médias móveis e notifica quando as médias móveis se cruzam. O indicador calcula e traça duas médias móveis, uma das quais é mais rápida e a outra é mais lenta. Quando a média móvel mais rápida se cruza acima da média móvel mais lenta, é considerada um sinal de alta, indicando uma potencial inversão de tendência ou o início de uma nova tendência de alta. Pelo contrário, quando
Localizador de perda de carga idealA utilização de técnicas de paragem populares regulares, como as perdas de paragem fixas ou a sua colocação abaixo de máximos e mínimos anteriores, são desvantajosas por uma série de razões:1. Os corretores já conhecem estas áreas, pelo que é fácil para eles levá-las a cabo 2. Não se pode realmente usar sempre uma paragem fixa com um mercado, uma vez que pode tornar-se realmente largo ou muito fino em alturas diferentes, e ou se está a tirar menos do mercado ou
O indicador TP Optimal Trailing TP pode funcionar tanto como uma ferramenta de entrada como uma ferramenta de rastreio de lucros. O seu desenho único permite-lhe fornecer sinais de compra e venda. Se já estiver numa posição, pode ignorar as setas de sinal. Se não estiver numa posição, as setas podem alertá-lo para um movimento nessa direcção no período de tempo ou par de moedas em que o indicador está definido. Assim, pode usar as setas de sinal para entrar e sair na seta oposta, ou pode usar os
O indicador MTF Optimal Trailing TP funciona exactamente como o indicador Optimal Trailing Toyota, mas imprime sinais como barras em vez de como setas e imprime durante dois períodos de tempo diferentes ao mesmo tempo.
Pode servir tanto como ferramenta de entrada como de obtenção de lucro. Utilizamo-lo tanto como uma ferramenta de entrada como uma ferramenta de obtenção de lucro.
A melhor maneira de o utilizar é a seguinte:
Encontrar um movimento de tempo mais elevado utilizando o Painel d
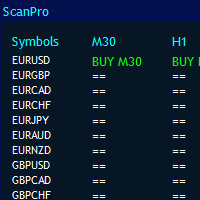
O Universal Panel pro foi projetado para todos os indicadores e prazos, incluindo arquivos ex4.
Ele pode fazer a varredura de pares ilimitados com base na potência do seu computador e em até 10 períodos de tempo. O tamanho do painel será organizado automaticamente.
você pode chamar qualquer indicador por buffers.
Funciona com todos os indicadores padrão e personalizados. Você pode simplesmente usá-lo para heikan ashi, rsi, parabólico, renko, fractais, resistência de suporte, demanda d

Indicador equipado com um sistema de cálculo de taxa de vitória [Recursos do Indicador] Este indicador permite que você confirme de forma intuitiva e fácil análises técnicas regulares com sinais de sinais. Além disso, pode verificar a taxa de vitória dos parâmetros atuais e inclui um sistema automático de determinação da taxa de vitória que evita dar sinais quando a taxa de vitória é baixa. Isso reduz entradas desnecessárias e permite que você entre em negociações somente quando a taxa de gan

DAYTRADING apenas para AÇÕES (CFD's).
Negociar dá trabalho. Não há atalhos ou indicadores que dirão todas as entradas e saídas. O lucro vem do estado de espírito. Os indicadores são ferramentas a serem usadas em conjunto com a gestão do dinheiro e a psicologia do sucesso. Encontre desequilíbrios no perfil de volume. Desequilíbrios de volume de preços de comércio.
Muitos desequilíbrios acontecem no fechamento e na abertura e nas notícias. Veja os compradores versus vendedores em ações. Use e
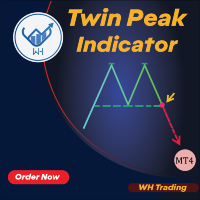
Bem-vindo ao Twin Peak Indicator MT4 --(Double Top/Bottom)-- O Double Top and Bottom Indicator é uma ferramenta de análise técnica projetada para identificar possíveis padrões de reversão no mercado.
Ele identifica áreas onde o preço fez dois picos ou depressões consecutivos de altura quase igual, seguido por um movimento de preço na direção oposta.
Esse padrão indica que o mercado está perdendo força e pode estar pronto para uma reversão de tendência.
Características:
Anotações autom
TrendLines Plator: Potencialize suas Estratégias de Negociação com um Indicador Avançado de Projeção de Tendências Explore o potencial do nosso indicador inovador! Com a habilidade de analisar e projetar linhas de tendência de prazos mais amplos diretamente no seu período de tempo atual, ele oferece um suporte estratégico que chama a atenção de traders em geral. Esses pontos se transformam em níveis estratégicos de suporte ou resistência para suas operações, fortalecendo sua estratégia de negoci

Este indicador baseia-se na experiência prática.
Insira a data/hora do seu topo/base.
Calcula o nível mais visitado desde o topo/base até ao momento atual.
Actualiza-se automaticamente a cada nova vela. Pode utilizar simultaneamente vários indicadores para diferentes tendências e períodos de tempo.
O comprimento é sempre traçado desde o início do seu período até ao presente.
Ferramenta PRO útil.

Description
The base of this indicator is an ZigZag algorithm based on ATR and Fibo retracement. The ZigZag can be drawn like a classic ZigZag or like Arrows or needn't be drawn at all. This indicator is not redrawing in sense that the ZigZag's last shoulder is formed right after the appropriate conditions occur on the market. The shoulder doesn't change its direction afterwards (can only continue). There are some other possibilities to show advanced information in this indicator: Auto Fibo on

Junte-se à negociação com o indicador WolfeWaveBuilder! Esta é uma ferramenta única criada especificamente para obter as decisões de investimento mais bem-sucedidas e lucrativas. É ideal para contas ativas e se beneficia de uma estratégia de negociação totalmente testada e praticamente garantida. Não perca sua oportunidade! Comece a ganhar dinheiro negociando com o indicador WolfeWaveBuilder!
Versão MT5 https://www.mql5.com/ru/market/product/82360
Características do Indicador
Dá sin

Este é um indicador MTF dos níveis de suporte e resistência com base nos extremos do indicador Advanced ZigZag Dynamic e / ou Extended Fractals com etiquetas de preço (pode ser desativado). TFs mais altos podem ser selecionados para o modo MTF. Por padrão, os níveis são gerados com base nos pontos do indicador ZigZag. Os pontos indicadores fractais também podem ser usados em conjunto com o ZigZag ou em vez dele. Para simplificar o uso e economizar tempo de CPU, o cálculo é realizado uma

Indicador de oferta e demanda real - permitirá que você determine rapidamente a localização dos níveis de resistência e suporte em todos os prazos. O indicador será útil para quem usa análise técnica em suas negociações. O indicador é fácil de usar, basta arrastar e soltar no gráfico e o indicador mostrará os níveis de suporte e resistência mais prováveis. Ao alternar os prazos, você verá os níveis para o período de tempo recém-selecionado.
Robot Scalper Recomendado - teste

CHART OBJECTS: Blue box : Bullish Order Blocks (OB) Red box : Bearish OB Orange box : Mitigated OB. Price bounce from this area the made a new high/low Light gray box : Price bounced from this area but did not made a new high/low Dark gray box : Broken OB. Filled boxes : TimeFrame 1 Order Blocks
Unfilled boxes : TimeFrame 2 Order Blocks
INDICATOR SETTINGS: Order Block Required Length: Required number of subsequent candles in the same direction to identify Order Block. Default value: 5 Im

O indicador " Moving Average Crossover Dashboard " é uma ferramenta técnica que exibe os cruzamentos de 2 médias móveis selecionadas no gráfico de preços, indicando se é um cruzamento de alta ou de baixa. Além disso, como o próprio nome indica, mostra um painel de sinais que indica em qual mercado e período ocorre o cruzamento das duas médias móveis. Na janela de configuração o usuário pode selecionar os mercados e prazos que podem ser exibidos no painel. Você também tem a opção de ativar uma j
Candlestick Patterns All Pair is a simple and convenient indicator of candlestick pattens. It is able to identify 29 candlestick patterns. It displays the latest patterns for all pairs and timeframes.
The considerable advantages of the indicator It finds and marks 29 candlestick patterns; Displays a table of the last patterns for the 28 major pairs and each timeframe; It has settings for 5 extra pairs; Indicates the classic trade direction; Each candlestick patterns can be disabled in the sett
O exército de cães militares irá ajudá-lo a identificar pontos de entrada para o processamento Indiano. Ele trabalha para todos os perigos. Você pode abrir os níveis de ADR a partir das configurações, fazendo duplo-click sobre a estratégia. Se você desligar o recurso ADR, ele vai encontrar mais transações.
Em particular, além de sua própria estratégia, ele permite que você passe suas entradas de processamento através de um filtro de melhor qualidade.
Quer que o nível ADR medire um determina

Este indicador de multi-quadro de tempo e multi-símbolo identifica quando a linha de sinal do stochastics cruza a linha principal do stochastics. Como um bônus, ele também pode procurar bandas de Bollinger e cruzamentos de sobrecompra / sobrevenda RSI. Combinado com suas próprias regras e técnicas, este indicador permitirá que você crie (ou aprimore) seu próprio sistema poderoso. Recursos Pode monitorar todos os símbolos visíveis na janela Market Watch ao mesmo tempo. Aplique o indicador a apena

ADX arrow
Este indicador mostra os sinais do indicador ADX (índice médio de movimento direccional) como pontos no gráfico.
Isto facilita a identificação visual dos sinais. O indicador também apresenta alertas (caixas de mensagens pop-up) empurrar e enviar sinais para o e-mail.
Parametro Período médio. Aplicar ao preço utilizado para os cálculos: Próximo, Aberto, Alto, Baixo, mediana(alto+baixo)/2, típico (alto+baixo+perto)/3, próximo ponderado (alto+baixo+perto+perto) / 4. Alerta-Acti

The ICT Unicorn Model indicator highlights the presence of "unicorn" patterns on the user's chart which is derived from the lectures of "The Inner Circle Trader" (ICT) .
Detected patterns are followed by targets with a distance controlled by the user.
USAGE (image 2) At its core, the ICT Unicorn Model relies on two popular concepts, Fair Value Gaps and Breaker Blocks. This combination highlights a future area of support/resistance.
A Bullish Unicorn Pattern consists ou

Ultimate Consecutive Bar Scanner (Multi Pair And Multi Time Frame) : ---LIMITED TIME OFFER: NEXT 25 CLIENTS ONLY ---46% OFF REGULAR PRICE AND 2 FREE BONUSES ---SEE BELOW FOR FULL DETAILS Unlike the equity markets which tend to trend for years at a time, the forex market is a stationary time series.
Therefore, when prices become severely over extended, it is only a matter of time before they make a retracement.
And eventually a reversal. This is a critical market dynamic that the institution

Ultimate Divergence Scanner (Multi Pair And Multi Time Frame) : ---LIMITED TIME OFFER: NEXT 25 CLIENTS ONLY ---46% OFF REGULAR PRICE AND 2 FREE BONUSES ---SEE BELOW FOR FULL DETAILS It is a widely known market principle that momentum generally precedes price.
Making divergence patterns a clear indication that price and momentum are not in agreement.
Divergence patterns are widely used by institutional traders around the world. As they allow you to manage
your trades within strictly de

Ultimate Moving Average Scanner (Multi Pair And Multi Time Frame) : ---LIMITED TIME OFFER: NEXT 25 CLIENTS ONLY ---46% OFF REGULAR PRICE AND 2 FREE BONUSES ---SEE BELOW FOR FULL DETAILS Institutional traders use moving averages more than any other indicator. As moving averages offer a quick
and clear indication of the different phases of a trend. Such as expansion, pullback, consolidation and reversal.
And viewing the market through the same lens as the institutions is a critical part

Ultimate Range Trade Scanner (Multi Pair And Multi Time Frame) : ---LIMITED TIME OFFER: NEXT 25 CLIENTS ONLY ---46% OFF REGULAR PRICE AND 2 FREE BONUSES ---SEE BELOW FOR FULL DETAILS The FX market is range bound at least 70% of the time. And many of the largest institutions
in the world focus on range trading. Such as BlackRock and Vanguard , who have a combined
$15 TRILLION under management.
Range trading has several distinct advantages that make it safer and more predictable
than

Algorithmic Signals indicator is not an indicator but a strategy that generates entry/exit signals. The entry arrows are formed after multiple conditions are met. The indicator is using an Adaptive Algorithm which automatically adjust to the symbol and time frame (see the screenshots below) . Signals can be used for scalping or even trend trading. Main features:- Non repainting signals Entry signals Exit signals Alert for price reaching 1 x ATR(14) (could be utilized for initial take prof

Информационный индикатор, показывающий самые важные торговые уровни для внутридневной торговли, и не только. О понятии уровней «Поддержка» и «Сопротивление».
Всем известно, что исторический ценовой диапазон цен состоит из уровней от которых в прошлом, были значимые движения.
И уровни работающие в прошлом, наверняка будут работать и сейчас. К примеру, уровень, находящийся снизу текущей цены
является уровнем «Поддержки», если от него ранее было значительное движение. К примеру, уровень,

This is a multi-currency author strategy, designed for trading on the M1, M5, M15, М30, Н1, Н4. Entry points are calculated using custom formulas and algorithms that allow you to effectively determine current trend in the market, obtain the entry points (buy/sell) and the optimal levels to close orders. The Cosmic Diviner Scalper System indicator can be used on any Forex pairs. The detailed guide on how to use the indicator is provided in the blog: https://www.mql5.com/en/blogs/post/719602 A hug
The Magic Histogram indicator is a universal tool, suitable for scalping and medium-term trading. This indicator uses an innovative formula and allows you to determine the direction and strength of the trend. Magic Histogram is not redrawn, so you can evaluate its efficiency using history data. It is most suitable for M5, M15, M30, H1 and H4. Version for the MetaTrader 5 terminal : https://www.mql5.com/en/market/product/58448
Indicator Benefits Excellent indicator signals! Suitable for beginn

Apresentando o Sr. Fibonacci , um indicador incrível projetado para simplificar o processo de desenhar e ajustar os níveis de Fibonacci em seu gráfico. Este indicador oferece opções excepcionais de personalização para traders profissionais, permitindo que eles desenhem qualquer nível de Fibonacci com precisão. Além disso, ele fornece notificações móveis, alertas por e-mail e alertas pop-up quando o preço entra nos níveis de Fibonacci, garantindo que você nunca perca oportunidades de negociaç
User Manual For more information pm me SL Currency28 Pair Dashboard is even used by the Banks to make profits. They take a strong currency and pitch against a weak currency This strategy i am made my other indicator SL Currency Strength Meter 28 Pair more improvement We can easily study the financial strength of multi-faceted trading SL Currency28 Pair Dashboard strength meter which creates multiple charts in a single window based on the price action of each currency in relation to
Download the free version here.
A Full Concept of BUY/SELL Scalping Strategy Trend detection is one of the basic challenges of every trader. Finding a way to tell when to enter a trade is very important, timing is a game changer, not too early and not too late. Sometimes, due to not knowing the market conditions, the trader closes his positions with a small profit or allows the losses to grow, these are the mistakes that novice traders make. Indicator Trend Whipper is a complete trading st
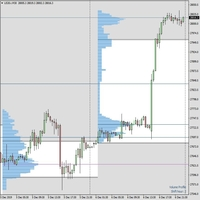
The indicator is fully working. If you want to try it or buy it please get in touch by email first tracktheworld2@gmail.com or via MQL message service. Once you have bought I will send you also a free guide and free resources on how to trade with Market Profile. This indicator is working like in the pictures, 100%. With me you have prime customer service. You are never left alone. I will send you via email the fully working indicator with PDF on how to trade with Market Profile. Fully refu

RiverScope automatically determines the nearest most important price levels and support and resistance zones in history, it also identifies a large number of price action patterns (30+). The support and resistance levels are determined based on an algorithm that calculates and filters the historical values of the price, its movement character, volumes, etc. It displays the current situation, therefore the nearest levels change in real time depending on the current price.
Advantages flexible cu

Bem-vindo ao meu indicador de medidor de moeda
Introdução simples:
Este indicador pode ajudá-lo a ver o poder de cada moeda separadamente.
Como você sabe, quando o GBPUSD sobe, significa que o GBP vai para mais potência ou o USD fica mais fraco, mas você não consegue entender qual é o motivo desse movimento, foi sobre o GBP? ou era sobre USD?
Para determinar o poder do GBP, este indicador irá verificar se todos os pares contêm GBP e determinar seus movimentos e, finalmente, calcular o poder
Accelerator Oscillator by Bill Williams with the ability to fine-tune and replace the averaging algorithms of the indicator, which significantly expands the possibilities of using this oscillator in algorithmic trading and brings it closer in its properties to such an indicator as MACD.
To reduce price noise, the final indicator is processed with an additional Smooth averaging. The indicator has the ability to give alerts, send mail messages and push signals when the direction of movement of

To get access to MT5 version please click here . - This is a conversion from TradingView: "Hull Suite" By "Insilico". - This is a light-load processing and non-repaint indicator. - You can message in private chat for further changes you need. note: Color filled areas and colored candles are not supported in MT4 version. Here is the source code of a simple Expert Advisor operating based on signals from Hull Suite . #property strict input string EA_Setting= "" ; input int magic_number= 1234 ; inp

To get access to MT5 version please click here . - This is the exact conversion from TradingView: "Stochastic Momentum Index" By "UCSgears". - This is a popular version of stochastic oscillator on tradingview. - This is a light-load processing and non-repaint indicator. - Buffers are available for the lines on chart. - You can message in private chat for further changes you need. Thanks for downloading

PLEASE NOTE: You can customize the settings of all 3 EMA as per your requirement. The accuracy will change as per your settings.
100% Non repaint Pre-alert (get ready) signals Non-delay indications 24/7 signals 100% No lag No recalculating Lifetime license This is a EMA crossover indicator and its 100% non repaint indicator. The EMA_1 and the EMA_2 is based on which signal is generated. EMA_3 is a Higher EMA value which will remain below or above the candle (market) to identify the trend. M
Description:
This indicator (with its Fibonacci algorithm) marks Buy and Sell zones, which indicate where a trend has a higher probability of continuing either upward, or downward.
Additionally, there are horizontal lines drawn for each day, which show a high probability level of where price is likely to break out, and continue either higher, or lower. This indicator will never repaint.
Features: The main strength of this indicator is that the user is able to visually assess what the
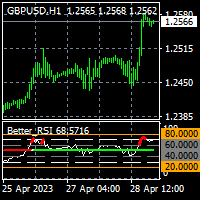
To get access to MT5 version please contact via private message. This is the exact conversion from TradingView: " Better RSI with bullish / bearish market cycle indicator" by TradeCalmly.
This is a light-load processing and non-repaint indicator. All input options are available. Buffers are available for processing in EAs. You can message in private chat for further changes you need.
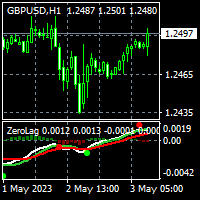
To get access to MT5 version please click here . This is the exact conversion from TradingView: "Zero Lag MACD Enhanced - Version 1.2" by " Albert.Callisto ". This is a light-load processing and non-repaint indicator. All input options are available. Buffers are available for processing in EAs. You can message in private chat for further changes you need. Thanks
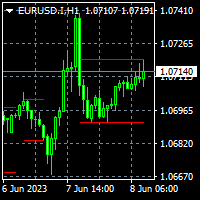
To get access to MT5 version please contact via private message. This indicator is not a standard indicator and you may get into trouble installing it. Please contact via private chat if you face trouble. This is exact conversion from TradingView: "Consolidation Zones - Live" by "LonesomeTheBlue". This is a light-load processing indicator. Updates are available only upon candle closure. Buffers are available for processing in EAs. It is a repaint indicator. So previous buffer values do not repre
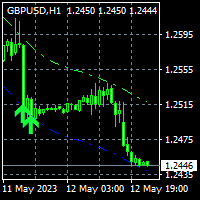
To get access to MT5 version please contact via private message. This is the exact conversion from TradingView:Nadaraya-Watson Envelope" by " LuxAlgo ". This is not a light-load processing indicator. It is a REPAINT indicator. All input options are available. Buffers are available for processing in EAs. You can message in private chat for further changes you need. Thanks.
To get access to MT5 version please click here . This is the exact conversion from TradingView:"HIGH AND LOW Optimized Trend TrackerHL OTT" by "kivancozbilgic" This is a light-load processing indicator. It is a non-repaint indicator. Colored Candle and Highlighting options are not available. Buffers are available for processing in EAs. You can message in private chat for further changes you need. Thanks.

To get access to MT5 version please click here . This is the exact conversion from TradingView: "[SHK] Schaff Trend Cycle (STC)" by "shayankm". This is a light-load processing indicator. This is a non-repaint indicator. Buffers are available for processing in EAs. All input fields are available. You can message in private chat for further changes you need. Thanks for downloading
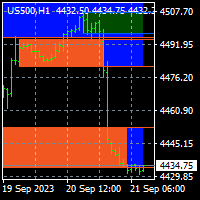
To get access to MT5 version please create personal order. This is the exact conversion from TradingView: Order Blocks & Breaker Blocks [LuxAlgo] This is a light-load processing and repaint indicator. All input options are available. This is not a multi time frame indicator. Buffers are available for processing in EAs. You can message in private chat for further changes you need.

To get access to MT5 version please click here . Also you can check this link . This is the exact conversion from TradingView: "UT Bot" by "Yo_adriiiiaan". This is a light-load processing indicator. This is a non-repaint indicator. Buffers are available for processing in EAs. All input fields are available. You can message in private chat for further changes you need. Thanks for downloading
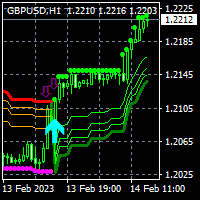
To get access to MT5 version please click here . This is the exact conversion from TradingView: "SwingArm ATR Trend Indicator" by " vsnfnd ". Also known as : "Blackflag FTS" by "Jose Azcarate" This is a light-load processing and non-repaint indicator. All input options are available except multi time frame Buffers are available for processing in EAs. Extra option to show buy and sell signal alerts. You can message in private chat for further changes you need.

Renko Trade Alarm is designed to work on chart with Renko and Mean Renko candles. It generate B uy and S ell signals on the chart and send notifications. Visualization of signals: Swing - Formations 123. Pattern - Double Bottom, Double Top, Triple Bottom, Triple Top, Formations 123 Reverse. Scalp - Periodic change in the price direction, plus additional filters in the form of oscillators Stochastic and MACD. Ichi - Signals filtered by the Ichimoku indicator. For correct operation an offl

OB Breakout is alert indicator that identifies when a trend or price move is approaching exhaustion(Supply and Demand) and ready to reverse. It alerts you to changes in market movement which typically occur when a reversal or major pullbacks are about to or have happened. The indicator identifies breakouts and price momentum initially, every time a new high or low is formed near a possible Supply or Demand level point. The indicator draws in a rectangle on Supply or Demand Zones. Once price we

The principle of this indicator is very simple: detecting the trend with Moving Average, then monitoring the return point of graph by using the crossing of Stochastic Oscillator and finally predicting BUY and SELL signal with arrows, alerts and notifications. The parameters are fixed and automatically calculated on each time frame. Example: If you install indicator on EURUSD, timeframe M5: the indicator will detect the main trend with the Moving Average on this timeframe (for example the Moving

This is a well-known ZigZag indicator. But it differs by the fact that its plot is based on values of the middle line which is set by a user. It can display Andrews’ Pitchfork and standard or Bobokus Fibo levels. NO REPAINTING.
Parameters Period МА — middle line period. Default value is 34. Minimum value is 4. Maximum value is set at your discretion. Used to calculate price - base price to calculate the middle line. The averaging method - method of smoothing the middle line. Turning pitchfork

The dashboard should help to get a quick overview of the correlations of different assets to each other. For this, the value series are compared according to the Pearson method. The result is the value of the correlation (in percent). With the new single asset mode, you can immediately see which symbols have the highest positive or negative correlation. This prevents you from accidentally taking a risk on your trades with highly correlated symbols. Usage
There are different methods for the cor
O Mercado MetaTrader contém robôs de negociação e indicadores técnicos para traders, disponíveis diretamente no terminal.
O sistema de pagamento MQL5.community está disponível para todos os usuários registrados do site do MQL5.com para transações em todos os Serviços MetaTrader. Você pode depositar e sacar dinheiro usando WebMoney, PayPal ou um cartão de banco.
Você está perdendo oportunidades de negociação:
- Aplicativos de negociação gratuitos
- 8 000+ sinais para cópia
- Notícias econômicas para análise dos mercados financeiros
Registro
Login
Se você não tem uma conta, por favor registre-se
Para login e uso do site MQL5.com, você deve ativar o uso de cookies.
Ative esta opção no seu navegador, caso contrário você não poderá fazer login.