Conheça o Mercado MQL5 no YouTube, assista aos vídeos tutoriais
Como comprar um robô de negociação ou indicador?
Execute seu EA na
hospedagem virtual
hospedagem virtual
Teste indicadores/robôs de negociação antes de comprá-los
Quer ganhar dinheiro no Mercado?
Como apresentar um produto para o consumidor final?
Indicadores Técnicos para MetaTrader 4 - 99

This indicator just display a single base line. Calculation is just simple base on DOW Theory. user can custom color of the line and can display "Buy" and "Sell" for the signal. This indicator can detect swings in the direction of the trend and also reversal swings. it is very easy to catch the trend and open position. user can used the base line as a "Stop Loss" level.

The Trend Champion indicator works on all timeframes and currency pairs. The indicator should be used as an auxiliary tool for technical analysis, it helps to determine the direction of the trend: either upward or downward price movement for a particular currency pair. Can be used along with oscillators as filters.
Trend Champion is a trend indicator. Arrows indicate favorable moments and directions for entering the market. The indicator can be used both for pipsing on small periods and for l

The intelligent algorithm of the Legend Trend indicator accurately shows the points of potential market reversal. The indicator tracks the market trend, ignoring sharp market fluctuations and noise around the average price. Implements a kind of technical analysis based on the idea that the market is cyclical in nature. This is a pointer indicator. It catches the trend and shows favorable moments of entering the market with arrows.
A strategy for trading with the trend, filtering market noise
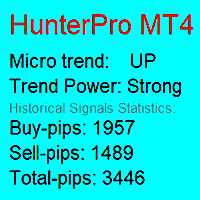
The trend indicator notifies about the direction of the microtrend, the beginning of a new trend or correction.
Suitable for any trading instruments: currency pairs, stocks, cryptocurrencies, futures, etc. The indicator does not change readings (does not redraw). A signal about a trend change comes as quickly as possible. Support: https://www.mql5.com/en/channels/TrendHunter Exiting a trade with the opposite signal is indicated for an example. You can close your trades in other places to maximi
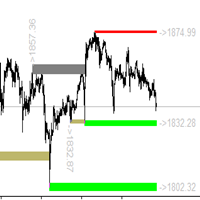
目前全额购买折扣中 ! 任何交易者的最佳伙伴! 该指标具有独有的支撑阻力计算方案,是独一无二的交易系统 。 指标特性 想象一下,如果您能提前精确的判断出重要的交易支撑阻力区域以及点位, 您的交易将如何改善?基于独特的计算方式,我们可以看到波段走势中清晰的支撑和阻力。将过去重要的支撑阻力区域经过独特的计算,将关键位置在图表中显示. 本指标支持周期设置,可以设置其他周期. 大周期重要支撑阻力,以及小周期辅助判断可以在同一图表中完成.
基本显示 显示支撑阻力的价格标签。 显示实时的支撑和阻力。 显示历史的支撑和阻力.
基本设置 设置支撑阻力计算的周期。
警报设置 接近报警 碰触报警 报警弹窗 报警邮件发送 发送推送警报 颜色设定 可以设置不用的实时支撑阻力颜色 可以设置不用的历史支撑阻力颜色 可以设置价格标签颜色 可以点击价格标签或者点击显示区域改变区域填充方式 任何问题,相互交流
Este indicador é capaz de determinar os níveis de preços nos quais houve o maior volume durante o período especificado da história. No futuro, o preço costuma saltar desses níveis e isso pode ser aplicado com sucesso na negociação. Eles são exibidos como linhas, alguns parâmetros para determinar os níveis podem ser ajustados. Este indicador é uma versão melhorada de VolumeLevels , ele notifica com um alerta quando o preço se recupera do nível e também pode notificar quando o nível é tocado. Alé
Indicator of trend deviation with a static level. The deviation coefficient is set for the trend histogram. Signals are the intersection of the level trend histogram in the direction of the trend or during a trend reversal - the option is selected in the indicator settings by the "Revers" parameter. There are all the necessary settings for the design of the indication and sending messages to mail or a mobile terminal. All input parameters have an intuitive name. Analog for MT5: https://www.mql5

Baze Zone is a configurable combination of tools/levels (MT5 version also available at MT5 section) : - Fib levels, 14, 23,50 - Fib Extension 27,61 - Pivot Points - Adds boxes to indicate range 'breakout' - ATR Range - Prev Daily Candle Range - Shortcut keys to hide/show the lines (configurable) In short, use this tool to add some extra zones to you fib tool. And use the extra's in combination with the shortcut keys to keep your chart clean. You can drag the lines for the Fib Levels.
The name

The Make Use trend indicator copes with the main task of trading: to find an entry point to the market at the moment of trend initiation and an exit point at the moment of its completion. A stable movement of quotations in a certain direction is called a trend in trading. In this case, the movement itself can be downward, upward or sideways, when the market movement does not have a pronounced direction. The Make Use trend indicator is important for identifying trends in financial markets. Howev
Purchasing the Flag Trend Pro indicator Free!!! Down load DashBorad: Flag Trend Pro DashBoard ---> Scan All pairs and All Timeframes This Indicator For Cutomer who looking Trend Trading And Filtering With All Important Features Built Inside One Tool!!! Filters out market noise and gives entry signals with exit levels. All this makes it an easy-to-use trend trading system for beginners, advanced and professional traders. Advantages: Easy, visual and effective reverses de
Do you ever wish to know when there is volatility in the market at a glance and specifically displayed on your chart? This is what Volatility PRO Advantage offers.
How Volatility PRO Advantage works Firstly, Volatility PRO Advantage does not use lagging averaging techniques; therefore, the signals are produced at the right time, giving you enough time to plan your entry, exit, or stop loss trailing. Another important part is that it checks for the strength of a pair and uses it to detect e
https://youtu.be/hHAqablsCW4 Трендовый / контр-трендовый индикатор МТ4, дающий точные сигналы для входа в сделки. Работает без перерисовки и запаздываний!
Идеальные точки входа в сделки для валют, крипты, металлов, акций, индексов . Работает на любом таймфрейме!
Что бы открыть сделку нужно дождаться когда наш индикатор покажет нам наш паттерн.
После чего мы ждем пробитие этого паттерна в одну или другую сторону. После пробития нашего паттерна мы ждем БЗ - Бар защиты.
Бар защиты
Binary & Forex (+ 90% Ratio-Win Next Candle)
Wait for the price to reach a good (strong) zone be it support, resistance, supply or demand zone, fibonacci level key, round figure. By doing the above there will definitely be a reversal in price and you will get your ITM on the first candle giving 100% effectiveness following the trend. It is very important to be attentive to the fundamental news in the market and these do not affect your trading. Commercial sessions: any (24 hours). Currency

Ao negociar usando o The Strat , é importante ficar de olho em vários prazos. Este indicador mostrará o estado Diário, Semanal, Mensal e Trimestral da vela atual para cada período de tempo. Um ícone de Círculo mostra que a vela nesse período de tempo é atualmente um Inside ou Type 1 na terminologia TheStrat. Uma vela Inside Day está consolidando a ação do preço e estamos procurando uma quebra do intervalo. Um ícone Triângulo, apontando para cima ou para baixo, é uma vela de tendência ou Tipo

Trend Thyrogen is a trend trading strategy, filtering and all the necessary features built into one tool! Intelligent indicator algorithm with generates input signals and output levels.
The principle of operation of the indicator is to automatically determine the current state of the market when placed on a chart, analyze historical data based on historical data and display instructions for further actions on the trader's screen. The system itself shows in the form of arrows when to buy and w

The Qubit Trend indicator works using the cyclical-wave dependence function. Thus, all entry points will be optimal points at which movement changes. Entry points should be used as potential market reversal points. The default indicator settings are quite effective most of the time. You can customize them based on your needs. But do not forget that the approach must be complex, the indicator signals require additional information to enter the market.

The Retracement Feeder checks for retracement opportunities after the first move has occurred. Basically it scans for the second wave of trend. Works with any financial instrument, It does not repaint/change color or cancel arrows, Easy to set and use. Works great with Renko Charts
MT5 version: https://www.mql5.com/en/market/product/71340
How it works
The indicator is based on RSI and Stochastics. The algorithm used in the Retracement Feeder allows the Stochastic and RSI to minimiz

Chaos Trend is an arrow indicator for identifying potential entry points. I like it, first of all, because it has a simple mechanism of work, adaptation to all time periods and trading tactics. More reliably, the Forex Chaos Trend indicator is a real trading strategy with which you can achieve the desired results.
As soon as the Chaos Trend indicator is installed, the main indicators for the price of the traded pair will immediately begin to be recalculated, based on the postulates of technic

The Channel Token indicator automatically builds a trend movement tracking channel.
The price is in its trend movement in a certain range, and not a chaotic spread of the price, it is not clear in which direction. And if the price deviates within a certain range, it means that the boundaries of these ranges are support and resistance lines and form the Channel Token channel.
Channel Token - an indicator in which the indicator period is automatically calculated based on the number of bars of

Channel BEAM - indicator of the channel and levels. If you use the Channel BEAM indicator to build the price band, then the trader will not have to conduct a detailed analysis of the market situation. All calculations in automatic mode will be performed by the indicator itself. This tool is simple and functional. When using it Channel BEAM, a price corridor is built on the chart: The upper line of the channel is the maximum value of the bar for a certain number of them. The lower line of the ch

Индикатор предназначен для скальпинга, преимущественно на младших таймфреймах (например M15, M5) и включает в себя 2 стратегии для торговли во флете и тренде. Тестировался при помощи ручного тестера и советников, выбраны оптимальные настройки. Сигналы входа-выхода образуются на нулевом баре, без задержек. Белые стрелки показывают смену тренда, для входа не используются. Сигналы по 1 стратегии: это красные и синие стрелки в зонах перекупленности и перепроданности. Выход из сделки произвольный

Know Your Risk is a powerful tool that is developed to help traders have better risk management in a very simple way. How? The Know Your Risk indicator has two horizontal lines on the chart, a red horizontal line that represents stop-loss and a green horizontal line that represents take profit. The trader is required to place the lines on the chart at areas of stop-loss and take profit. A panel is presented on the left of the chart that displays the risk in pips/points, risk in percentages, the

It's a DYNAMIC PERIOD indicator which identifies best ENTRY PRICE in the direction of main trend. It's completely non-repaint indicator and very simple to use.
Each arrow has a specific impact value from 1 to 10. Basically there is no important difference between impact numbers. The main point is: A higher impact value means that signal is generated from a bigger swing.
When it draws a Buy arrow on a bottom, It means that we had a Trend, A correction, And now this bottom is a reliable trig

Now manual trading will be fun! This indicator is a high-quality and affordable trading solution. The indicator does not redraw,but works in real time.
It provides a complete off-the-shelf system. The system visually indicates on the chart the beginning of opening positions, their further support and
optimal closing. The indicator also has a notification about trading actions: "VOICE NOTIFICATION", "VISUAL NOTIFICATION", "ALERT" and "PUSH NOTIFICATION". You can either follow the si
Индикатор Trinitron создан для того чтобы отображать тренд в наглядном виде. Одним из главных определений для мониторинга рынка валют является тренд. Тренд - это устойчивое направление движения цены. Для его нахождения индикатор использет расчёты, призванные сглаживать резкие колебания, не влияющие на общую картину движения цены.
Тренд может быть возрастающим (бычий тренд) и убывающий (медвежий тренд). В большинстве случаев тренд растёт долго и резко падает, но во всём бывают исключения. На д

The indicator - "ATR Line" determines the current trend and gives signals to buy (green arrow to the top) or sell (red arrow to the bottom). The indicator calculation is based on the deviation of the average price of the instrument from its average true range - ATR. The moving average of prices is used to reduce "market noise". If the main line of the indicator - "ATR Line" is lower the instrument price chart, then the market is in a "bullish" trend. If the main line of the indicator is higher t

RSI Entry Points is the upgrade of the standard RSI indicator to avoid lagging. Indicator draws the clouds and the arrows to have clear picture where price is and what to wait for. Why standard RSI is lagging? because mostly we do not use it correctly and it is with very weak visual flexibility, less informative. With my current upgrade I tried to Fix both problems same time and I got much better results and more exact entries than standard RSI has. I Made RSI line Dynamic, it gets more flexible

Hello Seasonal Traders! The seasonality trading strategy works because the smart money is doing the same thing every single year more often than not. The month of the year or the day of the week and the time of the day can call the shots in any market. The seasonal cycle is another useful tool in your trading arsenal. I'm not saying to trade solely off of seasonality and forget anything else. I'm only giving you another trading tool that you can incorporate into your own trading strategy to ga
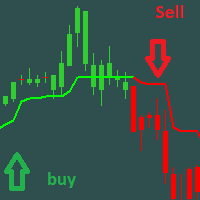
Трендовый индикатор МТ4, дающий точные сигналы для входа в сделки. Работает без перерисовки и запаздываний! Только покупателем данного индикатора прилагается основной фильтр,обращайтесь в личку. Идеальные точки входа в сделки для валют, крипты, металлов, акций, индексов . Наилучшие результаты на таймфрейме M30 и выше!
Наш канал в Telegram | Версия индикатора для MT5 Скоро
видео for indicator Большинство трейдеров улучшают торговые результаты в первую неделю торговли с и

Dream Catcher Pro
This is a Scalping indicator for MetaTrader 4 platform based on Moving average crossover strategy. Dream Catcher Pro is a professional indicator for the MetaTrader 4 terminal. Unlike other Indicators , Dream Catcher Pro provides better signals and is able to identified prolonged trends . the indicator painting arrows and histogram channel that assist you for scalping trading system .
Advantages of the indicator Perfect for scalping. Generates minimum false sign

Shows the total profit / loss of the level in the deposit currency. The indicator is convenient for quickly checking the strength of an account with a large number of locked or grid orders. "Calculation ProfitLoss" immediately after loading draws a horizontal line at the current Ask price. If you move the line with the mouse, then at the new level the indicator will calculate: the amount of profit / loss of all orders opened in the instrument window. A positive / negative value is displayed on t

A top-quality implementation of the famous Zig Zag indicator, which needs no introduction. It is completely coming from original algorithm. After you have this indicator, you will no need any more indicator for opposite direction of trend.
Trading direction of TREND
Very easy to understand and set It implements a multi-timeframe dashboard Buy and Sell signals on same chart Working M5-M15-M30-H1-H4 and D1
After the purchase, please contact me for to learn how to use it.
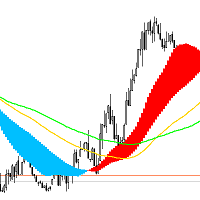
DveMashki O indicador da direção da tendência, o indicador também corrige as partes planas do movimento dos preços.
Descrição das configurações do indicador: MaPeriod1 - O primeiro período médio para calcular o indicador. MaPeriod2 - Segundo período médio para cálculo do indicador. MaMethod - Método de cálculo da média. Pode ser qualquer um dos seguintes valores de enumeração: MODE_SMA - Média simples, MODE_EMA - Média exponencial, MODE_SMMA - Média suavizada, MODE_LWMA - Média ponderada lin
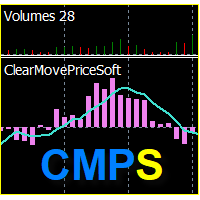
Индикатор "ClearMovePriceSoft" отображает чистоту изменения цены за период расчёта ( "CMP_period" ), и линию само смягчения за количество баров ( "Softing" ). Чем выше значение индикатора, тем чище складываются бары, за приходом тикового объёма.
Входные параметры:
DRAWs =120 - количество баров для отрисовки главной линии индикатора ( "CMP_MAIN" гистограмма); CMP_period =8 - главный период индикатора; Softing =5 - период само смягчения для линии "Softing_average" .
Диапазон варьирования зн
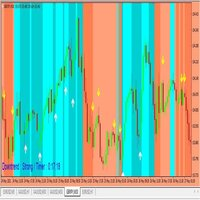
You have to wait the background colors, if the background's RED, you have to wait the yellow arrows to take selling orders. If the background's BLUE, you have to wait the white arrows to take buying orders. When the arrows show out, please wait for the close candles, otherwise it repaints. Please you watch the background colors, if the background's Lighter Red, that means big downtrend signals, if it's Darker Red, you have to be carefull. Because the downtrend can change to uptrend suddenly. if

Индикатор Super Trend TV , выдаёт точные сигналы для входа в сделки. Работает без перерисовки! Super Trend TV - трендовый мультивалютный индикатор, может использоваться на любых финансовых инструментах валюта, криптовалюта, металлы, акции, индексы. Индикатор не перерисовывается и не запаздывает. Рекомендуемый тайм-фрейм M15, M30, H1, H4, D1.
Какие точки входа в сделку являются идеальными? Лучшая точка для входа в сделку – это начало или продолжение движения цена в определенную сторону. В т

This trend following system was designed by Dennis Gartman and Bill Eckhart , and relies on breakouts of historical highs and lows to take and close trades: it is the complete opposite to the "buy low and sell high" approach. This trend following system was taught to a group of average and normal individuals, and almost everyone turned into a profitable trader.
The main rule is "Trade an N-day breakout and take profits when an M-day high or low is breached (N must me above M)" . Exampl

Advanced Ichimoku Toggle Button With Alert Indicator
A Very useful tool that every trader should have in their tool box This Indicator is an unique and high quality tool because it has many useful features. The ichimoku indicator consists of many elements such as kumo cloud,Kijunsen,Tenkansen,chinkou span,Span A and Span B. Different Traders use the ichimoku indicator for different strategies such as cloud breakout strategy, Tenkan kijun cross, chinkou price cross and many more... But for m
GO Multi Oscillator Divergence Entry is a unique divergence indicator that is different from all other divergence indicators on the market. After purchase, leave a review, a comment or make a screenshot of your purchase and contact me to receive for free the Trade Entry Manager utility ! Feel free to check out my other products here : https://www.mql5.com/en/users/gyila.oliver/seller#products
The uniqueness of the indicator consists of two key elements : unlike other divergence indicators, t
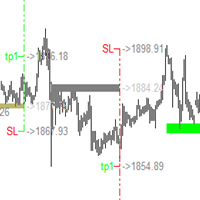
This indicator has a unique support and resistance calculation program, which is a unique trading system. Index characteristics Imagine if you can accurately determine the important trading support and resistance areas and points in advance, how will your trading improve? Based on a unique calculation method, the indicator analyzes the trend, analyzes the current support and resistance, and obtains the current important support resistance and single direction, the calculated stop profit and st

Smooth Flow is an indicator where it uses a stochastic oscillator. According to the indicator buffer for buying, It crosses above and it has a current timeframe with a 5% K period and a 3% D period. In addition to the timeframe, it is below 20 in value. For the arrow, it's "Arrow Up" with 1 in width and blue with the label "buy" along with a current timeframe and low candlestick value. It has an average true range. As you insert the indicator, there will be blue and red arrows displayed in the

This indicator may or may not be within your interest but I call it Cosmic Dream. When I backtested the indicator, colored level zones appear on your chart. It can work on any currency pair you want. There are 5 level zones. 5 are red and 5 are green. The purpose of this indicator is to let traders see the number of level zones. The interval of the zones is 50 at best. In terms of zone width, the number is 10. It can utilized for any direction. The colors will be visible as long as the indicator

This is a Multi-currency multi-timeframe Support/Resistance Scanner Dashboard for Metatrader 4 (MT4) platform.
Get all extras and download free demo here: https://abiroid.com/product/abiroid-support-resistance-scanner
Read detailed description in post above.
Features: Scan Support/Resistance zones (also called Supply/Demand zones) Show alert when price is inside these zones and highlights the pair/timeframe Show or hide SR zones price nearest to current price (Price_Close) Show or hide cur
Volume-weighted average price
In finance, volume-weighted average price (VWAP) is the ratio of the value traded to total volume traded over a particular time horizon (usually one day). It is a measure of the average price at which a stock is traded over the trading horizon. VWAP is calculated using the following formula: *It is shown second screenshot in the screenshots.
trade that takes place over the defined period of time, excluding cross trades and basket cross trades. for more informatio

Do you like candles? We see candles all the time in the forex market don't we? Candlesticks MA is a moving average indicator that can work on any timeframe. This indicator has been backtested and has the ability to let you see additional candlesticks. There are purple and red candlesticks. The value for the moving average period is 5. It is used for observing the moving average flow pattern of the forex market. It's usable for any currency pair you invest in. It is also good for any MA you use.
Price Action Indicator gives you reverse or even continous trend signals depending on your timeframe and Strategy used. !!!This is not a holy grail indicator and it will not give 100% winning rate!!! As you can see, it is not giving a lot of signals because of the price movements in side way (flat) trend. You can use it on every major currency pairs and even on indices. Please be aware of using this indicator with other strategies and indicators. Use MM and Risk Management properly. Sometimes

A resistance level is the opposite of a support level. It is where the price tends to find resistance as it rises. Again, this means that the price is more likely to "bounce" off this level rather than break through it. However, once the price has breached this level, by an amount exceeding some noise, it is likely to continue rising until meeting another resistance level. A support level is a level where the price tends to find support as it falls. This means that the price is more likely to "b
Olá, pessoal.,
A fim de negociar com segurança em Forex; tudo o que você precisa é o indicador "negociação intradiária pro".
Indicador de dezembro detecta" Safe Buy/Sell "pontos, analisando o" menor e mais alto valor do dia "deste instrumento nos intervalos de tempo que você definiu e instantaneamente lhe dá o" canal alvo dezembro " no gráfico ao vivo.
Ele oferece Comprar 1 - comprar 2 canais (2 zonas de compra da linha azul) como pontos de compra seguros. Ele oferece um Sell 1 -Sell

Сканер Heiken Ashi на четырех таймфреймах. Индикатор не рисует и не подсматривает историю. Модифицированный расчет повышает чувствительность! Возможно отключить модифицированный расчет для каждого таймфрейма отдельно, а также отключить анализ 4 таймфрейма. В нулевом (скрытом) буфере хранится информация о совпадении трендов на всех рабочих ТФ. Эта опция упрощает анализ и чтение из советников.
Требователен к истории. Наиболее простое отсутствие данных по старшим ТФ проверяется при загрузке. Осно

The "VSA on the FLY" indicator is designed to quickly display various Volume Profile / Market Profile parameters.. The indicator takes the initial data for operation from the M1 timeframe. The indicator is installed on any timeframe and starts displaying data starting from the selected left border. This can be the beginning of a day, a week, a trading session, any hour, etc.
The version of this indicator for MetaTrader 5 can be found here .
The following input parameters are available: Show

Currency Weight FX ( CW8) You are going to see the Forex Treasure If you think in Forex Trading you are dealing with one chart only, then you are on your way to be plunged into misery. The weight of one's currency will affect other currency or currencies. This Currency Weight FX is a breakthrough in trading tools
With Currency Weight FX ( CW8 ) indicator you will see each weight of major currency. This currency WEIGHT is very much different from currency STRENGTH most people usually mean.

The AutoTarget Indicator For MT4 is an indicator that is built for the traders that work with the Meta Trader 4 charting platform during their trading day and it is built for a singular reason which is to help the Trader using it to predict the next price target on the current timeframe or currency pair that the trader attaches it to. It works across all currency pairs and trading platforms and can help a seasoned trader by reducing the amount of technical analysis he or she has to do every day
MAs Crossover Dashboard Pro uses the value of Moving Average indicator. The periods of 2 MAs can be adjusted via the Edit boxes of this dashboard. The monitoring pairs will be selected by adding to the Market Watch (no need to set prefixes or suffixes) , you can monitor many pairs as you like. This dashboard will check almost popular time frame (M1,M5,M15,M30,H1,H4 and D1). The colors can be customized. The parameter of MAs can be set at the input. Crossover signal can be sent to you screen, yo
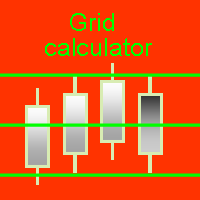
Графический калькулятор для быстрого расчёта сеток ордеров или стратегий усреднения. Показывает объёмы ордеров по уровням, коэффициент мартингейла, шаг сетки, просадку каждого ордера и всей сетки, уровень безубытка ( Loss = 0) . Чтобы программа выполнила расчёты достаточно натянуть сетку на график, перетащив мышкой начальный ( Level 1) или контрольный (Level control) уровни. Параметры по умолчанию можно изменить через окно настроек. Оно появляется при первой загрузке Grid calculator либо п

Indicator from the Real Non RePaint MultiTimeFrame (Real NRP MTF) series. Specially designed to display the RSI standard indicator reading from the Senior TimeFrame (TF) to the Junior. The indicator differs from the standard scale - symmetrical relative to 0. Add 50.0 to the readings to get the standard values. Does not look into the future for history at the senior TF. DOES NOT DIFFER from the standard real-time indicator readings (including bias), but shows the actual indicator readings on th

Hello!
Tired of constantly subscribing to other people's signals and earning pennies?
Want to manage your own trading?
Then you are on the right page!
It's very simple ==> buy my indicator ==> put it on the chart ==> blue arrow - buy ==> red arrow - sell. Even an infant can do it!
A handy histogram to trace the market direction.
Are you still here? Then read the parameter descriptions and take a look at the screenshots: Stoch K period - period for calculating the% K oscillator line.

Indicator from the Real Non RePaint MultiTimeFrame (Real NRP MTF) series. The indicator is based on the standard one. Does not redraw in any mode: the last closed candle is a rock. Does not look into the future for history at the senior TF. The formula for sensitivity enhancement has been changed (disabled in settings). It works on the current TF or older ones with the display on the current one. The last closed Heiken Ashi candle of the current timeframe before the opening of the new senior

Indicator from the Real Non RePaint MultiTimeFrame (Real NRP MTF) series.
Specially designed to display the standard Stohastic indicator from the senior timeframe (TF) to the junior. The indicator differs from the standard scale - symmetrical relative to 0. Add 50.0 to the readings to get the standard values.
Does not look into the future for history at the senior TF. DOES NOT DIFFER from the real-time standard indicator (offset-based), but shows the actual indicator counts on the history

Tom DeMark developed TD Sequential by hand, through a process of trial and error, in the 1970s. It never ceases to amaze me how something originally created to analyze daily price data can be applied so effectively, more than thirty years later, to any time frame—from one minute to one year—and to any market. The indicator has two components: TD Setup, which relies on momentum to define price ranges, and TD Countdown, which is trend based, and looks for low-risk opportunities to fade establishe

Graphing calculator for quick calculation of order grids or averaging strategies. This is an improved English version of the "Grid calculator" program, which shows order volumes by level (lot), martingale ratio (MG), grid step (step), drawdown of each order and the entire grid, breakeven level (Line Breakeven). For the program to perform calculations, it is enough to pull the grid onto the chart by dragging the initial (Level 1) or control (Control line) levels with the mouse. The default param

Woodies CCI is a momentum indicator that was developed by Ken Woods. It's based on a 14 period Commodity Channel Index (CCI) . It's a fully unbounded oscillator with a base value of 0 and has no lower or upper limit. Some traders use the indicator to spot a number of tradable CCI patterns both with and against the trend, such as the zero line reject, the reverse divergence and the trendline break. The 200 level signals an extreme reading. The indicator is often used in combination with other sig
Scalper Signals Trader
Best and simple Indicator for clear and safe entry and exits. Predefines- multiple targets and stop loss, as per risk reward ratios Signals can be set – based on aggressive or safe algorithm Aggressive entries are also profitable but are raw signals without checking the higher time frame trends Safe entry meanwhile will check if the lower and the higher time frame are both in same direction, thereby having lesser trade entries and more quality. The very robust macd le

Smart Multi Systems
21 STRATEGIES IN 1
INPUT
FileComment = "";- trade log file EntryOnly = false;- "TRUE"- SIGNAL TO SIGNAL MODE Can Exit by Opposite Signal = false; IndicatorAlerts = false;- EntryAlerts = true; ExitAlerts = true; Reentry=false( ENABLE reentries) ENTRY SETTING PARAMETERS EntryStyle = EP-SIG+Rev Alert ( 21strategies ) ExitStyle = Rev Alert ( 8 EXITS strategies )
ENTRY and EXIT SETTINGS ===== KPeriod = 100; DPeriod = 12; Slowing = 3; method = 0; price = 0;
This indicator: 1. Does not provide any signal for trading. 2. Shows chart symbol and timeframe more visible. 3. Shows spread in digit format. 4. Shows the value of each point of current symbol per one lot. 5. Changes the symbol of current chart by one click. 6. It is useful for someone who wants to analyze different symbols on one chart. by clicking on the desired symbol name at left side, indicator draws it fast.
By using of this indicator, you can easily set two alerts for each timeframe of each instrument. This is how it works: 1. Add the indicator to the chart. 2. Click on "New Alert" button. 3. Drag the drawn rectangle to your desired price. 4. Then click on "Add" button to active the alert. You can do the same for the second alert. Please: Keep in mind that for each rectangle only the side of the rectangle that is close to the price is important. For a different instrument, drag it from the market
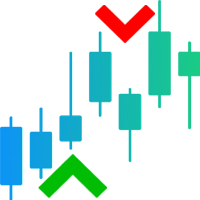
The Price Action Alert Indicator MT4 is a custom indicator made for the traders which help the traders to distinguish the price ticks that make the market price action understood. This indicator utilizes bearish or bullish signs at its cost rates. This Price Action Strategy gives open doors for different examples in elements that are undetectable to the unaided eye. This indicator is exceptionally intended for Meta trader 4 .
You can undoubtedly make benefits by understanding this indicato
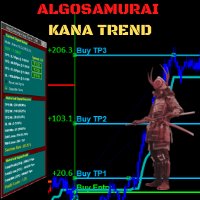
Cutting-edge solution for Trend Trading with statistically robust signals! Kana Trend’s smart algorithm detects the trend on any instrument, any timeframe, and gives powerful entry signals with exit levels. Its advanced statistics gives you deep insight as to success and profitability of its signals -- while being fully transparent on any potential for loss. Because this is an indicator, not an EA, you cannot see it in action in visual tester if you download the Free Demo. Instead, please down
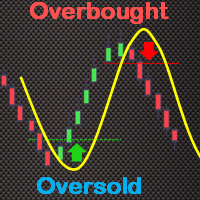
The True Oversold Overbought indicator provides you with ability to swiftly check whether the asset is oversold or overbought. Other than complementing your trading with True Oversold Overbought, you can use the indicator as your only trading system. It works with all forex instruments and will save you the headache of estimating when the market is due for a reversal or retracement. When the "Super Charge" feature is enabled, the areas where the price is in oversold/overbought status are ampl

MT4 trend indicator with a probability of reaching a profit of 70-90%! Works without redrawing and delays. Trend Master PRO shows good results on all trading instruments: currencies, metals, indices, stocks, cryptocurrencies. Recommended timeframe: H1-H4.
More information about the indicator is here: https://www.mql5.com/en/blogs/post/744748
Recommendations for use
Use automatic period detection The main feature of the indicator is the self-optimization function.

Average True Range (ATR) é um indicador comumente usado que mede a quantidade de movimento no preço ao longo de um período definido. No entanto, o valor que ele dá não é definido dentro de qualquer tipo de limite, o que torna quase impossível usá-lo para qualquer coisa que não seja o cálculo de stop loss ou take profit.
Este indicador é o seu indicador ATR padrão, mas introduzimos demarcações de percentis para que você possa ver os extremos.
Você pode escolher entre percentis e algo que cha
O Mercado MetaTrader é o melhor lugar para vender robôs de negociação e indicadores técnicos.
Você apenas precisa desenvolver um aplicativo para a plataforma MetaTrader com um design atraente e uma boa descrição. Nós vamos explicar como publicar o seu produto no Mercado e oferecer a milhões de usuários MetaTrader.
Você está perdendo oportunidades de negociação:
- Aplicativos de negociação gratuitos
- 8 000+ sinais para cópia
- Notícias econômicas para análise dos mercados financeiros
Registro
Login
Se você não tem uma conta, por favor registre-se
Para login e uso do site MQL5.com, você deve ativar o uso de cookies.
Ative esta opção no seu navegador, caso contrário você não poderá fazer login.