Conheça o Mercado MQL5 no YouTube, assista aos vídeos tutoriais
Como comprar um robô de negociação ou indicador?
Execute seu EA na
hospedagem virtual
hospedagem virtual
Teste indicadores/robôs de negociação antes de comprá-los
Quer ganhar dinheiro no Mercado?
Como apresentar um produto para o consumidor final?
Indicadores Técnicos para MetaTrader 4 - 37
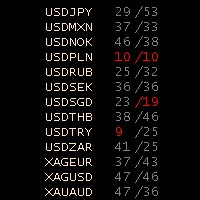
Stochastic Oscillator Panel Introducing the Stochastic Oscillator Panel, a comprehensive representation of the stochastic oscillator for all currencies (up to 75 pairs). This powerful tool operates within the current time frame, utilizing the simple moving average and relying on the Low/High prices. The panel consists of three columns: Name of the currency MODE_MAIN (main line) MODE_SIGNAL (signal line) The Stochastic Oscillator Panel provides visual cues through color coding: Green color (overb
FREE

21 simple moving average ( All Type of 21 MA River ) 51 simple moving average
Long Entry Upper 51 MA and above the 21 River Middle channel. Long Only Above Green Line (Market Opening Line) Short entry Below the lower 51 MA and below the 21 lower channel. Short Only Below Green Line (Market Opening Line)
Exit position
Initial stop loss is 20 pips below (for buy) or above (for sell) Target : Next level as per indicator Profit Target ratio 1:1.2
Download Template : https://drive.google.c
FREE

Abiroid Multi Slope indicator allows you to calculate a Slope Histogram for any line of any indicator . Histogram is for 1 slope line only, but slope values can be calculated for 3 lines total. To have multiple histograms, add as many Slope indicators for custom indicators as you like on chart. You just need to provide the Indicator name, buffer value, slope's period and max number of bars back. By default it has slope calculation for TDI_v4.ex4 indicator. There is no way to specify parameters f
FREE

AD Trend line draws trend lines on the basis of A/D indicator (Accumulation/Distribution). When A/D indicator breaks a trend line, the probability of the trend reversal is very high. This is a multitimeframe indicator which can display values from higher timeframes. Parameters Time-frame — Select a timeframe; zero is the current timeframe of the chart; Trend Line — Display lines on the chart; Apply to — Apply lines to close the candle's highest/lowest value; Width line — Width of the line; Style
FREE

I present to you the Profi Arrows indicator. The indicator is based on non-standard Moving Average indicators. It represents the input signals in the form of arrows. All signals are generated on the current bar. It is maximally simplified to use both for trading with only one indicator and for using the indicator as part of your trading systems. There are 2 operating modes in the indicator. Option with redrawing the signal, and without. In the mode without redrawing, the option of redrawing the
FREE

Support and Resistance Levels Arrow Indicator please leave 5 stars to me A support level is a level where the price tends to find support as it falls. This means that the price is more likely to "bounce" off this level rather than break through it. However, once the price has breached this level, by an amount exceeding some noise, it is likely to continue falling until meeting another support level. A resistance level is the opposite of a support level. It is where the price tends to find re
FREE

O que é Squeeze? É geralmente visto como um indicador importante, potencializa o movimento direcional subseqüente ou grande movimento de oscilação do indicador Bollinger Bands no interior do Keltner Channel refletindo o mercado, fazendo uma pausa e consolidando. Quando as Bollinger Bands deixam o Keltner Channel significa que mercados estão saíndo de uma baixa volatilidade para uma alta volatilidade, um objetivo que todos os traders estão procurando. Diferença
Squeeze FREE
Squeeze
Squeeze
FREE

OLHE A SEGUINTE ESTRATÉGIA COM ESTE INDICADOR. O RSI triplo é uma ferramenta que usa o RSI clássico, mas em vários períodos de tempo para encontrar reversões do mercado.
1. ️ Idéia por trás do indicador e sua estratégia:
Na negociação, seja Forex ou qualquer outro ativo, o ideal é manter a simplicidade, quanto mais simples melhor. A estratégia de triplo RSI é uma das estratégias simples que buscam retornos de mercado.
Em nossa experiência, onde sempre há mais dinheiro a ganhar, é n
FREE
Switch symbols and timeframe by arrow buttons 1. You can switch multiple symbols of one or all charts. 2. You can set list of symbols to switch between them or get them from Market Watch. 3. You can change timeframe of one or all charts. List of timeframes here [M1, M5, M15, M30, H1, H4, D1, W1, MN1]. Switch symbol of all charts: indicator check current symbol of the chart to get index of it in list and change for next or previous. Key functions: - Right arrow key: switch to next symbol. - Left
FREE
The oscillator indicator " AnglerSPeriod " is one of a series of three calculators of the angular deviation of the price chart of a trading instrument.
INPUT PARAMETER: DRAWs =128 - Number of bars to display the indicator in the chart history; PeriodIND =14 - calculation period of the indicator in the number of bars.
The values of the indicator indicators are degrees . The presence of a Strong price Movement begins with a value of +-45 degrees, and can not exceed +-90 degrees. A Good Tradin
FREE
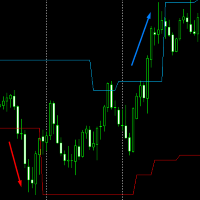
Volatility Channel from JagzFX helps you find breakouts by displaying a channel on the price chart. Volatility Channel is simple to use - there are no parameters - and works on any timeframe. BASIC USE of Volatility Channels The channel can be used as a 'No Trade Zone': you don't trade when the price is inside the channel. However:
When the price breaks above the channel: go Long. When the price breaks below the channel: go Short. The indicator works on all timeframes to suit your trading style
FREE

Signals and Alerts for Accelerator/Decelerator indicator based on these MQL5 posts: Accelerator Oscillator and Signals of the Indicator Accelerator Oscillator . Note : this tool is based on the code of Accelerator indicator developed by MetaQuotes Software Corp.
Features The signals are triggered at closing of last bar/opening of a new bar; Any kind of alerts can be enabled: Dialog Box, Email message, SMS notifications for smartphones and tablets, and Sound alerts; Customizable arrows. By
FREE

FIBO DASHBOARD This dashboard lists down multi currency Fibonacci level whenever price hit the level. It draws a Fibonacci Retracement based on daily time frame. It draws arrows, sends pop-up alert whenever price crosses Fibonacci levels. This tool is useful for users who trade with Fibonacci. For paid version click here .
INPUT ON Alert: set to true will pop-up alert whenever arrow appears. ===== FIBO(High & Low)===== Time Frame: Fibonacci is drawn from daily high to daily low or vise ver
FREE
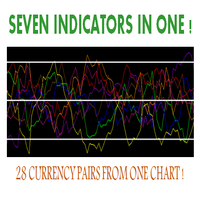
Hello, This indicator is a unique high reliability 7-in-1 multicurrency indicator comprising these sub-indicator’s: A Trend Power Crossover Indicator. A Percent Change Crossover Indicator. A Currency Overbought/Oversold Indicator. A Currency Deviation Indicator. A Currency Impulse Signal Indicator. A Trend Power Indicator. A Currency Volatility Indicator. The main advantage of this indicator is that it's reasoning by currency and not by currency pair. The values of each sub-indicator are calcul
FREE

This is a must have tool for every trader, because this indicator provides the scoreboard with most important basic information for trading. It displays current server time, remaining time of the current bar, a calculated lot for the specified risk and free margin, characteristic bar sizes, and spreads. When placed on a chart, the indicator creates a text label in the upper right corner with the following information: -17:50 [70%] 11:42:30 SL:0 SP:17 B:A41/M39/D67 L:0.26/5% remaining time to cur
FREE
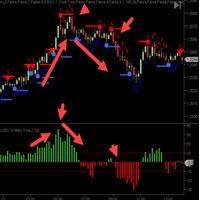
O Indicador de Valor de Resistência de Fechamento do CycleTraderPro mede a distância da ABERTA de uma nova barra ao CLOSE daquela barra.
Entrada -
comprimento = 10 padrão
Adicionamos esses valores juntos, retornando a configuração do comprimento.
Se a 1ª barra fosse mais 10 ticks e a próxima barra fosse menos 7 ticks, então isto registraria +3
Existem 2 formas de negociar
1. Negociação na direção de máximos e mínimos mais baixos e vice-versa para compras, máximos mais altos e m
FREE
This indicator displays signals about the standard MACD crossing the zero value, as well as about crossing the signal line. The indicator does not redraw. Signals are shown on fully formed candles. The indicator can send notifications of its signals to the terminal and email. Custom Parameters: Fast_EMA_Period - fast moving average period; Slow_EMA_Period - slow moving average period; Signal_Period - signal line period; MACD_Price - the price at which the indicator is built;
Alerts - show a
FREE

Индикатор отображает скользящие средние на заданном количестве баров ( Count bar for show MA ). Данный способ отображения упрощает анализ, так как график не загромождён лишними линиями. Так же имеется текстовая метка с отображением текущей цены скользящей средней и периода графика. Горячие клавиши служат для упрощения использования индикатора.
Настройки индикатора: Moving average #1 - скользящая средняя #1 Period - период усреднения Mode - метод сглаживания Price - используемая цена для расч
FREE
Buy a Coffee for Yuniesky Carralero Cuellar
This indicator draws:
TX - The max price since the last cross down, between M20 and M200, and the previous up cross
BX - The min price since the last up crossover, between M20 and M200, and the previous down crossover
You will need to use the A4_D template that shows
1. Simple Moving Average 20
2. Simple Moving Average 200
3. Period Separators
4. ASK line
Support
I will be happy to hear your recommendations to improve this product.
FREE
The indicator determines overbought/oversold zones on various timeframes. Arrows show market trend in various time sessions: if the market leaves the overbought zone, the arrow will indicate an ascending trend (arrow up), if the market leaves the oversold zone, the arrow will indicate a descending trend (arrow down). Situation on the timeframe, where the indicator is located, is displayed in the lower right window. Information on the market location (overbought or oversold zone), as well as the
FREE

The implementation of the impulse system described by Dr. Alexander Elder. The indicator generates signals according to the following pattern: Moving average and MACD histogram increase - green bar, it is forbidden to sell; Moving average and MACD histogram have different directions - gray (or empty) bar, the ban is removed; Moving average and MACD histogram decrease - red bar, it is forbidden to buy.
Indicator Parameters EMA - period of the indicator's moving average MACD Fast - period of the
FREE
Acompanhe seus trades gerais! O Monitor New Fox é um excelente indicador, onde exibe para você seus lucros atuais, sendo eles mensais, semanais, e diários, ou seja todos lucros obtidos quando você abriu o mt4. Nosso novíssimo indicador Monitor New Fox é capaz de desbloquear todos os recursos avançados do MetaTrader 4. Este indicador pode representar graficamente com dados simples os principais dados da conta meta trader (saldo, patrimônio líquido, margem livre, lucro/perda atual, lucro/perd
FREE

It's a simple indicator based on Moving Average. It's still a beta version. Good for a Day trader to identify market movement. No Repaint but It doesn't mean that all signals should be a win. There are no trading rules which you can gain 100%. You have to accept the losses.
Recommendations: 5 or 15 Min Any Pair Try to switch the timeframe 5 or 15 to find out best TF for your pair. Tips - Don't forget to set SL and TP. Thank you.
FREE

Este indicador Plota os níveis Aberto, Alto, Baixo e Fechado do mês anterior, nos períodos de tempo mais baixos do mês atual.
Estes níveis atuam como bons níveis de suporte e resistência.
Na maioria das vezes, o preço oscila dentro dos níveis.
espere que o preço alcance esses níveis e aja de acordo.
Preste especial atenção à confluência de níveis.
De acordo com a minha observação, se o nível Próximo (Branco) estiver em confluência com qualquer outro nível, Alta probabilidad
FREE
The indicator analyzes the divergence of the current price with the Laguerre filter data. Indicator signals: Blue dot - short-term transactions to buy an asset are allowed. Red dot - short-term transactions to sell the asset are allowed. A big blue signal - if the price breaks the high of the bar on which the signal was given - a medium-term buy trade is opened. A big red signal - if the price breaks the low of the bar on which the signal was given - a medium-term sell trade is opened. The indic
FREE

The Moving Average Slope (MAS) subtracts the moving average level n-periods ago from the current moving average level. This way, the trend of the moving average can be drawn on the moving average line.
Features Observe uptrends and downtrends at a glance. The indicator is non-repainting. Returns buffer values for the trend of the moving average to be used as part of an EA. (see below)
Inputs Moving Average Period : The period of the moving average (MA). Slope Period : Number of periods betwe
FREE

Trend Rising is a custom MT4 ( Metatrader 4 ) indicator, use best for scalping on TF M30 and below that analyzes the trend and momentum pattern using Bill William Indicators on multiple timeframes. As the result, It identifies the beginning and the end of the trend that works for most currency pairs. The Trend Rising indicator is developed based on Accelerator Oscillator and Awesome Indicator. Key Features Identify the beginning and the end of the trend as display with colors. Identify eas
FREE

With the MACD Multi Time Frame indicator, you can spot divergences of higher timeframes while you are searching for pinpointed entries on lower timeframes. This FREE version of the indicator works only on EURUSD and GBPUSD. The full version of the indicator can be found here: MACD Multi Time Frame This blog post gives you REAL-TIME MACD Divergence Analysis for FREE and tips how to trade the divergences: REAL-TIME MACD Divergence Analysis The MACD Multi Time Frame gives you a very good overview o
FREE

QuantumAlert CCI Navigator is a free indicator available for MT4/MT5 platforms, its work is to provide "alerts" when the market is inside "overbought and oversold" regions in the form of "buy or sell" signals. This indicator comes with many customization options mentioned in the parameter section below, user can customise these parameters as needful. Join our MQL5 group , where we share important news and updates. You are also welcome to join our private channel as well, contact me for the pri
FREE

This indicator displays the signals based on the values of the classic WPR indicator. The WPR indicator can be used for determining the overbought or oversold areas on the chart. Reaching these levels means that the market can soon turn around, but it does not give signal, as in a strong trend the market can stay in the overbought or oversold state for quite a long time. As with most oscillators, the signals are generated when leaving these areas. This indicator allows to display three types of
FREE

Do you need precision? Tick charts show each change in the ask or bid; The chart updates whenever either price changes. Study the markets more deeply, with surgical precision. Tick Chart Window saves all the received ticks and shows them into a seperate window. Get the best entry price in the Market. trade with precision trade good Spread Register In the comment section you will see the highest spread, the lowest spread and the average spread since the indicator was loaded.
FREE

Description I think, almost all traders dream about non-lagging MA. I have realized that dream in my indicator. It allows forecasting future MA values! The indicator can be used in four different ways: The first one - forecast for the desired amount of bars. Thus, you are able to evaluate future price behavior. The second one - generating non-lagging "averages". That can be implemented by moving MA back by the half of the averaging period and setting the forecast the necessary amount of bars ahe
FREE

The indicator is designed for intraday trading.
Equipped with all notification functions for convenience in manual trading.
It is recommended to use timeframes m5, m15, m30.
You can also view and select settings for any financial instrument. Settings: Indicator period - Indicator period Alert - The function of enabling alerts. Push notifications - Enabling Push notifications to the mobile terminal e-mail - Sending a signal to e-mail In addition to this product, I recommend looking at my o
FREE

The Oscillators histogram indicator is designed to show the histogram of some oscillator indicators. These oscillators are RSI, Momentum, ATR and CCI indications. Our Popular Products Super Oscillator HC Cross Signal Super Cross Trend Strong Trend Super Signal Parameters Oscillators - indicator name. Period - indicator period. Level indicator - indicator level. MAPrice - applied price for Momentum, CCI or RSI. Alerts - enable/disable alerts. Email Notification - enable/disable Email notifica
FREE
Free - Canais de Fibo com suportes e resistências D1...
Torne-se um trader forex de 5 estrelas constantemente lucrativo!
Oferecemos alguns indicadores para ajudá-lo a entender e analisar o mercado! Com nossas estratégias, você melhorará seu sistema de negociação e se tornará um especialista...
Temos indicadores para direção de tendência, direção de mercado e outros.. para vários prazos e abrange todos os principais ou seus símbolos de negociação favoritos! Alguns deles oferecem parâmetro
FREE
This indicator gives the highest and lowest information of the currency you have selected and the day you selected. It also shows the average. In this way, you can find out the profit / loss probability of your transactions for the same days. Reported: Average points per week Average points per year Lifetime average points Note: It does not provide you with buy / sell signals. Shows average points only
FREE

The Keltner Channel indicator represents a channel along the moving average , with the width defined by calculating the average true range on the period of the moving average. This indicator can be applied for receiving signals, as well as a substitute for the Moving Average Envelopes indicator. Its advantage is the increased quality of channel width auto selection, which can be adjusted using the Size of channel in percent parameter.
Indicator Parameters Period of indicator - calculation peri
FREE
The indicator generates signals for opening positions. The principle of operation is to compare the current closing price with a range of average prices over a longer period. The signals are confirmed when the price exceeds the High/Low of the bar where the indicator generated the signal. Maintenance of an open position is carried out on a smaller TF. Indicator signals to open an opposite position on a smaller TF are a signal to close the deal. This indicator does not repaint or not recalculat
FREE
This is yet another non-parametric ZigZag. Its every upward edge continues until next bar's high is formed below highest low of its bars, and every downward edge continues until next bar's low is formed above lowest high of its bars. In addition to zigzag itself (shown in orange color), the indicator shows signal marks on those bars where zigzag direction changes. The blue arrow up denotes that new bullish edge is started (but not yet completed), whereas the red arrow down denotes that new beari
FREE
The presented indicator colors the chart candles in accordance with the data of the Hull Momentum AM indicator. Coloring of candlesticks depends not only on the location of the oscillator histogram above or below zero. The location of the histogram relative to the signal line is also important. The indicator is part of a series of indicators - Hull Line AM, Hull Momentum AM, Hull Candles AM, Hull Signal AM . For a better understanding of the operation of each of the indicators, it is recommended
FREE
Parabolic Sar easy mode, remake the original p.sar indicator making it more easy to read for novicians traders and experimented traders looking to reduce the time analizing the charts, you can make your own strategy modificating the periods and fusioning it with others indicators like RSI ,stochastic or what you want,its one indicator runs better on high time charts like H4 or D1.
FREE

Supreme Stoploss is an indicator for metatrader 4 that is based on the ATR indicator , it gives stoploss/takeprofit as lines drawn above and below the price , this indicator does not repaint/back paint and is not delayed. can be used to determine the stop loss or take profit of a trade using ATR value multiplied by the number set by user. ====================================================================================================== Parameters : ATR SL period : ATR period identity : leave
FREE
This indicator is a moving average built using the triple exponential smoothing method (T3). The indicator is part of a series of indicators - T3 Line AM, T3 Momentum AM, T3 Candles AM, T3 Signal AM .
The indicator has minimal lag and allows you to effectively follow the trend direction. The indicator is not redrawn on fully formed bars. The indicator is supplemented with signals and notifications to the terminal and e-mail.
The application of the indicator is identical to the application o
FREE
The presented indicator is a trend indicator that displays with a colored line the current direction of price movement and the support/resistance zone in the form of a cloud. The indicator also marks points of change in price direction with arrows that appear after the bar is fully formed. The arrows are not redrawn. The rules for using the indicator are simple: We open a position when the price overcomes the high/low of the bar marked with an arrow in the direction opposite to the cloud. Arrow
FREE
This indicator displays the signals based on the values of the classic DeMarker indicator on the price chart. The DeMarker indicator can be used for determining the overbought or oversold areas on the chart. Reaching these levels means that the market can soon turn around, but it does not give signal, as in a strong trend the market can stay in the overbought or oversold state for quite a long time. As with most oscillators, the signals are generated when leaving these areas. This indicator all
FREE
This indicator allows you to identify a long-term trend and shorter-term price fluctuations. Indicator signals are given only after the full formation of the bar. The indicator can be used to trade any market. The indicator showed the most interesting results on major currency pairs for time periods of one hour or more. Its basic parameters perform well in most situations. At the same time, before starting trading, you should choose the most effective indicator settings for the user's trading st
FREE

This is an adaptive ZigZag based on modification of HZZ indicator (original source code is available in this article ). Most important changes in this version: two additional indicator buffers added for zigzag evolution monitoring - they show cross signs at points where zigzag direction first changes; zigzag range (H) autodetection on day by day basis; time-dependent adjustment of zigzag range. Parameters: H - zigzag range in points; this parameter is similar to original HZZ, but it can take 0
FREE

Информационная панель, которая выставляет уровни покупки продажи и цели для профита на текущий день. Уровни рисуются согласно движению валюты за вчерашний день. Панель вмещает в себя информацию о валютной паре, тенденции на рынке, время до закрытия бара, управление капиталом, рекомендуемый лот, профит в пунктах, а также уровни для покупки и продажи инструмента. Для заключения сделок использовать только отложенные ордера на пробой. Входные параметры Lots - установить текущий лот Risk - риск в про
FREE
This indicator is an implementation of the "One shot - one hit" principle. In the course of work on the creation of this product, an attempt was made to achieve the maximum balance between the sensitivity of the indicator and the effectiveness of its signals. This tool is as reliable and effective as a 45 caliber revolver, but in the same way it requires discipline and understanding of the conditions and purpose of use from its user. The indicator has only one adjustable parameter that determine
FREE
Indicator that displays the current price and the percentage of loss or gain, compared to the previous day.
The benefits you get : Possibility to choose your favorite crosses. Never redesigns, does not retreat, never recalculates. Works on forex and CFD, timeframe from M1 to monthly. Easy to use.
Parameters : FontSize = 20; font size FontType = "Tahoma"; character type Angle = Bottom_Right; angle view (top right .. top left sect ..) Show_Price = true; view the Bid Show_Var = true; see the d
FREE
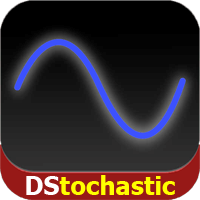
DStochastic is an improved version of the classic Stochastic oscillator with an added moving average. The indicator dampens the market noise, determines the direction of the market and reduces the number of false signals. We have also added a function of multicolor signal line display of increase and decrease by means of dots. The blue dots indicate the development of an ascending trend, the red dots - descending. Similar to all standard oscillators, DStochastic can be combined with all trend in
FREE
This indicator allows to hide ZigZag indicator (on all MT4 timeframes) from a date define by the user with the panel ("Hidden Candles"). This indicator can be use with other "Hidden Indicators". Indicator Inputs: Depth Deviation Backstep Information on "ZigZag" indicator is available here: https://www.mql5.com/en/articles/1537 ************************************************************* Hey traders!! Give me your feeds! We are a community here and we have the same objective.... make some mo
FREE
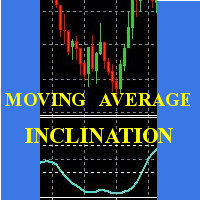
Scalp using the behavior of a short moving average, the indicator gives the slope and identifies the "hyper" moments.
Operational advice:
Use M1 chart. Period 20 : open buy after two rising lows; sell after two max downhill; avoid countertrend openings; when the line goes flat put a stop at the opening price. Avoid actions in low volatility timeslots. When the curve that draws the min / max is very flat, it is better to postpone at least 15'.
Period 50 : matches the trend, when it is at t
FREE
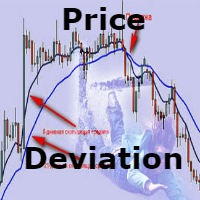
A very simple and intuitive indicator that shows the deviations from the moving average in percent. The default is a 50-day moving average. Just throw on the chart and the indicator build in a separate window under the graph.
This can be very convenient if your strategy implies a certain deviation in percentage of the moving average. It is not very convenient to calculate it manually. The method of averaging, the period of the moving average and at what prices to build all this is selected in
FREE

This indicator provides trading signals based on the polarity of the dynamical parameters of two digital signals. The dynamical parameters (momentum-acceleration) are derived by applying a high quality momentum oscillator, MTEMA LPD ( see Top Gun Oscillators ) to two digital signals. The MTEMA momentum oscillator is first applied to the price itself. Then, a rectification procedure is applied to the price based on the signals from the momentum oscillator yielding a rectified price signal. This s
FREE

Rua Trend Pro This is an indicator that helps identify Trends relatively accurately. Can be used for any currency pair. And usable on all time frames. Recommended use from M15 and above. You can use it to identify trends, or to identify reversals very well. Input parameters: in_TradePeriod in_StopPeriod in_Alerts A product of Ruacoder Provide code indicator and EA services upon request
FREE
An indicator for analyzing different currency pairs simultaneously Forex is a complex market that requires several currency pairs to be analyzed simultaneously Determine the number of currency pairs yourself Determine the currency pair you want to analyze to analyze 4 of the most important and similar currency pairs at the same time. For direct and simple analysis, some currency pairs have changed (EURUSD>>>USDEUR) Do not doubt that to succeed in this market, you must analyze several currency pa
FREE

Classic indicator. The Fractals indicator analyzes the price patterns that form on the candlestick chart and display the reversal points of the market trend. The indicator consists of candles, the middle of which is either the highest (up fractal) or the lowest (down fractal). Highs and lows, indicated by the indicator on the chart, are recommended to be taken as points that form support and resistance lines. Unlike the original indicator, where fractals are formed by five candles (high/low in t
FREE

Introducing Demarker Jurik—an innovative indicator poised to revolutionize your forex trading strategy. This indicator combines the precision of custom moving averages based on the Demarker indicator with the MetaTrader 4 indicator, Demarker.
Jurik moving averages are renowned for their accuracy and reliability in analyzing price movements in the forex market. They offer traders smoother representations of price action, filtering out noise and providing clearer signals for identifying trends
FREE

The purpose of this new version of the MT4 standard indicator provided in your platform is to display in a sub-window multiple timeframes of the same indicator. See the example shown in the picture below. But the display isn’t like a simple MTF indicator. This is the real display of the indicator on its timeframe. Here's the options available in the FFx indicator: Select the timeframes to be displayed (M1 to Monthly) Define the width (number of bars) for each timeframe box Alert pop up/sound/ema
FREE
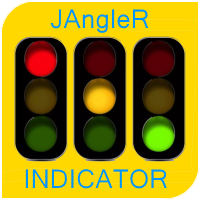
The oscillator indicator " JAngleR " is one of a series of three calculators of the angular deviation of the price chart of a trading instrument.
INPUT PARAMETER: DRAWs =128 - Number of bars to display the indicator in the chart history; Period_IND =14 - calculation period of the indicator in the number of bars; ma_period =1 - Moving Average Period; ma_method =MODE_SMA - moving Method; applied_price =PRICE_CLOSE - applied Moving Average Price. The values of the indicator indicators are degree
FREE

Concept
Market arranges in Time upcoming Phases according to the present Results of its Interest. Directing Modulations are an Interaction of immanent Periods, which show in Reference to Time cyclic Activity and to Price leveling Activity. SensorMap is a reflecting Volume Mask of this Concept of Time and Price and apportioning developed Price Movements in an equalized 100 % - Range: how far moved ? indicating their Status by marking special Events: when which Action ? setting the Situation in
FREE

The Choppy Market Index (CMI) is an indicator of market volatility. The smaller the value of the indicator, the more unstable the market. It calculates the difference between the closing of the last bar and a bar n periods ago and then divides that value by the difference between the highest high and lowest low of these bars.
Features Easily separate trends from the market noise The indicator is non-repainting. Returns CMI values through buffer. (see below)
Inputs Period: The number of perio
FREE

The WTR Dynamic Range Indicator is a powerful and deeply customizable range indicator that takes in account the average upward and downward movement of the price in the past trading days. This fully customizable indicator can be setted for a lot of uses and cases:
• Trend trading on level breakouts
• Spotting high probability targets for Take Profits
• Setting a multiple targets for position scaling out The WTR Dynamic Range Indicator calculates the average movements in the long side, the
FREE

This Dashboard is free to download but is dependent on you owning the Advanced Trend Breaker . Get the indicator here: https://www.mql5.com/en/market/product/66335
The Dashboard will show you on a single chart all the timeframes (M1 to Monthly) with their own status for the indicator: Advanced Trend Breaker
all time frame and all symbol: smart algorithm detects the trend,Support and resistance, filters out market noise and find breaker of entry signals!!!
!!!
How t
FREE

O indicador MACD (Moving Average Convergence Divergence) é uma das ferramentas de análise técnica mais amplamente utilizadas pelos traders em todo o mundo. Criado por Gerald Appel na década de 1970, o MACD é um indicador que ajuda os investidores a identificar a direção da tendência, a força da tendência e possíveis pontos de reversão de tendência. O indicador MACD é composto por um histograma que mostra a diferença entre a média móvel exponencial de 12 períodos e a média móvel exponencial de 26
FREE
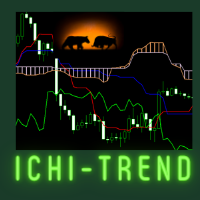
Welcome to our page This indicator is suitable for any time frame but our recommended time frames are 30M and above. Perfectly working with all pairs. Buy Call: When the candle has been crossed above the ichi cloud. (See the Screenshot Attachment) Sell Call: When the candle has been crossed below the ichi cloud. (See the Screenshot Attachment) Happy and profitable trade !!!
FREE
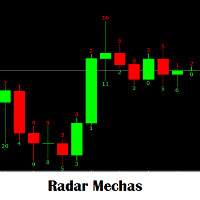
Indicador que serve para observar o tamanho do pavio que sai das velas de acordo com o tamanho que gera um alerta para fazer entradas manuais. Aproveite ao máximo que uma estratégia coloca espaços do tamanho do pavio da vela anterior ou da mesma vela atual. entrar para comprar e vender. É um indicador necessário para qualquer análise que seja feita para uma nova entrada. Será sua ferramenta favorita.
FREE

The purpose of this new version of the MT4 standard indicator provided in your platform is to display in a sub-window multiple timeframes of the same indicator. See the example shown in the picture below. But the display isn’t like a simple MTF indicator. This is the real display of the indicator on its timeframe. Here's the options available in the FFx indicator: Select the timeframes to be displayed (M1 to Monthly) Define the width (number of bars) for each timeframe box Alert pop up/sound/ema
FREE

This indicator alerts you when indicator-created lines are "touched" by price, You can change the interval between alerts. You can change colors and styles of lines as you want. However, lines must be named "Upper" and "Lower.
There is a more powerful PRO version .
Input Parameters WaitTime: Interval between alarm.
How To Use Place lines wherever you want to add alarms.
FREE
Saiba como comprar um robô de negociação na AppStore do MetaTrader, a loja de aplicativos para a plataforma MetaTrader.
O Sistema de Pagamento MQL5.community permite transações através WebMoney, PayPay, ePayments e sistemas de pagamento populares. Nós recomendamos que você teste o robô de negociação antes de comprá-lo para uma melhor experiência como cliente.
Você está perdendo oportunidades de negociação:
- Aplicativos de negociação gratuitos
- 8 000+ sinais para cópia
- Notícias econômicas para análise dos mercados financeiros
Registro
Login
Se você não tem uma conta, por favor registre-se
Para login e uso do site MQL5.com, você deve ativar o uso de cookies.
Ative esta opção no seu navegador, caso contrário você não poderá fazer login.