MetaTrader 5용 기술 지표 - 48

The indicator predict the future candles direction, by scanning past candle movement. Based on the principal: “ The history repeat itself”. Programmed according to Kendall Correlation. In the settings menu, different scanning options are available. When the indicator find a match, start painting future candles from the current candle to the right, also from the current candle to the left as well, showing you the candle pattern what the actual signal is based on. The left side candle are option

A regression channel based on roughened fractals.
Parameters:
Period ReCalculate - indicator calculation period
switch Zero (Last) Bar-count the last open bar?
switch Push notifications when changing the position of the rounded price relative to the channel
Line Risk-displaying the risk line
Coeff Risk,% - the maximum percentage in the transaction as a percentage
The channel allows you to evaluate the trend and its strength in the market and correctly place a request for a transaction wit

Indicador Para Opções Binarias. Indicator for Binary Options Usa dois gales. Instalar em mt5 Esse indicador é para ser usado no tempo de vela de 5 minutos e em M5. Este também funciona em M1, porém é mais eficiente em M5. Só descompactar e copiar os arquivos na pasta de dados do seu MT5. Arquivos indicator na pasta MQL5 - Indicator. Baixe também a Media Movel totalmente gratis:
https://www.mql5.com/pt/market/product/50400
Esse Indicador é para a próxima vela. Apareceu a seta, só aguardar a pr

The principle of this indicator is very simple: detecting the trend with Moving Average, then monitoring the return point of graph by using the crossing of Stochastic Oscillator and finally predicting BUY and SELL signal with arrows, alerts and notifications. The parameters are fixed and automatically calculated on each time frame. Example: If you install indicator on EURUSD, timeframe M5: the indicator will detect the main trend with the Moving Average on this timeframe (for example the Moving

Multi Andrew PitchFork ANDREW’S PITCHFORK TRADING STRATEGY Essentially, Andrew’s Pitchfork is a tool for drawing price channels. While two lines surrounding price are usually enough to draw a channel, the Pitchfork has an extra line. It is the median line or the handle of the Pitchfork. The median line is central to this trading method. This is why Andrew’s Pitchfork is also known as the Median Line Method. TRADING RULES There are many ways to trade using Andrew’s Pitchfork but

The principle of this indicator is very simple: detecting the trend with Moving Average, then monitoring the return point of graph by using the crossing of Stochastic Oscillator and finally predicting BUY and SELL signal with arrows, alerts and notifications. The parameters are fixed and automatically calculated on each time frame. Example: If you install indicator on EURUSD, timeframe M5: the indicator will detect the main trend with the Moving Average on this timeframe (for example the Moving
This trading system is based on market impulses of varying complexity.
To generate a signal, the indicator uses the moments when the direction of the pulse and the necessary section of the trend coincide. The indicator also takes into account the current market volatility. Stop_loss tags can be set with the parameter "0" or "1", then Stop_Loss will take into account market volatility.
Take_Profit tags can be set with the parameter "0", then Take_Profit will take into account market volat

Relative Strength Ratio (RSR)
The Relative Strength Ratio (RSR) indicator compares the performance of one security against another, dividing the base security by the comparative security, and showing the ratio of this division in a line c hart. This indicator is also known as the Relative Strength indicator, Price Relative , or Relative Strength Comparative .
It is one of the main tools for Intermarket Analysis professionals, to help them identify Sector Rotations and other global relations
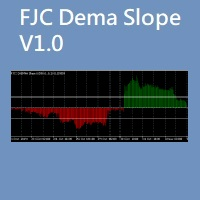
FJC Dema Slope indicator helps finding and meassuring trend force better than Ema or Dema Alone. You can set levels for filtering low force trends and for detecting exit trade point when the trend force is reducing. Bullish trend shows in green color and Bearish trend in red. It can be use for manual trading but you can also use it when programming EAs, this is an example of use: demaSlopeHandle[i]=iCustom(NULL,PERIOD_CURRENT,"::Indicators\\FJC_DEMA_SLOPE.ex5", 500, PRICE_CLOSE, 0.0,1);

Description
ABC Trend Levels is an indicator that identifies market trends and important trend support and resistance levels.
Recommendations
You can use this indicator to determine the trend and, accordingly, to determine the direction of opening a position or closing an opposite position.
Parameters
===== _INDICATOR_SETTINGS_ ===== - indicator settings Maximum History Bars - maximum number of history bars for calculating the indicator. Average True Range Period - ATR indicator p
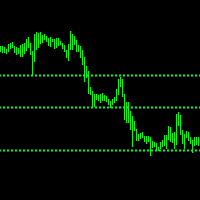
Description
ABC Trend Levels Pro is an indicator that identifies market trends and important trend support and resistance levels.
Recommendations
You can use this indicator to determine the trend and, accordingly, to determine the direction of opening a position or closing an opposite position.
Parameters
===== _INDICATOR_SETTINGS_ ===== - indicator settings Maximum History Bars - maximum number of history bars for calculating the indicator. Average True Range Period - ATR indicat

The indicator shows buy and sell signals. The " CounterTrend 5 " is designed to recognize profitable counter trend patterns from your chart. Features: The CounterTrend 5 is a Counter-Trend Trading with Simple Range Exhaustion System. Signals based on the daily trading range. The indicator calculates the trading range for the last few days and compare the price movements on short time intervals and generating short term reversal points. This is a leading indicator. It works on any instruments.

The Decision indicator determines the long-term and short-term trend. The indicator allows you to examine in more detail the real and historical market trends! Shows the opening points of transactions for sale or purchase, and also indicates the direction of the trend for: short-term and long-term periods. The analysis is based on the selected timeframe.
The indicator not only signals an immediate purchase or sale. It indicates a short-term and long-term trend. operations. The easiest way to

Horizontal Level indicator - reflects, using a histogram, the horizontal volumes of transactions at a certain price without reference to time. At the same time, the histogram appears directly in the terminal window, and each column of the volume is easily correlated with the quote value of the currency pair. The volume of transactions is of great importance in exchange trading, usually an increase in the number of concluded contracts confirms the trend, and their reduction indicates an imminent

Classical ADX revamped to provide faster and more solid trading signals. This indicator calculates ADX values using standard formulae, but excludes operation of taking the module of ADX values, which is forcedly added into ADX for some reason. In other words, the indicator preserves natural signs of ADX values, which makes it more consistent, easy to use, and gives signals earlier than standard ADX. Strictly speaking, any conversion to an absolute value destroys a part of information, and it mak

En base a cálculos matemáticos de determino una linea Horizontal que cruza a todas las señales de trading, mostrando los máximos y mínimos. La linea horizontal parte en dos las subidas y bajadas de las señales de trading, de tan manera que es fácil identificar los máximos y mínimos, y es inteligente por que es sensible a las subidas y bajadas, afín de no quedarse en un solo lado por siempre, trabaja excelentemente con otros indicadores suavizadores ya que les garantiza que en un intervalo de tie

Display the date, time and price according to the movement of the mouse cursor on the chart This is useful for discretionary trading.
It is an indispensable tool for verifying and studying past market prices and trades. Large and easy-to-read characters It is easy to see even if your eyesight is weak.
Also, you can tell the date and price to YouTube and webinar viewers in an easy-to-understand manner. Characteristic Date,Time and Price are displayed. The value follows the movement of the mous

Buy and sell signals based on Larry Williams's exponential moving average strategy 9.1 for trend reversals.
How does it work? The indicator activates the buy and sell signal when a candle closes turning the 9 period EMA.
How to use it? One way of using it, proposed by Larry Williams, is to enter a trade with a buy stop order one tick above the high of the candle with the buy signal, placing the stop loss order one tick below the candle's low. When there's a sell signal instead, place a sell

The principle of this indicator is very simple: detecting the trend with Moving Average, then monitoring the return point of graph by using the crossing of Stochastic Oscillator and finally predicting BUY and SELL signal with arrows, alerts and notifications. The parameters are fixed and automatically calculated on each time frame. Example: If you install indicator on EURUSD, timeframe M5: the indicator will detect the main trend with the Moving Average on this timeframe (for example the Moving

Tool that allows viewing candles in multiple timeframes. This way, it helps the analysis in multiple timeframes.
This is another product developed by Renato Fiche Junior and available to all MetaTrader 5 users!
Input Parameters
- Option 1 - TimeFrame: Standard MT5 timeframe - Option 2 - Custom TimeFrame (in minutes): Or, if this value is different from zero, the timeframe will be customized. This allows you to choose timeframe other than the MT5 standard. - Total Candles: Number of candle

The Glider indicator gives accurate and timely signals to enter and exit the transaction that appear on the current candle. Using the indicator is very simple. When a dot and a blue line appear, open a buy deal. When a dot and a red line appear, open a sell deal.
The main purpose of this indicator is to determine the moments of entry and exit from transactions, therefore the Glider indicator will display only the trend line and entry points, i.e. displays displays the entry points to the mark

Want to make the graph cleaner?
Don't you use the opening price in your analysis?
Want to use a chart model that was used by Richard Wyckoff?
Then you need to know the Color HLC Candles and Bars indicator. In the same indicator you can switch to the display of candles or bars.
Take a look at the other volume indicators to complement your operating. And don't forget to look at the best Vwap Custom (Midas)!
Leave your comment!
Success and good trades!

The Mercadulls Indicator gives to you many signals types, detecting supports, resistances and accumulation/distribution zones. The indicator constantly checks the graph for direct analysis and the appearance of long trends. Main characteristics No repaint! Stop loss and take profit levels are provided by the indicator. Suitable for Day Traders, Swing Traders, and Scalpers. Optimized algorithm to increase the accuracy of signals. Technical analysis indicator for all assets available in the m

This Indicator draws Fibonacci Arc levels in two different ways. You can select whether to draw Fibonacci Arc levels based on your favourite ZigZag settings or you can let the indicator to draw Arc levels based on given number of bars or candles. You can also set Mobile and Email notification for your favourite Arc levels individually. With this indicator you will not have to feel lonely as the it can generate Voice alerts, which will keep you focused on your trading and remove boredom. Produc

Delta Single Volume is a very powerful indicator that reads the supply on the Market.
It calculates the Delta from movement of the price and the difference of BUY and SELL volumes. Its special structure allows you to get all timeframe values available on the MT5 platform. It works on Tick Volumes and Real Volumes (if avalaibles on your Broker). A good observation of this instrument can suggest great entry points and possible reversal. We are confident that this tool will help you to improve yo
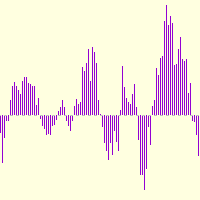
Ara metod , индикатор-осцилятор. Создан для отображения вероятных экстремумов. Представляет из себя гистограмму отображающую вероятные изменения цены. Преимущества , не перерисовывается, прост в настройках. Будет полезен как основной инструмент для поиска сигналов для входа, так и как дополнительный инструмент подтверждения точек входа. Из настроек только один параметр Reg_Period , допустимые значения от 10 до 1000, рекомендованные 120-480 .
Ara volatility - это индикатор волатильности, показывает силу трендового движения. Удобен в использовании. Не перерисовывается. Для расчёта индикатора была применена авторская разработка. Индикатор будет вам очень полезен как самостоятельный инструмент показывающий периоды тренда или затишья. Также индикатор может служить как дополнительный фильтр к вашей торговой системе. Ara volatility очень прост в настройках, всего один параметр Period Volatility . Рекомендуемые значения от 24 до 1000.

Description
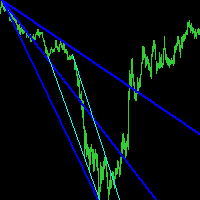
Reverse Rayer is an indicator that draws rays on inclined trend levels.
Recommendations
You can use this indicator to determine the trend and, accordingly, to determine the direction of opening a position or closing an opposite position.
Parameters
===== _INDICATOR_SETTINGS_ ===== - indicator settings Maximum History Bars - maximum number of history bars for calculating the indicator. Average True Range Period - ATR indicator period (used to calculate the difference be
Description
Reverse Rayer Pro is an indicator that draws rays on inclined trend levels.
Recommendations
You can use this indicator to determine the trend and, accordingly, to determine the direction of opening a position or closing an opposite position.
Parameters
===== _INDICATOR_SETTINGS_ ===== - indicator settings Maximum History Bars - maximum number of history bars for calculating the indicator. Average True Range Period - ATR indicator period (used to calculate the differenc

Automatic cataloging of probabilistic strategies for Binary Options.
Including: * MHI 1, 2 and 3, "MHI potencializada", M5 variation, Five Flip, "Padrão do Milhão", "Três Vizinhos", C3 and Turn Over. * Analysis by time range, date, and days of the week. * Function that brings results from other pairs. * Analysis only following trend and / or side market. * Operation analysis filtering only entries after hit. * Alert after x number of hits, after loss in martingale, or in each new quadrant ent

This indicator draws price channels. Easy to use. It has various settings, for example, you can configure it to show channels only for buy or sell, you can display trend lines instead of channels. There are many trading strategies that are based on trading in channels, you can trade on the rebound from the borders of the channels, or the breakdown of the channel. Parameters History - the maximum number of bars for building channels; Distance - the minimum distance from one maximum (or minimum

Эта панель предназначена для быстрого визуального поиска паттернов "price action" по нескольким торговым инструментам одновременно. Есть возможность добавлять и удалять торговые инструменты. По клику на сигнальную кнопку осуществляется быстрый переход на график с данным паттерном и таймфреймом. Панель ищет 8 свечных паттернов: PIN-BAR, EXTERNAL BAR, INSIDE BAR, DOJI, LEVEL, HIGH/LOW OF N BAR, FAKEY, ONE-WAY N BAR. Отключение любого из паттернов осуществляется кликом по его заголовку. Также имеет

Description The indicator uses market profile theory to show the most relevant trading zones, on a daily basis. The zones to be shown are LVN (low volume nodes) and POC (point of control). An LVN zone is one which represents price areas with the least time or volume throughout the day. Typically, these areas indicate a supply or demand initiative, and in the future, they can turn into important breakout or retracement zones. A POC zone is one which represents price areas with the most time or vo

The OCTO Indicator is a new and easy to use zero-crossing trend/trend reversal indicator that provides entry signals for both long and short positions. It is based on High/Low divergence and correlation of the values over time.
Reliability of the indicator has been backtested with an example trading robot.
How to use The OCTO indicator is added in a separate window, showing a red and a green indicator line, as well as the zero line for crossing. You can see an example of the standard look a
The Martinware Direction by Candle Body Analysis indicator is a direction indicator that shows the current asset direction, up or down, by checking if previous candle bodies' bases were respected or broken. It works similarly to a moving average, but it's more objective due to its lesser amount of configuration parameters.
The algorithm assumes the theory that although the highs and lows of candles have their value, it is the body that shows the conclusive market sentiment over that asset in

The Recorder indicator, in addition to the trend direction, shows a change in the angle of inclination, the analysis of which allows you to filter signals using angle filters, this can be used to build a bot with this signal indicator based on it. This indicator is very sensitive to current price activity and displays signals rather well.
The color version of the indicator signals a trend change. The indicator allows you to see a rising or falling trend. Quickly responds to a trend change, cl

By launching the Trend Info indicator, the user will see two lines and bars of different colors, which can change color to green during an uptrend, to red during a downtrend or to be yellow during an uncertainty. The indicator is based on the calculation of price values, in order to answer questions about what direction the trend is acting on the market at the moment and when this trend will end.
The trader uses the Trend Info indicator to determine the market situation. This is a trending al

I recommend you to read the product's blog (manual) from start to end so that it is clear from the beginning what the indicator offers. This multi time frame and multi symbol indicator scans for engulfing and tweezer formations. The indicator can also be used in single chart mode. Combined with your own rules and techniques, this indicator will allow you to create (or enhance) your own powerful system. Features Can monitor all symbols visible in your Market Watch window at the same time. A

The Market Time indicator shows in a simple and objective way the opening hours of the main exchanges in the world. Define the number of days to be displayed and choose the options available for the appearance of each vertical line of each market in the indicator. With this Market Hour indicator you will be able to see the opening hours of the main markets in the world more easily and quickly. Note that the opening time of each market to be inserted in the indicator is the time of your broker's

the indicator will show signal arrows on the graph at the crossing of a given level it has push and audible alerts. By crossing from low to high level 0.3, a blue arrow will come out for the purchase, at the same time an audible signal will sound. By crossing from low to high level 0.7, a red arrow will come out for the sale, at the same time an audible signal will sound. Possibility to deactivate push and audible alerts. MT4 version of this product here
Simple trend mt5 is a professional version of the trend indicator and entry points. It uses Price action and a unique filtering algorithm to determine the trend. Shows the change in the direction of price movement on any currency pairs, without redrawing the result. Suitable for determining entry points for scalping and swing, as well as for intraday, medium-term trading. Features Marks trend reversal locations and directions. Suitable for all types of trading, in any markets. Allows you to en

The Trend Mix indicator reliably monitors the market trend, ignoring sharp market fluctuations and noise around the average price. This is a promising arrow indicator. He catches the trend and shows favorable moments of entering the market with arrows. The indicator can be used both for pipsing on small periods, and for long-term trading. The indicator implements a kind of technical analysis based on the idea that the market is cyclical in nature.

The Tik Tok indicator was created on the basis of the original extreme search indicators, the indicator is well suited for determining a reversal or a big sharp jerk in one direction, thanks to it you will know when this happens it will notify you when a blue dot for buying red for sale appears.
It basically uses the process of detecting the rate of change in price growth and allows you to find entry and exit points from the market. fundamental technical indicator that allows you to assess th

SYSTEM INTRODUCTION: The Binary Options Conqueror System Is Specifically Designed For Binary Options Trading. Unlike Other Systems And Indicators That Were Adopted From Other Trading Environments For Binary Options. Little Wonder Why Many Of Such Systems Fail To Make Money . Many End Up Loosing Money For Their Users. Forward Testing Of The System Has Shown Remarkable Results . The Results Of Forward Testing On Live Trading Account Is Consistent With The Results Obtained By Back Testing .

ichimoku indicator with alert; audible alert, email alert, push alert you can enable or disable the settings as you wish When there is a crossing of tenkansen and kijun you will get an alert When there is a cross between Senkouspan A and Senkouspan B you will get an alert Affordable sound settings possibility to modify the parameters of the ichimoku indicator
The indicator tracks the trend in 5 different chart times for the same asset, based on 6 signals for each chart time.
The main objective of the indicator is to show us the majority trend of the financial asset in which it was placed. The system transmits the information of the trends in several graphic times, in this way the user is able to have a broad view of the movement of the asset, this type of tool makes the user have a higher hit rate by helping the operator to execute orders in favor

The Trend Rendezvous indicator searches for and displays pivot points on the price chart. The goal, which was pursued during its creation, is to obtain signals that will produce less noise and respond more quickly to price changes. The Trend Rendezvous indicator is a trend indicator that is used to search for reversals in the breakdown of its borders. The indicator is its signal and has one interesting property. It is necessary to take into account that this indicator reflects extrema and shoul

The implementation of the Trend Self trend indicator is simple - in the form of two-color lines. The indicator will help users determine the direction of the trend. It will also become an indispensable adviser for entering the market or for closing a position. The indicator algorithm is based on standard indicators as well as their own mathematical calculations.
How to read information from the indicator. We buy when the color of the indicator line changes from pink to green. Hold a long

TRADE EXTRACTOR is the fastest self-learning AI Algorithm, which will learn any market situation with ease.As a Manual trader, I came across the difficulty of finding the right parameter and the right condition to trade. There are infinite combinations of indicators and objects(trendlines, gann grid, fibo levels etc) which as an human, I can’t decide their winning rate or performance. Many claim to have a winning strategy but won’t have enough statistical support to prove their claims. Due to

Indicator designed to measure the distance from the price on a given moving average.
The indicator, in addition to displaying the value of the spacing, has an average of the spacing itself, to assist and confirm analyses. Both the type of the average and the average on which the spacing value will be calculated, as well as the spacing average, are parameterizable.
With the option "SET AUTO LEVEL AND SHOW SIGNALS" enabled, the indicator displays buy and sell signals on the graph. Buy and

Due to the fact that at each separate period of time, trading and exchange platforms from different parts of the planet are connected to the trading process, the Forex market operates around the clock. Depending on which continent trading activity takes place during a certain period, the entire daily routine is divided into several trading sessions.
There are 4 main trading sessions: Pacific. European. American Asian This indicator allows you to see the session on the price chart. You can als

this indicator is a Spike detector indicator, it is specially designed to trade Boom 1000, Boom 500, Crash 1000 and Crash 500 We recommend using it on Deriv Boom and Crash indices only Its setting is intuitive, familiar, easy to use it has notification functions; audible notifications and push notifications. this tool is simple to use, easy to handle This update is based on different strategies for spikes

Buy and sell signals based on Larry Williams's exponential moving average strategy Setup 9.2 for trend continuation.
How does it work? The indicator activates the buy signal when a candle closes below the previous low while maintaining the 9 period EMA's upwards. For a sell signal, we need a candle closing above the previous high while maintaining the 9 period EMA's downwards.
How to use it? One way of using it, proposed by Larry Williams, is to enter a trade with a buy stop order one ti

Buy and sell signals based on Larry Williams's exponential moving average strategy 9.3 for trend continuation.
Who is he? Larry Williams is an American stock and commodity trader, author of 11 books and creator of indicators such as the "Williams%R" and the "Ultimate Oscillator", with over 60 years of trading experience. Won the 1987 World Cup Championship of Futures Trading, turning $10,000 to over $1,100,000 in 12 months with real money. Ten years later, his daughter Michelle Williams won t
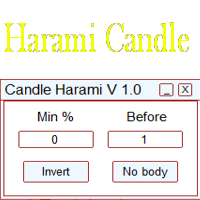
Это простой индикатор, показывающий формирование свечей харами. Входные параметры:
Min % - минимальный процент харами Before - количество свечей до сигнала Invert - инвертировать сигналы No Body - свечи без тела Length - настройка для отображения сигналов В индикаторе есть встроенный фильтр по количеству свечей до сигнала и минимальному проценту харами. Более подробно о настройках индикатора можно прочитать на моем сайте.

Buy and sell signals based on Larry Williams's exponential moving average strategy 9.4 for failed reversals and trend continuation.
How does it work?
For an uptrend, we need a candle turning the 9 period EMA down and closing below it, followed by a candle turning the 9 period EMA up and closing above it, with a low higher than the previous candle's low. For a downtrend, we need a candle turning the 9 period EMA up and closing above it, followed by a candle turning the 9 period EMA down and
MTF-MA2 for MT5 特徴: MTF Moving Averageを8本一気に表示してくれるインジケータになります。 8本も必要ない場合にももちろん非表示にできます。
パフォーマンスを考慮しているのでチャートが重くなるようなことは 無いはずになります。どの通貨でも使用可能になります。 それぞれのMTF Moving Averageの色や太さを変更できます。
各パラメータの説明: Method:MAの種類設定をします。 Applied price:MAで使用する価格を設定をします。 TimeFrame M5:使用するMAの時間足を設定します。 Period M5:使用するMAの期間を設定します。 ※ラベルに関係なく8本のMTF MAはどの時間足でも期間設定可能になります。
Limited bar?:表示に使用するバーを制限するかどうかを設定します。 ※ここをFalseにするとすべてのバーを読み込むことになるのでチャートが重く なるかもしれません。ご注意ください。 Max bars:使用するバーの本数を設定します。過去検証をする場合にはここの値を増や

MTF-Candlestick (Traders Club)
特徴: このインジケータは上位足のローソク足を表示します。 この上位足のローソク足を表示のインジケータは特に1分足や 5分足トレーダ用に開発されたものになります。
現在のローソク足で上位足のローソク足を作成する部分 と過去の上位足のローソク足を作成する部分を 分けています。また、更新はティックごとではなく 指定した時間ごとになるので急な価格変動があった場合でも チャートがフリーズした状態には非常になりにくいということになります。
陽線や陰線の色を変更出来たり髭の太さを変更できるので非常に 見やすと思います。
各パラメータの説明: Indicator No:インジケータNoを設定します。もし同じチャートに複数適用したい場合には個々の数字を変更してください。 TimeFrame:表示する時間足を設定します。 Bullish candlestick color:陽線のローソク足の色の指定します。 Bearish candlestick color:陰線のローソク足の色の指定します。 Doji c
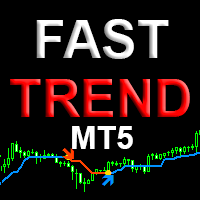
Fast trend - профессиональная версия индикатора определения направления тренда и точек входа. Индикатор с высокой вероятностью определяет направление тренда на любых валютных парах, акциях, криптовалюте без перерисовки результата. Для определения тренда использует Price action и авторский уникальный алгоритм фильтрации. Подходит для всех видов торговли, как для скальпинга так и для долгосрочной торговли. Данная версия индикатора это другая ветка эволюции алгоритма индикатора Simple Trend

Join Deriv link on profile>>>
The best time to trade Using this Indicator is when the time reach exactly hour,half,45 minutes,15 minutes and sometimes 5 minutes..
This indicators is helpful to those who trade boom and crash indecies.How to read this indicator first you'll see Blue allow and Red allow all these allows used to indicate or to detect the spike which will happen so the allow happens soon before the spike happen.This indicator works properly only in boom and crash trading thing

This multi symbol indicator has been designed to automatically identify when price reaches major psychological levels. Also known as round numbers, whole numbers or key levels. As a bonus it can also scan for pivot point level on one selected time frame. Combined with your own rules and techniques, this indicator will allow you to create (or enhance) your own powerful system. Features Can write the signals to a file which can be used by an Expert Advisor for auto trading. Can monitor all symbols
Dragon SuperTrend OB indicator
he Dragon was an indicator developed to capture a new beginning of the trend, it is excellent in Binary Options and Forex and even B3 in the Mini Index and Mini Dolar. It has 4 trend levels in 4 different Times Frames, so you can be sure that you are on the right side of the trend! It is very simple and easy to use, in the end I explain how we will operate with the indicator!
Confirmation modes First Line Trend Confirmations: Green Square Upward Trend. Red Squ

An algorithm to detect a spike instantly with zero lag.. Use default settings for "Crash And Boom" This smart algorithm detects a spike, which can be use to filter out market spikes, give entry signals with exit. Trading:- Booming for Boom and Crashing for Crash
Spike Signal:- The less you decrease the more signals
Multiplier:- This multiplies the Signal
Time Ratio:- For adjusting the Signal
AlertProperties = "====== Alert Properties ======";
SendAlertViaAlertWindow:- if set to true it wil

Representation of the intercept value of the linear regression and the mean absolute deviation symmetrically to the intercept value.
PARAMETERS
• Periods: number of periods to calculate linear regression
• Amplitude: multiplier of the absolute mean deviation to define the bands
• Displacement: displacement on the horizontal axis
• AppliedPrice: price on which the calculations are made
• MainPlot: display of the main plot
• UpperPlot: display of the upper band
Representation of the slope value of the linear regression. It has a reference plot to visually determine changes in the slope value (acceleration / deceleration of the price).
PARAMETERS
• Periods: number of periods to calculate linear regression
• PeriodsReference: number of periods for the calculation of the moving average on the values of the main plot
• Displacement: displacement on the horizontal axis
• AppliedPrice: price on which the calculations are made
•

This indicator recognizes a special type of Inside Bar formation which is formed by a big Master candle followed by 4 smaller candles (please see the strategy explanation below). Features Plots buy/sell stop lines on the chart as well as well as take profit and stop loss levels. The TP/SL levels are based on the Average True Range (ATR) indicator. Object colors are changeable. Sends you a real-time alert when a Master candle formation is identified - sound / popup / email / push notification. On

The indicator tracks the trend in 5 different chart times for the same asset, based on 6 signals for each chart time.
The main objective of the indicator is to show us the majority trend of the financial asset in which it was placed. The system transmits the information of the trends in several graphical times, in this way the user is able to have a wide view of the movement of the asset, this type of tool makes the user have a higher hit rate by helping the operator to execute orders in fa
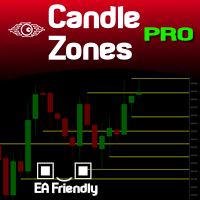
You probably heard about Candlesticks behaviors, which in most of the times could denote and trace Volume behaviors even if you are not watching Volume itself... Well, this indicator will do this. Naked traders love to rely solely on candlesticks patterns and with Candle Zones you can trap special patterns and DRAW THEM on your chart. As simple as that. There are several filters you can tweak in order to achieve the analysis you want. Just give it a try. After several months of testing, we think

AKT for MT5 (Traders Club)
機能: MAゴールデンクロスで買いサイン、デットクロスで売りサインを表示します。 MAの期間は短期足と長期足を入力できます。 MAの種類を選択できます。(SMA、EMA、SMMA、LWMA) 適用する価格を選べます。(CLOSE,OPEN,LOW,HIGH,MEDIAN,TYPICAL,WEIGHTED) サインをアラートで通知します。 サイン発生をE-mailやSNSで通知します。 表示するサインを変更することが出来ます。
サインの色を変更することが出来ます。
サインの表示された時間と価格が表示されます。
※価格は終値になります。
Indicator Noを変えることによるこのインジケータを複数適用することができます。
これにより違う MAの期間による ゴールデンクロスと デットクロスのサインを
表示できます。

Very special indicator of Joe Dinapoli which is a derivative from traditional MACD indicator. It shows the precise price, at which MACD will show line crossing and trend shifting. Also, this level is known one period ahead of time.You can constantly reassess your current position by looking at this studying a variety of timeframes. When you are in a trade, you have a feel for how much time you have for the trade to go your way by looking at the distance between the MACD Predictor line and the
MetaTrader 마켓은 개발자들이 거래 애플리케이션을 판매할 수 있는 간단하고 편리한 사이트이다.
제품을 게시하고 마켓용 제품 설명을 어떻게 준비하는가를 설명하는 데 도움이 됩니다. 마켓의 모든 애플리케이션은 암호화로 보호되며 구매자의 컴퓨터에서만 실행할 수 있습니다. 불법 복제는 불가능합니다.
트레이딩 기회를 놓치고 있어요:
- 무료 트레이딩 앱
- 복사용 8,000 이상의 시그널
- 금융 시장 개척을 위한 경제 뉴스
등록
로그인
계정이 없으시면, 가입하십시오
MQL5.com 웹사이트에 로그인을 하기 위해 쿠키를 허용하십시오.
브라우저에서 필요한 설정을 활성화하시지 않으면, 로그인할 수 없습니다.