MetaTrader 4용 새 Expert Advisor 및 지표 - 270

The indicator is based on the analysis of interaction of two filters. The first filter is the popular Moving Average. It helps to identify linear price movements and to smooth minor price fluctuations. The second filter is the Sliding Median. It is a non-linear filter. It allows to filter out noise and single spikes in the price movement. A predictive filter implemented in this indicator is based on the difference between these filters. The indicator is trained during operation and is therefore

The arrow indicator 'Magneto Flash" is based on candlestick analysis and does not use built-in terminal indicators. It determines entry points in the current candlestick (a signal can be canceled) and informs about a confirmed signal on the next candlestick.
Indicator setup and use Only two parameters can be used for optimization - the hour of the beginning and end of chart analysis period. These data for some instruments will be available in product comments page, but you can easily find your
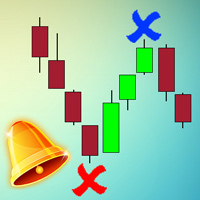
The MACD_stopper_x2 indicator shows where the trend has a tendency to stop or reverse. It uses the standard MACD indicator and a proprietary formula for processing data obtained from MACD. There are 2 types of stop/reversal signals: Small cross - probability of a trend stop/reversal is 70-80% Large cross - probability of a trend stop/reversal is 80-80% If there are open trades (for example, BUY) on the symbol the indicator is attached to, and the BUY trend ends, the indicator sends push notifica

Every successful trader knows what support and resistance spots are working. And always know that these points need to be kept in mind. They always trade according to this point. The support and resistance point indicator operates in two different modes. The first is the standard support and resistance points we know. The second is Fibonacci levels. This indicator automatically calculates and displays the support and resistance points on the screen.
Features You can select the time frame you w

The indicator calculates the average price velocity over the specified time period. It is known that the trading time flows unevenly, in bursts. It either goes faster, or slows down. This indicator will tell if the trading time has accelerated and it is necessary to go to the smaller timeframes to search for trade signals.
Usage Alert is generated when the price velocity exceeds the specified threshold. The threshold value can be modified using the buttons on the information panel. A .wav file
FREE
This script allows performing a walk-forward analysis of trading experts based on the data collected by the WalkForwardLight library. The script builds a cluster walk forward report and rolling walk forward reports that refine it, in the form of a single HTML page. Since the library generates files with the metadata in the "tester\Files" directory (during the optimization), it is necessary to manually move the files to the "MQL4\Files" directory. The script only works in conjunction with the lib
FREE

Critical Regions Explorer displays two fixed regions daily. These regions are powerful regions where price are likely change direction. It can be best used with all timeframes less than or equal to Daily timeframes and can be used to trade any instruments.
Graphical Features Critical regions display. No repainting.
General Features Automated terminal configuration. Accessible buffers for EA requests.
How to Trade At the start of the day, do these four things: Identify upper critical region

Are you tired of channeling? This indicator is designed to draw channels. Triple graphics channels, automatically installs 3 different graphics channels. These channels are shown on a single graphic. These channels are calculated by a number of different algorithms. Automatically draws on the screen. You can select three time zones.
Parameters Period1 - from here you can select the first period. It can be selected from 1 minute time period to monthly time period. Period1_Channel_Color - period

Box martingale system is an indicator designed to trade martingale. This indicator sends a signal from the highest point where the trend is likely to return. With these signals the user starts the trades. These signals appear in the form of a box. The user can see from which point the signal is given. The important thing in trading martingale is to find a good starting point. This indicator provides this starting point.
Trade rules Start processing when the first trade signal arrives. The impo

The RSI Signals Manager Expert Advisor trades the signals of the RSI indicator. Trades are performed in an appropriate direction when the indicator reaches the value of RSI_Level_Down or RSI_Level_Up . If the indicator exceeds RSI_Level_Up , Short direction is selected for initial trades. If the indicator falls below RSI_Level_Down , Long one is selected. If Inversion = true , the trades are opened in the reverse direction. Profitable trades are closed by take profit. Loss-making ones are averag

The Expert Advisor implements the Fibonacci level trading. Pending orders (Buy Limit, Sell Limit) are placed at levels ~38.2,~50.0 and ~61.8. The grid of pending orders is built following the trend . Orders are closed by the total take profit or stop loss.
Settings and Inputs Risk: Risk - risk (<0.01 - low, >0.01 - high); Levels for placing pending orders: Level1 (0 - don't set) - level 1 (~38.2%) 0 - do not place a pending order Level2 (0 - don't set) - level 2 (~50.0%) 0 - do not place a pen

Tired of online risk calculators that you manually have to fill out? This neat little dashboard instantly shows you, your risk, reward and risk vs reward as soon as you've sat your Stop-loss or Take-profit. Works on both market and pending orders. By far, my most used indicator when trading manually on mt4.
Advantages Can handle multiple positions. And gives the total risk and reward for all positions on all manually placed or pending positions on the current chart. Automatically recalculates

The Quantum Expert Advisor is designed for trading EURUSD H1 . The trading algorithm lies in placing pending orders at the peaks of currency fluctuations, after a preliminary analysis of the market conditions. Trading is fully automated. Lot size is calculated automatically based on the lot percentage.
Parameters MaxRisk - percentage of the deposit, used for the automatic calculation of the lot. LongWave - long wave of price fluctuation. ShortWave - short wave of price fluctuation. Level contr
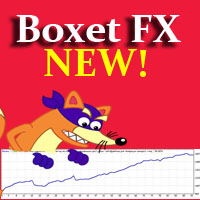
The BoxetFx Expert Advisor analyzes the market using multiple trading strategies. Once the optimal signals for opening trades are obtained, the EA automatically determines the order volume as a percentage pf the deposit. Next, a pending order is placed in the direction of the expected price movement. When the deal reaches an optimal profit or loss level, it is automatically closed. Multiple analytical centers of information processing allow the EA to diversify the possible risks of the trader by

This is a complex indicator for developing custom trading strategies. It can also sort out already existing strategies. The initial objective of the indicator was to combine a couple of indicators. After combining 12 indicators, I realized I need to implement the ability to separate them as well as arrange the signals from the built-in indicators and systems. The indicator provides signals as buffer arrows: 0 - buy, 1 - sell. The contents of the complex indicator:
Indicators Let me know if you
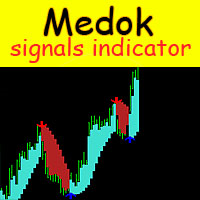
The Medok indicator shows the market entry and exit points on the chart using arrows and resistance lines. The indicator is very easy to use. Buy when a blue arrow appears and sell when a red arrow appears. After an order is opened, it is recommended to close a buy position when the price reaches the lower resistance level or to close a sell position when the price reaches the upper resistance level.
Recommended values for EURUSD H1 Periods - 2; Acceleration - 0.02.
Recommended values for EU
This is a simplified and effective version of the library for walk forward analysis of trading experts. It collects data about the expert's trade during the optimization process in the MetaTrader tester and stores them in intermediate files in the "tester/Files" directory. Then these files can be used by the special WalkForwardBuilder script to build a cluster walk forward report and rolling walk forward reports for refining it. The intermediate files should be manually placed to the "MQL4/Files

This indicator is designed to filter trends. Using the RSI indicator we know. It is aimed to confirm trends with this indicator. Can be used alone. It can be used as an indicator to help other indicators. He is already a trend indicator. You can confirm the signals given by other indicators according to your strategy with this indicator. The RSI Trend Filtering indicator confirms trends using a number of complex algorithms. Red below trend zero represents the downward trend. If trend is blue abo

Colored trend indicator is a trend indicator that uses Average True Range and Standard Deviation indications. It is aimed to find more healthy trends with this indicator. This indicator can be used alone as a trend indicator.
Detailed review 4 different trend colors appear on this indicator. The blue color represents the upward trend. The dark blue color has a tendency to decline after rising from the rising trend. The red color represents the declining trend. The dark red color has a tendency
The Expert Advisor for trading AUD/USD M5. It is based on the strategy of microtrend detection, market entry (and exit) points are calculated based on the correlation of indicators. The trading volume for opening a position depends on results of previous trades. It is possible to limit the amount of risk (the AutoMM parameter). It is also possible to set the maximum spread, above which the EA will automatically suspend trading (the MaxSpread parameter). It uses an efficient trailing, which autom

Super signal series trend arrows is an indicator designed to generate trading signals. This indicator uses a number of different indicators and generates a signal using a number of historical data. It generally tries to calculate the trend return points. These trend returns may be sometimes very large, sometimes small. The investor should act with the belief that the signal may be small. Monthly median produces 5 to 10 signals. These signals vary according to market conditions. The signals do no
This indicator detects IDRN4 and IDNR7 two powerful patterns on 28 pairs on new daily bar. IDNR4 is the acronym for "Inside Day Narrow Range 4" where "Inside Day" is a lower high and higher low than the previous bar and "Narrow Range 4" is a bar with the narrowest range out of the last 4 bars so "Narrow Range 7" out of the last 7 bars. Hence, ID/NR4 and better ID/NR7 are an objective criterion for identifying days of decreased range and volatility. Once we find an ID/NR4 or an ID/NR7 pattern, we
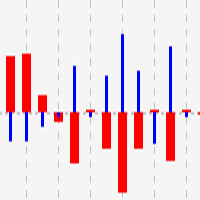
This indicator shows close to close price movements of the current symbol and an other as a histogram. It visualizes correlation between two symbols to help avoid counterproductive trading, diversify risk, etc. Attach it to the current chart as many times as many correlated symbols you want to take into consideration, and specify them in the OtherSymbol input field. The wide red histogram shows the movements of the reference (other) symbol, and the narrow blue histogram shows the movements of th
FREE
Use this script to export the price history to MATLAB mat files from any chart. Optionally, a CSV file can be created. This script allows easily creating and verifying your trading strategy in MATLAB, for example, statistical arbitrage or pairs trading strategies.
Input parameters startDT: start export from this date and time. Can be '1970.01.01 00:00:00' to start from the first available date and time. endDT: the last date and time in the file. Can be '1970.01.01 00:00:00' to export until the

The panel displays the list of all orders (market and pending) along with their details, including magic numbers and commentaries. The panel can be moved around the chart. For market orders, the profit listed includes the associated commission and swaps. There aren't any important input parameters, but you can control the panel's initial location via them.
FREE

ForexMarshalsSmart EA의 전략은 중기 시장 동향에 기반한 저위험 거래를 기반으로 합니다. 공격적인 스캘핑이 없는 경우 거래당 평균 이익은 15-50핍입니다. ForexMarshalsSmart는 모든 MetaTrader 4 브로커와 함께 작동하며 세계 최고의 모든 브로커의 요구 사항을 충족합니다. 권고자 설정에 대한 설명: LotPosition - 시장 포지션의 양 LotOrders - 대기 중인 주문의 양 거리 - 주문 사이의 거리, 이익 거리 MagicNumber - 고문 주문 식별자 미끄러짐 - 최대 허용 미끄러짐 EA의 전략은 중기 시장 동향에 기반한 저위험 거래를 기반으로 합니다. 공격적인 스캘핑이 없는 경우 거래당 평균 이익은 15-50핍입니다. ForexMarshalsSmart는 모든 MetaTrader 4 브로커와 함께 작동하며 세계 최고의 모든 브로커의 요구 사항을 충족합니다. 권고자 설정에 대한 설명: LotPosition - 시장 포지션의 양

YTG Stochastic 동적 레벨이 있는 오실레이터. 표시기 설정 설명: 모드 - 라인 유형, 메인 라인 또는 신호 라인 선택. Kperiod - % K 라인을 계산하기 위한 기간(막대 수). Dperiod - % D 라인을 계산하기 위한 평균 기간입니다. 감속 - 값을 느리게 합니다. 방법 - 평균화 방법. 다음 중 하나일 수 있습니다. 단순 평균. 지수 평균. 평활 평균. 선형 가중 평균. price - 계산할 가격을 선택하기 위한 매개변수입니다. 다음 값 중 하나일 수 있습니다. 0 - 낮음/높음 또는 1 - 닫기/닫기. Coefficient_K 동적 레벨 제거 계수. YTG Stochastic 동적 레벨이 있는 오실레이터. 표시기 설정 설명: 모드 - 라인 유형, 메인 라인 또는 신호 라인 선택. Kperiod - % K 라인을 계산하기 위한 기간(막대 수). Dperiod - % D 라인을 계산하기 위한 평균 기간입니다. 감속 - 값을 느리게 합니다. 방법 - 평

The Bullet Expert trades automatically. It belongs to level breakout scalping strategies. It is designed for high-speed trading on the financial instrument it is attached to. In order to trade different financial instruments simultaneously the EA must be attached to the chart of each relevant financial instrument. The Expert Advisor trades using pending orders. Different combinations of input parameters, timeframes and financial instruments provide the trader with wide tactical trading opportuni
The Price Line Alert Indicator will allow you to set price level that will alert you when hit, the price level will be shown in the chart as lines. Useful to get notified at specific prices, support, resistance, round numbers and so forth. If you want to a similar utility that will automatically close your position at a specific price check https://www.mql5.com/en/market/product/23113
How does it work? You can set several Price Lines and configured them to notify you if the price goes above or
FREE
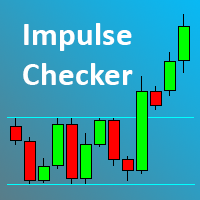
The Impulse Checker indicator is designed for informing about the price acceleration and determining the optimal entry points during an increased market volatility (for example, at the opening of the market or during the release of high-impact news). The indicator utilizes the fundamental regularity of the market, which assumes that after an impulse of a certain size at a certain point appears, the price movement continues, which allows earning a large number of points.
Description of the indi

This indicator consists in two different algorithms, in order to profit all fast movements created during noises of the market.
First of all, it plots normalized trend bands to can filter the possible trades. The normalized trend bands are calcualted using an exclusive mathematical algorithm to has both the correct trend and the fast adaptability to the change of trends.
With those bands you can know when you are inside the trend, or when you are outside. The second alhorithm uses a private

The EA has two strategies, each designed for a particular market behavior. Using both strategies allows you to cover a significant range of trading time and get high and stable results. The Channel strategy is based on the principle of scalping within the channel bounds, during periods of low volatility. (Modified strategy from version 1.1) Trend strategy builds on the principle of following the trend in during the high volatility hours. (New Strategy) The trading periods are selected based on t
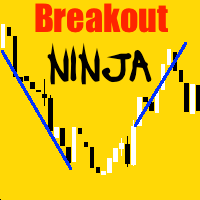
Usage Instructions for user Attach the Indicator to any chart. Select the desired Input in the Input Tab from the Indicator Dialog box that pops up. Select Ok to confirm and continue.
Description This Indicator detects breakout using advanced detection strategy. It consists of various inputs options including “Show Arrows”, “Show Max Profits”, “Show Analyzer”, etc which can be helpful for the user to enter trades or determine the profit or loss that would have occurred using previous data, arr

Did you ever encounter a problem that your terminal failed to reestablish a connection and caused your EA to stop working? How much money did you lose because you were not aware of the connection error? Worry no more, I am here to present you a solution for your nightmare. This utility indicator sends a real time push notification or email when your terminal encounters a connection failure. You will be notified immediately even if your terminal is yet to establish a success connection to your br
FREE

The Name Green Wall : Arrows hits a lot of TP, by changing the idea of non using SL as something bad, but instead use Small TP and a lot of free Margin and Patience. Use micro TP and a lot of Free Margin with this indicator on Forex. It also can be used with Binary Options. This strategy is intended to be traded Manually. This Indicator runs on Open Bar, arrows will delete when price are against it. The only Indicator Parameter is Alerts true/false, all the rest is included inside the code. Arro

EAsy ClickTrade is the easiest way in the Forex market to: Execute trades instantly as a function of selected Equity Risk and your desired StopLoss Level for ANY CURRENCY PAIR . Calculate the risk exposure to the market in terms of equity at risk per currency and direction. Calculate how attractive a potential trade is in terms of Risk and Spread Cost (excellent for scalpers and short-term traders).
Inputs Select Risk for Lots Calculation [% Equity]. By default 1%. This is the initial value fo

A fractal divergence is a hidden divergence , based on Bill Williams' fractals. A bullish fractal divergence is a combination of two lower fractals, the last of which is located below the previous one, and, at the same time, two candles to the right of the Low of the last fractal have Lows higher than the previous fractal level (see screenshot 1). A bearish fractal divergence is a combination of two adjacent upper fractals, the last of which is located above the previous one, but, at the same ti
FREE

Panel Display is a free utilities indicator, to display basic account information, in a beautiful way. This indicator is a plug and play, where the is no input required except for display corners. User can quickly engage how much profit/loss for current day / week! This Week's Performance - This week closed order for all pairs. Today's Performance - Today's closed order for all pairs. Current Floating Profit / Loss - Current Floating Profit/Loss (all pairs) in the account
FREE
This tool helps you find, revisit and document your past trades by marking the entries and exits using price labels. This indicator is designed to help you analyse your trades to, for example, find strengths and weaknesses of your Expert Advisor/strategy or even help writing your trading diary by clearly showing your past trades that you want to revisit. To only select those trades that were, for example opened by one specific Expert Advisor, you can select the magic number of those trades that
FREE

Having to check constantly if your Stochastic has reached a specific level can be tedious and draining at times, especially if you have to monitor different asset classes at a time. The Alert Stochastics indicator will assist in this task, ensuring that you get the most with little effort. When the Stochastic values get to a specified level, the alerts will go off, on the chart, on the MT4 phone app or via email (You can receive text messages to your phone if you activate texts on your Gmail acc
FREE

This is an efficient and yet simple Expert Advisor not using indicators, which can determine the following: the future direction of movement of quotes, their strength, trade levels for the current and next trading day. The Expert Advisor runs on the "here and now" principle, which means that the EA tracks a lot of parameters of the price behavior in real time. Based on this Expert Advisor, a certain trading strategy was developed and tested in real time. The ELEMENTARY strategy consists of three
FREE

The script analyzes the history of quotes and gives recommendations on the minimum deposit. The calculations take into account the variability of prices and the standard deviation. Margin requirements for the instrument are also taken into account. The result of the script is the minimum recommended deposit for trading the given currency pair.
FREE

This utility allow you to switch your chart symbol rapidly by simply clicking on any two of the currencies that made up the currency pair. The supported currencies for demo version are USD, EUR and GBP but you may purchase the paid version for extra supported currencies (JPY, AUD, NZD, CHF and CAD) There are two rows of buttons at the panel. To switch to a new chart symbol, all you need to do is select a currency from each row. It is not necessary to click the currencies in a correct sequence be
FREE

The MACDVolume indicator is a trading system based on the increase in tick volumes in bars, which match the trend.
Indicator Parameters Fast Moving Average - period of the fast moving average; Slow Moving Average - period of the slow moving average; MA method - averaging method of the moving averages (simple averaging, exponential, smoothed and linear-weighted); Apply to - applied price of the moving averages (Close, Open, High for the period, Low for the period, Median, Typical and Linear-Wei

The Stubborn Scalper indicator can run in any currency pair and at any time interval. The larger the time interval, the less false signals are obtained. Always choose a larger time interval for healthy signals.
Trade rules Turn on the Buy action when the Stubborn Scalper indicator turns blue and the trend up warning is displayed. The Stop Loss is set to the level at the end of the green circle. Turn off the operation when the Stubborn Scalper indicator is green or red. Turn on the Sell action
This indicator provides useful information for quantitative analysis. It compares the 28 pairs' pips of the current day with the average of pips made in the previous three days. When in the last three days the pips value is low and the value of today's pips is below, we are in the presence of a volatility compression that will explode soon. The "Range Today" is red if today's figure is less than the range of the previous three days, but turns green when the percentage exceeds 100%. When the rang

Yihaa Shoot applies a unique range calculation and time management to enter a trade. It has a unique money management system which calculates the risk before it takes a trade. Suggested pairs: GBPJPY and USDJPY Timeframe: H1 Suggested balance: $500 ($1000 is recomended) Risk in dollar suggested: 4 (0.5% from $1000)
Parameters Signal Settings Margin Top (pip) >> margin top from range Margin Bottom (pip) >> margin bottom from range TP Buy deduct (pip) >> reduce the TP spot TP Sell deduct (pip)

The Expert Advisor is based purely on price action analysis and applies three combined adaptive trading algorithms using pending orders. The robot follows the market price removing "noise" and selecting the most suitable trading strategy. The EA features dynamic trailing stop and brerakeven. The robot works with five-digit quotes. Economic news are used. Monitoring : https://www.mql5.com/en/signals/author/profi_mql . Optimized for EURUSD, AUDUSD, GBPUSD, USDJPY, NZDUSD, EURAUD / H1. For the EA o

Super signal series magic arrows is an indicator that generates trade arrows. It generates trade arrows with its own algorithm. These arrows give buying and selling signals. The indicator certainly does not repaint. Can be used in all pairs. Sends a signal to the user with the alert feature.
Trade rules Enter the signal when the buy signal arrives. In order to exit from the transaction, an opposite signal must be received. It is absolutely necessary to close the operation when an opposite sign
This is a true Price Rate-of-Change multi-timeframe indicator. It shows the charts of various timeframes in a single window converting them to the time scale used to perform trades. You are able to select both higher and lower timeframes, as well as change the main trading timeframe. You will always see all the lines of the indicator on the right scale. Two color scheme variants are available: with color change when crossing zero, and without. You can also define the data display style (lines or

Wager is an uncomplicated and very useful utility that is used in combination with your favorite Expert Advisor or signal. Maybe you have an Expert Advisor or a signal with a good winning percentage, and you wish you could increase the position size? That is exactly what Wager does. Wager monitors the Expert Advisor of your choice by Magic Number, so that when your Expert Advisor opens, modifies or closes an order, Wager will mimic the exact same thing as fast as you would expect. It doesn't ma

Easy to handle and use. Only the basic functions and nothing excessive. Due to simplicity of th algorithm integrated in the EA, it is suitable for virtually all Forex brokers. It can even be used on cryptocurrencies such as Bitcoin, Ether and the like. It has also been tested on metals, stocks and many other instruments. What is the algorithm inside the EA? First of all, it is a trader's find that allows using a unique the unique inefficiency of the market, which occurs only once in a while but

This is an efficient and yet simple Expert Advisor not using indicators, which can determine the following: the future direction of movement of quotes, their strength, trade levels for the current and next trading day. The Expert Advisor runs on the "here and now" principle, which means that the EA tracks a lot of parameters of the price behavior in real time. Based on this Expert Advisor, a certain trading strategy was developed and tested in real time. The ELEMENTARY strategy consists of three

This utility allow you to switch your chart symbol rapidly by simply clicking on any two of the currencies that made up the currency pair. The supported currencies are USD, EUR, GBP, JPY, AUD, NZD, CHF and CAD. There are two rows of buttons at the panel. To switch to a new chart symbol, all you need to do is select a currency from each row. It is not necessary to click the currencies in a correct sequence because it is designed to auto match your choice of currencies to the available symbols. Fo
This is a grid Expert Advisor with a position averaging and ability to enable/disable the martingale. RSI is used for placing the first order. Settings and indicator levels are set by users. Note: All distances in the EA are set in ratios from the ATR volatility indicator. A BuyStop order is placed when a symbol is oversold, while a SellStop one is applied if the price is overbought at the Distance_pending distance from the current price. If the price moves from a pending order, the order follow

The indicator is designed to measure the price volatility. This allows determining the moments for opening or closing trade positions more accurately. High intensity of the market indicates the instability of its movement, but allows for better results. And, conversely, low intensity of the market indicates the stability of its movement.
Parameters Bars to process - the number of bars to measure the price movements. A low value of this parameter allows determining the moments of rapid price mo
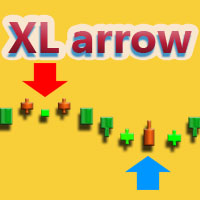
XL Arrow is a signal indicator that displays market entry points. The red arrow and the DOWN signal at the right corner indicate it is time to sell, while the blue arrow and the UP signal indicate it is time to buy.
Settings
PeriodSlower - indicator slowing period. PeriodFaster - indicator acceleration period.
Recommendations trading pairs: EURUSD, GBPUSD and USDJPY timeframes: M5 - H4

This indicator scans all the instruments in your Market Watch and finds those offering the most volatility and efficient price movement. It will tell you what instruments are best to trade at any given time. [ Installation Guide | Update Guide | Troubleshooting | FAQ | All Products ] Find what symbols are hot to trade easily Stop missing out on trading opportunities Stop trading flat instruments going nowhere Find dozens of price action opportunities regularly Focus your margin on instruments wh

This indicator uses the Fibonacci p-numbers to smooth a price series. This allows combining the advantages of the simple and exponential moving averages. The smoothing coefficients depend on the level of the p-number, which is set in the indicator parameters. The higher the level, the greater the influence of the simple moving average and the less significant the exponential moving average.
Parameters Fibonacci Numbers Order - order of the Fibonacci p-number, specified by trader. Valid values
This indicator calculates the aggregate position of all long positions and the aggregate position of all short positions on the current symbol. The aggregate position is displayed on the chart as a horizontal line. When the line is hovered, a tooltip with the volume of the aggregate position appears. If the total number of positions in the terminal changes, the aggregate position is recalculated.
Input parameters BuyLine color - line color of the aggregate long position; BuyLine width - line w

The Expert Advisor strategy is based on the intersection of moving averages. Buy - the fast МА (Moving Average) crosses the slow MA upwards, sell - fast МА crosses the slow MA downwards. It uses an adaptive grid and averaging with a time delay. Adapted for 4 and 5-digit quotes. Working timeframe is H1. Recommended initial deposit is at least 1000 units of the base currency.
Parameters MaFast_period , MaSlow_period – periods of the fast and slow moving averages; MaFast_method , MaSlow_method –
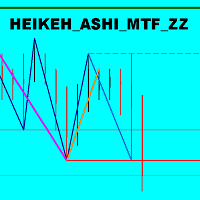
The indicator displays the price movement as three zigzags of different time periods (current, higher and even higher periods) on a single chart. Zigzag is plotted based on the Heiken Ashi indicator and the High/Low price values. The indicator also displays: Support and resistance levels based on the latest peaks of zigzags; Unfinished movement of the current period's zigzag, higher-period zigzag and even higher-period zigzag is displayed in another color.
Parameters TimeFrame : periods tot ca

Советник Time Line Auto Close (TLAC) позволит вам создавать вертикальные линии (Time Lines, линии времени), которые будут автоматически закрывать все или некоторые из ваших открытых ордеров. Вы можете создавать и управлять несколькими линиями, настроить для каждой из них закрываемые ордера и оповещения. Ордера можно фильтровать по валюте, магическому номеру, номеру ордера и типу ордера. Также можно настроить отправку уведомлений перед активацией линий.
Как она работает? С помощью TLAC вы сможе
FREE

AIS 고급 등급 타당성 지표는 가격이 미래에 도달할 수 있는 수준을 예측하도록 설계되었습니다. 그의 임무는 마지막 세 막대를 분석하고 이를 기반으로 예측을 작성하는 것입니다. 표시기는 모든 기간 및 모든 통화 쌍에서 사용할 수 있습니다. 설정의 도움으로 원하는 예측 품질을 얻을 수 있습니다.
예측 깊이 - 원하는 예측 깊이를 막대로 설정합니다. 이 매개변수는 18-31 내에서 선택하는 것이 좋습니다. 이 한계를 넘어설 수 있습니다. 그러나 이 경우 예측 수준의 "고정"(18보다 작은 값의 경우) 또는 과도한 수준의 폭(31보다 큰 값의 경우)이 가능합니다.
신뢰 수준 1, 신뢰 수준 2 및 신뢰 수준 3 - 예측 신뢰 수준. 1-99 범위 내에서 설정 가능합니다. 신뢰 수준 1은 신뢰 수준 2보다 커야 하고, 신뢰 수준 3은 가장 작아야 합니다. 이러한 각 수준은 예측 깊이 매개변수에 의해 결정된 막대 수에 대해 가격이 이 값에 도달할 확률의 백분율을 보여줍니다.
Co

This tool gives you the opportunity to display pivot point support and resistance levels as well as the daily open, weekly close and monthly close levels on your chart with high levels of customization.
Pivot points are important horizontal support and resistance levels that get calculated using the high, low and closing price of the previous period (for example D1). With this indicator, you can choose between hourly to monthly timeframes to base your pivot point calculation on.
There is a
FREE

I recommend you to read the product's blog (manual) from start to end so that it is clear from the beginning what the indicator offers. This multi time frame and multi symbol indicator scans for engulfing and tweezer formations. The indicator can also be used in single chart mode. Combined with your own rules and techniques, this indicator will allow you to create (or enhance) your own powerful system. Features Can monitor all symbols visible in your Market Watch window at the same time. Ap
Algo Zones is an indicator that simplify the visual approach and it gives you very quickly the information of your favorite indicator. The indicator colors areas based on indicator and levels chosen in input. This graphic display improves significantly your market attitude and it prevents you from making silly mistakes. The zones are colored in base of levels of this indicators: ATR, Momentum, RSI, MACD and Stochastic.
Input values Number_of_Bars (default 100) numbers of bars where show colour

Slide Trend is a simple indicator that shows a trend and allows for easy and fast navigation between charts. It was designed for quick analysis and aids you to scroll very fast through all the charts in the inputs list. The minimalist graphic allows receiving data on trend on D1, W1 and MN timeframes. The Trend feature (in the inputs) allows you to filter and view only the most powerful symbols. In this case, the circles are all of the same color. This indicator is a utility that speeds up navig

Vantage is a one-click semi-automated tool which works with the user interface. The EA's base strategy is grid trading. The user can start first trade from chart buttons and the EA will do rest of the work. User can open grid to loss side, profit side or both sides same time, or can do a simple trade without the grid. Use low risk against balance and apply EA on VPS. With this, the EA can work properly without any interruption. To understand all functions watch the video below.
Input parameter
MetaTrader 마켓은 거래로봇과 기술지표를 판매하기에 최적의 장소입니다.
오직 어플리케이션만 개발하면 됩니다. 수백만 명의 MetaTrader 사용자에게 제품을 제공하기 위해 마켓에 제품을 게시하는 방법에 대해 설명해 드리겠습니다.
트레이딩 기회를 놓치고 있어요:
- 무료 트레이딩 앱
- 복사용 8,000 이상의 시그널
- 금융 시장 개척을 위한 경제 뉴스
등록
로그인
계정이 없으시면, 가입하십시오
MQL5.com 웹사이트에 로그인을 하기 위해 쿠키를 허용하십시오.
브라우저에서 필요한 설정을 활성화하시지 않으면, 로그인할 수 없습니다.
