MetaTrader 4용 새 Expert Advisor 및 지표 - 246

Demo version of the paid product - Copy MT4 copier , limited to lot size of 0.01 Universal copier of deals from MetaTrader 4 to MetaTrader 4 ( MT5<->MT5 version is available ; with both versions, you can copy MetaTrader 5<->MetaTrader 4, MetaTrader 4<->MetaTrader 5, MetaTrader 5<->MetaTrader 5, MetaTrader 4<->MetaTrader 4). Spread filter. Select the best price (start copying positions with a profit or loss). Configure the lot size, fixed or ratio-based (provider signals can be copied with an inc
FREE

Magic Hedging is based on the hedging technique. The Expert Advisor tries to enter the market at the beginning of a trend. If the price moves in the unfavorable direction, Magic Hedging attempts to recover losing trades. It restores loss-making positions and tries to make them profitable by opening an opposite position with an increased lot. This opposite order can have a multiplied lot or a plus lot.
Requirements and recommendations Deposit min 10.000$ or optimal cent account Leverage 1:500 S

Modification of the Stochastic indicator with several types of alerts added to aid in your search for better opportunities in the market.
Product Features Email Alert Sound alert Push Notification (Alerts can be sent to your mobile phone) Signs on chart Alert box
Indicator Parameters Push Notification - This option enables your MetaTrader 4 to send alerts to your smartphone (IOS or Android). Email Alert - Configure your alerts to receive in your e-mail adress. SignOnChart - Enable drawing al

With the MACD Multi Time Frame indicator you can spot divergences of higher timeframes while you are searching for pinpointed entries on lower timeframes. This blog post gives you real-time MACD Divergence Analysis for free and tips how to trade the divergences: Real-Time MACD Divergence Analysis The MACD Multi Time Frame gives you an very good overview of what is happening on higher timeframes without the need of switching to the higher timeframe. You will e.g. always see the MACD value of the

GTAS S-Trend is a momentum indicator that helps to determine trends using combination of MACD, RSI and moving averages. This indicator was created by Bernard Prats Desclaux, proprietary trader and ex-hedge fund manager, founder of E-Winvest.
Description The indicator oscillates between -65 and +65 with a neutral zone between -25 and +25 around a 0 equilibrium line. S-Trend between -25 and +25 indicates congestion zones with a bullish bias between 0 and +25, and a bearish bias between 0 and -25
FREE

This indicator is designed to detect the best divergences between price/MACD and price/RSI. MACD and RSI produce by far the best divergence signals therefore this indicator focus on those two divergences. This is the FREE version of the indicator: https://www.mql5.com/en/market/product/28375
Important Information How you can maximize the potential of the scanner, please read here: www.mql5.com/en/blogs/post/718074
The free version works only on EURUSD and GBPUSD! This indicator scans for you
FREE

GTAS FidTdi is a trend indicator using combination of volatility and potential retracement levels. This indicator was created by Bernard Prats Desclaux, proprietary trader and ex-hedge fund manager, founder of E-Winvest.
Description The indicator is represented as a red or green envelope above or under prices.
How to use Trend detecting When the envelope is green, the trend is bullish. When it is red, the trend is bearish.
Trading Once a trade is opened, GTAS FibTdi shows retracement zones
FREE
Trade Master is advanced forex robot for manual trading and managing open trades. When attached to a chart it prints two buttons BUY and SELL. Using these two buttons you can trade manually by predefined Stop Loss, Take Profit and other parameters. Trade Master is also equipped with Trailing Stop system to protect the profits. Trade Master is the best tools for scheduled closing of trades. It can be used for closing trades for each weekday from Monday to Friday at specific time (hour and minutes
FREE

The demo version of GS Assist: only EURUSD, limited Lot, Profit and Loss parameters, the Members of Group panel has only two rows. The full version features a built-in Forex Factory news feed to allow closing orders before the news releases. GS Assist is designed for managing orders of other experts and risk exposure. It can run on all forex symbols. The tool can be used as an order manager for other experts and/or as a quick trading tool featuring BUY and SELL buttons. Features: Automatic closi
FREE

Advisor to manage all orders opened in the terminal.
It is used as an administrator of open orders, setting them with Stop Loss and Take Profit, if they didn’t have such when creating them.
It has a built-in news feed from Forex Factory for the ability to automatically close orders before the news is released.
It can be attached to any currency pair, and will work with all open orders.
Advisor provides: The installation of Stop Loss and Take Profit of all orders opened in the ter

This indicator shows the levels and signal dots of the Doji pattern. The indicator allows traders to easily determine possible location of a price rebound. Doji is a candlestick with Open and Close price equal, or almost equal. It should also have shadows of approximately the same size on both sides. Doji denotes the balance between buyers and sellers, or the absence of major players, or level testing. This pattern can mean both a reversal and a continuation of the trend.
Indicator Parameters

This Expert Advisor uses scalping as its main strategy based on a statistical model called Bollinger Band. It embedded with two exit market strategies called 1st and 2nd dagger. The 1st dagger exits on the mid line of the band and the 2nd dagger exits by trailing until the maximum profit. It is recommended to use both strategies to lower the risk since it would split the lot into half for each dagger. Recommended: M5/M15, EURAUD/GBPAUD, ECN account Please add the news link (http://ec.forexprosto
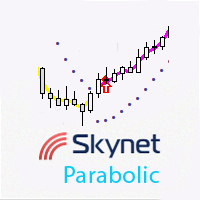
This indicator displays the entry points for buying and selling, with additional push notifications. It is based on the classic Parabolic SAR indicator, price smoothing model and certain mathematical methods for a greater variability in finding market entry points.
Advantages Fewer wrong entries compared to the use of classic breakout and trend confirmation indicators. Signals are not redrawn. A large number of customizable parameters. Visualization of the bullish and bearish trend. Used for i
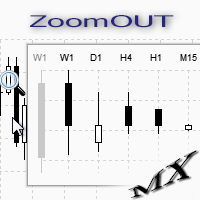
ZoomOUT allows you to have a quick look at a selected bar on a higher timeframe in a pop-up window. After the launch, the indicator works in the background mode occupying no place in the chart and consuming no resources. When activating the indicator by Shift + o (customizable), a pop-up window with a chart displaying bars of higher timeframes is created. To hide a pop-up window, left-click on any clear place on the chart. The indicator is simple and requires no settings.
FREE

EFW Pattern Trader is a powerful pattern scanner for Forex and Stock trading. The pattern detection in EFW Pattern Trader uses the Fractal Wave Theory, which captures the endless up and down movement of the market. Therefore, EFW Pattern Trader can be considered as the robust price action indicator. Any patterns in EFW Pattern Trader can be backtested visually in your strategy tester. Visual backtesting with pattern will show you how pattern will likely behave in the live trading. Therefore, you

The indicator displays market entry arrows based on RSI, MFI, DeMarker, CCI and Multi Stochastic.
Inputs period — values of all indicators used. Enable_Alert — audio and text notifications on a trend change. Send_Notifications — push notifications to mobile devices. E-mail alert — email notifications. Make sure to configure email parameters in the terminal settings.
Features The indicator does not repaint. The indicator does not recalculate. The indicator works on all timeframes. The indicat

It can only be used in EURCHF / M15 . The Expert Advisor is a great tool that allows you to control your trade with ease and precision. The tool can be moved in the graphs and offers the following characteristics:
Instant order entry with a single click. Entry of pending orders using price tags and trend lines. Instant order closure with a single click. Instant order closure using trend lines as output levels that the broker can not see. We can modify the way to enter and exit the market, allo
FREE

Universal copier of deals from MetaTrader 4 to MetaTrader 4 ( MT5<->MT5 version is available ; with both versions, you can copy MetaTrader 5<->MetaTrader 4, MetaTrader 4<->MetaTrader 5, MetaTrader 5<->MetaTrader 5, MetaTrader 4<->MetaTrader 4). Spread filter. Select the best price (start copying positions with a profit or loss). Configure the lot size, fixed or ratio-based (provider signals can be copied with an increased lot). Configure order copying (include pending orders or copy only open po
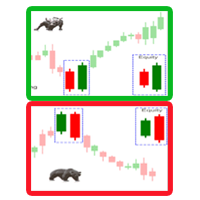
A trend reversal indicator based on the Candlestick Pattern. A candlestick pattern is a movement in prices shown graphically on a candlestick chart that trader can predict a particular market movement. Engulfing Pattern: A reversal pattern that can be bearish or bullish, depending upon whether it appears at the end of an uptrend (bearish engulfing pattern) or a downtrend (bullish engulfing pattern). The Engulfing Of Sparta indicator is an improved variant of the Candlestick Pattern, which shows
The Roll indicator is designed for finding local extremes and determining the current trend. The indicator is based on the volume and volatility values. Indicator calculation can be modified by activating the Modification parameter and choosing one of the available calculation options from CalcMode . To be able to determine current trend using this indicator, you should increase the value of the OsPeriod parameter and decrease the values of DynamicLevelPeriod and ShiftDynamicLevel . The indicato

Determining the current trend is one of the most important tasks for a trader regardless of their trading style. Linear Trend can help you with this task. Linear Trend is a trend determining indicator, which uses an original calculation algorithm. The indicator is suitable for any currency pair and timeframe. It does not change its readings. The product applies three methods selected by a certain parameter and an additional modification of results. Due to the variety of settings and filters, the

The Tequila Sunrise (TSR) makes “buy” trades on the USDMXN during morning times of high volumes. The EA uses a combination of the Stochastic Oscillator, Force Index, and a price action algorithm across different timeframes to determine whether or not it takes a trade each particular day. Instead of a take profit target, the EA uses an algorithm to determine when to close the trade. It is designed to run on the 5 minute charts on a daily basis.
Parameters Magic Number : This is a unique identif

This indicator helps you to Scan symbols which are in the Market Watch Window and filter out trends with alerts. It works based on the effective indicator "SUPERTREND" which is used by many traders for trading: When box color changes to " Green " or " Red " color, it indicates you for trend change for long and short entry. And also you will get alerted on screen. When it changes to " Green ", it indicates you that trend is going upwards, and you can take the long entry. If the color changes to
FREE
The indicator will help you find support and resistance levels, increase the number of confirmations for stronger levels. This is not a multi-timeframe indicator that refers to the information from other timeframes. But it allows to show strong levels of support and resistance where the price respects a mark two or more times. How to trade: For smaller timeframes up to M30 I recommend at least 3 confirmations. This filters stronger levels with subsequent strong movements. For larger timeframes o

Free version. Only works on EURUSD. Would you like to have statistics about your trades displayed while you operate? Have you a solid understanding of the symbol you are trading? Do you really know everything you need to about your trading account? Do you need to keep an eye on the local times around the world? Advanced Info Displayer answers to all that. It is the ultimate tool to know all sort of useful information and hidden or hard to find data. It is important if you are serious about tradi
FREE
Would you like to have statistics about your trades displayed while you operate? Have you a solid understanding of the symbol you are trading? Do you really know everything you need to about your trading account? Do you need to keep an eye on the local times around the world? Advanced Info Displayer answers to all that. It is the ultimate tool to know all sort of useful information and hidden or hard to find data. It is important if you are serious about trading and you value statistics and mat

This is an individual tool for analyzing the market situation. It is very simple to use. After attaching the indicator to the chart, you will see three vertical lines named "VLine 1", "VLine 2" and "VLine 3", following in this order from left to right. For the utility to operate correctly, this sequence should always be observed. Please note: at the first start, the lines are not bound to specific price levels on the chart. This should be done by user in accordance with the following rule: if li

Index Hub is designed for creating multi-currency indicators using up to 14 currency pairs and any of 6 indicators: Stochastic, WPR, RVI, RSI, Force and CCI. An example with three pairs and the CCI indicator: CCI(USDCAD)+CCI(USDJPY)+CCI(USDCHF) / 3 = CCI(Index Hub).
Application Index Hub is suitable for the following types of trading: basket trading, scalping and arbitrage strategies. For example, if you need to use Stochastic for scalping purposes, set two indicators on EURUSD with currencies

통화 강도 7 기술 지표는 거래자가 가장 인기 있는 7가지 통화의 강도를 측정할 수 있도록 설계된 강력한 도구입니다. AUD, USD, EUR, GBP, JPY, CHF 및 CAD의 강세를 분석함으로써 이 지표는 통화 역학에 대한 귀중한 통찰력을 제공합니다. 그것은 선을 사용하여 차트에서 통화 강도를 나타내므로 거래자가 다른 통화의 상대적 강도를 빠르게 평가할 수 있습니다. 이 지표의 눈에 띄는 기능 중 하나는 차트에 확장된 과거 데이터를 그릴 수 있는 기능입니다. 이 포괄적인 역사적 관점을 통해 트레이더는 시장 움직임을 보다 효과적으로 분석하고 정보에 입각한 거래 결정을 내릴 수 있습니다. 과거의 추세와 패턴을 더 잘 이해함으로써 트레이더는 미래 통화 움직임을 예측하는 능력을 향상시킬 수 있습니다. 통화 강도 7 지표는 이동 평균 데이터를 사용하여 각 통화의 강도를 나타냅니다. "+" 및 "-" 기호를 사용하여 각각 강한 위치와 약한 위치를 나타냅니다. 이 명확한 시각적 표현은

This is a utility designed to automatically set the stop loss levels of orders according to the specified condition. Two price levels serve as the condition for setting stop loss: Trigger level - when this level is reached, an order is placed. The stop loss value of an order. It is possible to enable or disable traling stop loss.
Input parameters Order type for execution - type of orders to be processed by the expert. It can either be BUY, SELL or auto-select. Trigger Level Points - level to p

BillWill 지표는 Bill Williams라는 책에서 가져온 자료를 기반으로 합니다. 거래 혼돈. 이익 극대화를 위한 전문 기술. 각 막대 상단의 지표 판독값은 막대의 1/3에 대한 시가 및 종가의 위치를 기반으로 계산됩니다. 막대는 세 부분으로 나뉩니다. 막대의 아래쪽 1/3은 3번, 중간 1/3은 2번, 막대의 위쪽 1/3은 1번(1)입니다. 표시기 판독값의 첫 번째 숫자는 막대의 세 번째에 대한 시가의 위치이고, 두 번째 숫자는 막대의 세 번째에 대한 종가의 위치입니다. 각 막대 하단의 표시기 판독값은 이전 막대의 극한값을 기준으로 막대 중앙의 위치로 계산됩니다.
지표 판독값 정의 1-1 시가 및 종가는 바의 상단 1/3에 위치 2-2 시가와 종가는 바의 중간 3분의 1에 위치 3-3 시가와 종가는 바 하단 1/3에 위치 3-1 시가는 막대의 하단 1/3, 종가는 상단의 1/3 2-1 시가는 막대의 중간 1/3, 종가는 막대의 상단 1/3 3-2 시가는 하단 1/3
FREE

Sidus 지표는 거래 전략입니다. 3개의 표준 지표를 기반으로 합니다: 2개의 이동 평균(MA) 및 강도 대비 지수(RSI). 지표 신호는 이동 평균의 교차와 50 수준에 대한 RSI 지표의 동시 위치 지정입니다.빠른 이동 평균이 느린 이동 평균 위에 있고 RSI 지표가 50 수준을 초과하면 구매가 가정됩니다. 빠른 이동 평균이 느린 이동 평균보다 낮고 RSI가 50 수준보다 낮으면 매도를 가정합니다.
표시기 설정 설명 bar_limit - 지정된 수의 막대에 표시기 표시 제한, = 0이면 사용 가능한 모든 막대에 표시됩니다. Period_FastMA - 빠른 이동 평균 기간. Period_SlowMA - 느린 이동 평균의 기간. Period_RSI - RSI 표시기의 기간. ma_method_MA - 이동 평균 평균화 방법. apply_price_MA - 적용된 이동 평균 가격. apply_price_RSI - RSI 지표에 사용된 가격. 경고 - 사용자 데이터가 포함된
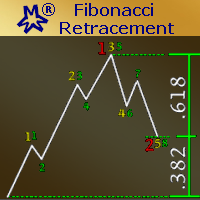
The EA Strategy: This EA strategy is based on Fibonacci Retracement Calculations to produce it's own signals and trade automatically. It was built for those traders who loves and trust Fibonacci Retracement Levels. In finance, Fibonacci retracement is a method of technical analysis for determining support and resistance levels. They are named after their use of the Fibonacci sequence. Fibonacci retracement is based on the idea that markets will retrace a predictable portion of a move, after whic

This Expert Advisor is a night scalper. It works at the end of the American session and at the beginning of the Asian session. The working timeframe is M15. It uses standard indicators for market entries and exits. Take profit and a protective stop loss are set for each order. However, orders are most often closed based on indicator signals. See the Comments page for ready .set files for traded currency pairs. The EA has an optional news filter which is based on a news indicator. IMPORTANT : Par

This indicator scans for you up to 30 trading instruments and up to 8 timeframes for occurrences of the high probability reversal patterns: Double Tops/Bottoms with fake breakouts . Please read also the blog post " Professional Trading With Double Tops/Bottoms And Divergences! " which explains the concepts behind the ULTIMATE Double Top/Bottom indicator and how you can use a professional top-down approach. This FREE Version of the Scanner scans only EURUSD and GBPUSD. The full version of the sca
FREE

This indicator is designed for trading pending stop orders at the calculated levels. These levels are marked with the names “BUY STOP” and “SELL STOP”, and corresponding price labels. In addition, the indicator informs the user about the preferred trade direction using arrow, as well as other available means of notification, which can be customized.
Parameters Type of Calculation - type of calculations: Price Close – based on Close prices. Price High Low – based on High and Low prices; Design

This indicator displays the short-term trend direction and flat areas in the same way as the classic Heiken Ashi indicator, but it is not plotted using candles or a moving average, but rather the Skynet Moving Average indicator.
Advantages no delay, or a slight delay when using the 'smooth' parameter. customizable parameters for any price data and timeframes. visualization of the flat and the short-term trend. unlike the classic Heiken Ashi indicator, the frequency of candles changing from bul
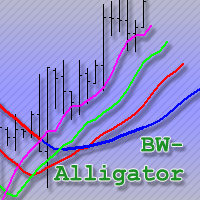
An improved version of the classic Alligator indicator by Bill Williams.
Description The Alligator technical indicator is a combination of moving averages (balance lines). Blue line (Alligator Jaw) is a 13-period smoothed moving average, shifted by 8 bars into the future; Red line (Alligator Teeth) is an 8-period smoothed moving average, shifted by 5 bars into the future; Green line (Alligator Lips) is a 5-period smoothed moving average, shifted by 3 bars into the future; Purple line (Fast Gat

The Master Pivot indicator is a very interesting generator of static levels based on historical percentage variation. The levels are completely customizable changing the input numbers. Period can also be modified to select the preferred Time Frame. The color is flexible so you can change color easily, we recommend a red color upper and lower green for a contrarian style, conversely instead for a style follower trend. This indicator used in a confluent way offers some really interesting ideas.

Background It only needs a small initial deposit. Immunity to the large delay and the size of the spread. Monitoring of my accounts : https://www.mql5.com/en/signals/author/mizrael
Operation Principle The EA opens orders at modifiable Fibonacci levels. Each subsequent order is opened at a new Fibonacci levels with a volume increased Martingale times. The EA determines the total profit of orders with the same Magic number. If it exceeds the value of Profit , then the orders are closed.
Rec

The main goal of the indicator is to determine the most optimal points of entry and exit from a trade. The indicator consists of three parts. The first one is arrows displaying the most efficient market entry/exit points. The up arrow is a buy signal, the down arrow is a sell one. The indicator contains an analytical analysis algorithm that includes a set of standard indicator readings, as well as a custom algorithm. The second part is data in the upper right corner (works on М1-D1 timeframes) o

The GTAS BSI is an indicator designed to provide the trend direction and buy/sell signals, using combination of momentum indicators. This indicator was created by Bernard Prats Desclaux, proprietary trader and ex-hedge fund manager, founder of E-Winvest.
Description The BSI indicator is represented as a histogram under the price chart. +100 (green) value indicates a bullish trend. -100 (red) value indicates a bearish trend. When the BSI turns to +100 (green), it gives a potential buy signal. W
FREE

The indicator measures volumes on different charts and instruments. Its main advantage is the ability to compare separate brokers. The less Middle Volume and Tick / Second , the more reliable is the broker. There is a comment in the upper left corner Comment data: Tick/Second — number of ticks per second for a selected instrument Middle Volume — average volumes in the penultimate bar This indicator allows tracking a relative market activity for different timeframes. If the volumes are lower than
FREE

Trade Click Demo is a trade panel for demonstrating the features of Trade Click: https://www.mql5.com/en/market/product/28112 Limitations: The demo version works only on EURUSD, lot size can not be changed. The minimum lot is used. To use this product on any instrument with lot sizing options, please check the full version at: https://www.mql5.com/en/market/product/28112 You can choose to enter a trade with the minimum lot size, as this is a demo version of the product. Set your desired stop los
FREE
SymbolAutoChanger MT4
There is also PRO version for MetaTreader5 There is also PRO version for MetaTreader4 This tool allows you to automatically change the chart symbols in a loop. Example: EUR → GBP → JPY → CHF → CAD → AUD → NZD You need only to set up interval in seconds between auto switch. Also, you can choose whether to switch between all symbols provided by your broker or only between symbols available in the Market Watch window. Demo version is limited to 4 symbols. Full version allows
FREE

The panel shows the relative position of the price and the selected moving averages (MA) for the selected timeframes and symbols.
You can simultaneously control: up to 3 symbols; up to 6 periods; up to 10 different Moving Averages. Version for MetaTrader 4: https://www.mql5.com/ru/market/product/28281 Version for MetaTrader 5: https://www.mql5.com/ru/market/product/28096
Parameters NUM_BAR - number of the bar to analyze (set a value greater than 0 to work on closed bars). timeframe_1....time
FREE
SymbolAutoChanger MT4 There is also PRO version for MetaTreader5 There is also PRO version for MetaTreader4 This tool allows you to automatically change the chart symbols in a loop. Example: EUR → GBP → JPY → CHF → CAD → AUD → NZD You need only to set up interval in seconds between auto switch. Also, you can choose whether to switch between all symbols provided by your broker or only between symbols available in the Market Watch window.
There is also PRO version has following featuters: Next
Buy or rent it and request a copy of the Antimartingale EA for free Trendline based utility, you design your trendlines or horizontal lines, the EA opens trades for you Possibility to trade on break and/or bounce events Indipendent break and bounce settings Configurable market, stop and limit orders T1T2 Logic to lock profits and minimize losses Trailing Stop Loss Max Spread check Notifies you when your trendlines are crossed No strange trendline name or syntax, you decide the color of tr

Trade Click is a trading panel allowing you to perform trading operations with one click based on your risk preferences. The panel allows trading any financial instrument and provides options for fast changing of symbols or periods. You can choose to enter a trade and automatically calculate your lot size based on how much of your account you want to risk. You can also set a fixed volume for your trades. Set your desired stop loss and take profit levels in points. The "Close For Symbol" button a
The BinaryFiesta indicator has been developed and adapted specifically for trading short-term binary options. The algorithm of the indicator analyzes numerous factors before generating a signal. The indicator is installed in the conventional way. The indicator consists of an information window, which displays the name of the trading instrument, support and resistance levels, and the signal itself ( BUY , SELL or WAIT ). A signal is accompanied by a sound and a pop-up Alert.
Advantages of the i
The Expert Advisor looks for technical analysis patterns formed on the higher (hourly) timeframe to start working on the 5-minute chart. Technical analysis patterns used: double top/double bottom, head/shoulders, flag, expanding/narrowing triangles. The Relative Vigor Index technical indicator is used as the filter for opening deals. It is based on the idea that on the bull market the closing price is, as a rule, higher, than the opening price. It is the other way round on the bear market. This

This is a simple indicator to show if global and local trend directions are the same. It uses two timeframes, a "local" timeframe and a higher order "global" timeframe. The indicator shows price action only and has no lag. It generates a square wave (green line), the output signal is above zero if the price tendency is bullish upward, and below zero for bearish downward tendency. The red line shows the tendency of a higher order timeframe (the global tendency). The idea is to trade long when pri

MayaTradeManager is a pure & 100% manual trade orders management. MayaTradeManager doesn't have any indicators or signals to be used together since all trades are done by the user only. MayaTradeManager is an good tool usually for whoever that has a signal at the user disposal but don't have the one-stop-center to manage their trades conveniently. MayaTradeManager brings all of the trades management into one simple panel in a very convenient way.
Just a quick note Lot size box is an editable b
FREE

The indicator displays potential entry points on a trend, displaying buy level, sell level and golden point which will determine where to get out of the trade or trail your stops. If an entry is detected, the indicator shows and Arrow, either pointing down for Short and up for Long positions. When the golden point is passed during a trade, it will start drawing potential points for trailing, is then up to you how to manage your trade. This indicator has been built for best results on H1 Time fra

>>> BIG SALE PROMOTION: 50% OFF + GIFT EA! - Promo price: $79 / Regular price $159 <<< - The promotion will end soon!
Asian Scalper is an automated Forex robot. It is an advanced Asian session scalper which supports 9 currency pairs. The robot is equipped with Money Management, Take Profit, Stop Loss, Broker Protections, Slippage Protection, Max Spread Protection, Loss Recovery System and so on. Supported pairs: GBPUSD, GBPCHF, GBPCAD, EURGBP, EURCAD, EURCHF, USDJPY, USDCHF, USDCAD. Time Fra
The Controversial 5-Step System That Professional Traders Use To Unlock Trading Success!
Reversal Pro effectively combines price action, ideal location and reliable statistics in one smart algorithm. Understanding the market in this unique perspective allows you to recognize reversals professionally.
Discover The Secret Of Professional Traders
Get instant access www.mql5.com/en/blogs/post/716077 Copy & Paste what professional traders are doing right now!
How To Trade Step 1: Trade Setu

Sweep Trend 이 표시기는 차트에 지정된 설정에 따라 가격 변동의 변동성을 직사각형 형태로 표시합니다.
설정 설명 TrendPips - 포인트 단위의 필터 값 TrendBars - 막대 수의 필터 값 signal_shift - 신호에 대해 지정된 기간만큼 뒤로 현재 막대를 기준으로 이동합니다. CountBars - 표시기를 표시할 막대 수 Color_1 - 교차하는 사각형의 색상 중 하나 Color_2 - 직사각형의 두 번째 색상 경고 - 사용자 데이터가 포함된 대화 상자를 표시합니다. 텍스트 - 신호에 대한 사용자 정의 텍스트. Send_Mail - "메일" 탭의 설정 창에 지정된 주소로 이메일을 보냅니다. 제목 - 이메일 헤더. Send_Notification - "알림" 탭의 설정 창에 MetaQuotes ID가 지정된 모바일 터미널에 알림을 보냅니다. 개발자의 경우 표시기에는 하나의 신호 버퍼가 있으며 그 값은 표시 사각형이 형성된 후 1과 같고 다른 경우에
FREE

This indicator is designed to detect high probability reversal patterns: Double Tops/Bottoms with fake breakouts . This is the FREE version of the indicator: https://www.mql5.com/en/market/product/26371 The free version works only on EURUSD and GBPUSD! Please read also the blog post " Professional Trading With Double Tops/Bottoms And Divergences! " which explains the concepts behind the ULTIMATE Double Top/Bottom indicator and how you can use a professional top-down approach. The provided video
FREE

xCalper Triad works as a Target scanner tool. Its algorithm calculates price level areas with high precision and instantly. By default, they are automatically identified and the trader normally sets visual parameters only. Explore a new perspective in price action analysis by adding Triad to your setup and surprise yourself.
Main Features Automatic & exclusive Target levels Daily candle representation in all intraday timeframes. Side panel information essential to all traders: Remaining time t

This is a free demo version for USDJPY only. Here is the link to full version: https://www.mql5.com/en/market/product/25912 This product has no input parameters. The product helps you to open and close orders faster, include instant and pending orders. It helps you to open order faster and easier, to make an order you simply click on the button.
Buttons List BUY/SELL: to open instant Buy or Sell orders. BUY STOP/BUY LIMIT/SELL STOP/SELL LIMIT: to open pending order. The distance to the current
FREE

This product has no input parameters. The product helps you to open and close orders faster, include instant and pending orders. It helps you to open order faster and easier, to make an order you simply click on the button.
Buttons List BUY/SELL: to open instant Buy or Sell orders. BUY STOP/BUY LIMIT/SELL STOP/SELL LIMIT: to open pending order. The distance to the current price is "Dis" (below of these buttons). SL/TP: Distance in point far from the current price, to put stop loss and take pro
A trend indicator based on the Ichimoku Kinko Hyo and Candlestick. The Scanner Trend Indy is an improved variant of the Ichimoku Kinko Hyo and Candlestick, which shows the moment of trend following quite accurately. It is often used as a signal filter. Combination of two indicators makes a better use of these advantages: Ichimoku Kinko Hyo identifies the trend, while Candlestick determines the short-term movements and signals in the trend direction.
Messages/sounds (notifications and sound set

If you are using volume spread analysis, whether your are a beginner or an expert, this system will give you a lot of features and help in your analysis. Please watch the video to see all the features.
Features With one click you will find all the VSA patterns on your chart . Bars without opening price. Easy to read volume indicator. Bar reader (Bar type - Close type - Volume type - Spread type). Daily and weekly levels (Pivot - Camarilla - Fibo). Very light on the trading platform and moving
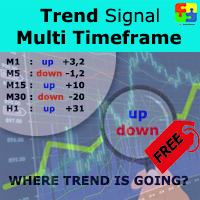
Free version. Only works on EURUSD. Do you want to always know in a quick glance where price is going? Are you tired of looking back and forth between different timeframes to understand that? This indicator might just be what you were looking for. Trend Signal Multitimeframe shows you if the current price is higher or lower than N. candles ago, on the various timeframes. It also displays how many pips higher or lower current price is compared to N. candles ago. Number N. is customizable The dat
FREE
Stoch–Cross Scalper is an Expert Advisor based on the Stochastic oscillator indicator using the 80 threshold as overbought and 20 as oversold while utilizing a 14 day rolling period to analyze High and Low closing prices in relation to the current close price. The Stochastic oscillator is a commonly used indicator and many trading philosophies are based upon it. This expert is the result of over ten years of my fine tuning and perfecting this trading system. Almost all of the indicators availabl
FREE
"All in One" Expert Advisor. The EA collects information from different signals (listed below) on the selected timeframes. Each signal has its own weight. The weight of all signals is summed. If the total weight of signals for a timeframe is greater than the minimum weight, a deal is opened. Operation on each selected timeframe is performed independently. After that, the deal is managed according to the Money Management conditions.
It can work simultaneously on: up to 6 periods; up to 31 popul
FREE
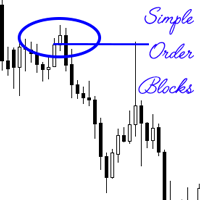
An order block also known as a block of order is a significant order placed for sale or purchase of a large number of securities. They are often used by institutional traders, and is a different way of looking at support and resistance. These levels are temporally used, before new levels and areas of interest are created. The simple order block indicator attempts to find the order blocks, which are more often than not optimal trade entries. The primary strategy when using the indicator when maki

If you need to quickly evaluate the results of trading on a current financial instrument by hypothetical price movement in the chosen direction and up to a certain level, set the indicator on any chart that contains open positions and move the line to the desired level after it appears together with the results tab. This is all you need to understand what happens to your deposit if the price is at this level without taking into account existing stop loss and take profit. Enable considering pendi
The algorithm of this Expert Advisor determines the significant price levels, where the trend often turns into a flat or reverses. Stochastic Oscillator serves as an additional filter of overbought/oversold zones. The EA sets stop loss and take profit after opening an order. The underlying trailing strategy applies a trailing stop. The EA is recommended for simultaneously use on three trading instruments: EURUSD M5, GBPUSD M5, EURCHF M5. Settings:
Comment to order - comment to orders. MaxRisk -

Reversal Alert Pro 지표는 시장에서 반전 영역을 자동으로 감지하도록 설계된 강력한 도구입니다. 모바일 장치로 직접 전송되는 편리한 알림을 제공하며 소리와 함께 팝업 알림을 표시합니다. 이 지표를 거래 전략에 통합하면 거래 포지션을 효과적으로 필터링할 수 있습니다. 또한 이 지표는 CCI, RSI 및 Stochastic 지표를 활용하여 생성된 신호를 더욱 세분화하여 다양성과 적용성을 향상시키는 옵션을 제공합니다. Reversal Alert Pro 표시기의 주요 기능 중 하나는 모든 시간 프레임 및 기호에 대한 적합성입니다. 선호하는 거래 스타일이나 거래하는 시장에 관계없이 이 지표는 필요에 따라 조정할 수 있습니다. 매개변수 설정은 사용자 친화적으로 설계되어 기본 설정에 따라 쉽게 구성하고 사용자 정의할 수 있습니다. 차트에 적용하면 지표가 빠르게 신호를 그려 잠재적인 반전 영역을 즉시 식별할 수 있습니다. 이러한 신호는 선택한 기간, CCI, RSI 및 스토캐스틱
MetaTrader 마켓은 거래 로봇과 기술 지표들의 독특한 스토어입니다.
MQL5.community 사용자 메모를 읽어보셔서 트레이더들에게 제공하는 고유한 서비스(거래 시그널 복사, 프리랜서가 개발한 맞춤형 애플리케이션, 결제 시스템 및 MQL5 클라우드 네트워크를 통한 자동 결제)에 대해 자세히 알아보십시오.
트레이딩 기회를 놓치고 있어요:
- 무료 트레이딩 앱
- 복사용 8,000 이상의 시그널
- 금융 시장 개척을 위한 경제 뉴스
등록
로그인
계정이 없으시면, 가입하십시오
MQL5.com 웹사이트에 로그인을 하기 위해 쿠키를 허용하십시오.
브라우저에서 필요한 설정을 활성화하시지 않으면, 로그인할 수 없습니다.