Reversal Point MT4
- インディケータ
- Ziheng Zhuang
- バージョン: 4.0
- アップデート済み: 1 12月 2022
- アクティベーション: 20
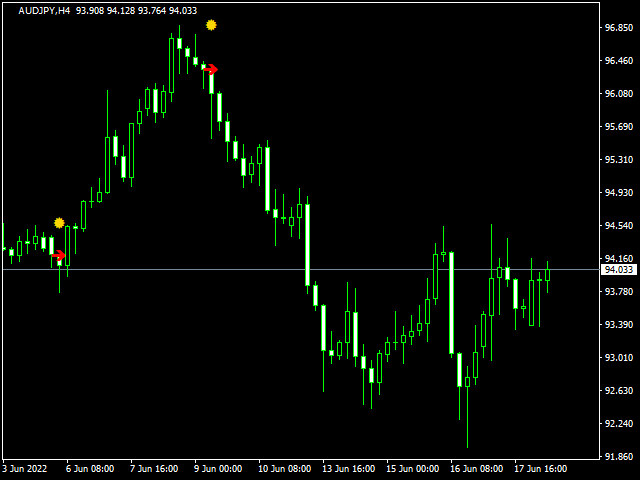
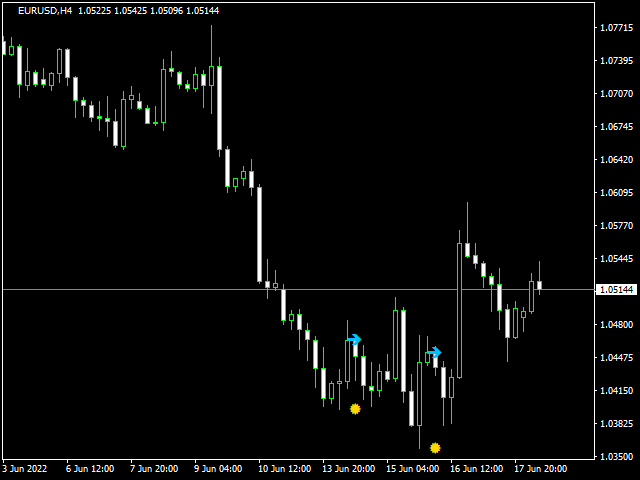
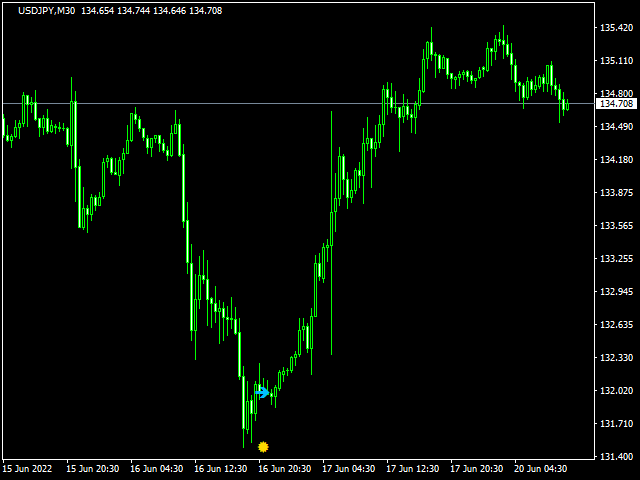
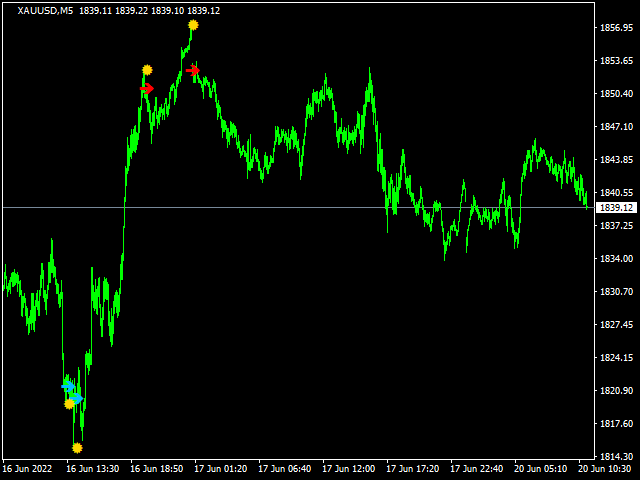
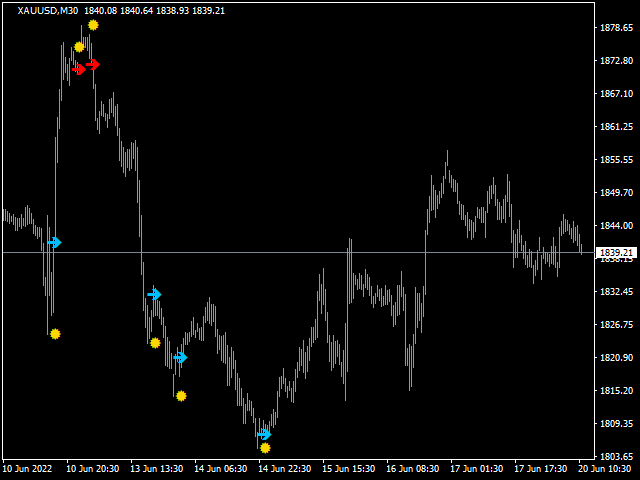
The purpose of the inidcator is to identify the reversal point.
The blue arrow is buy signal and the yellow star is its stop loss.
The red arrow is sell signal and the yellow star is its stop loss.
Alert feature: if there is a signal, the indicator will send alerts of popup window,email or mobile push.
Inputs:
- Popup Window Alert: it is false in default
- Email Alert : it is false in default
- Mobile Push Alert: it is false in default.
MetaTrader 5 Version: Reversal Point
Please note that the singal is against trend,it could be continual fail.

ユーザーは評価に対して何もコメントを残しませんでした