YouTubeにあるマーケットチュートリアルビデオをご覧ください
ロボットや指標を購入する
仮想ホスティングで
EAを実行
EAを実行
ロボットや指標を購入前にテストする
マーケットで収入を得る
販売のためにプロダクトをプレゼンテーションする方法
MetaTrader 5のためのエキスパートアドバイザーとインディケータ - 33

TG MTF MA MT5 is designed to display a multi-timeframe moving average (MA) on any chart timeframe while allowing users to specify and view the MA values from a particular timeframe across all timeframes. This functionality enables users to focus on the moving average of a specific timeframe without switching charts. By isolating the moving average values of a specific timeframe across all timeframes, users can gain insights into the trend dynamics and potential trading opportunities without sw
FREE

このプロジェクトが好きなら、5つ星レビューを残してください。 インスタグラムでフォロー:borelatech 大規模なボリュームを取引するには、複数の楽器/チャートを調べる必要があります
新しい機会を見つける, このインジケータは、特定の特定のプロットによってあなたを助ける
数またはそのサフィックスの複数のレベルによって、それらを自動的に更新します
価格が変更されると、そうでなければ退屈なタスク。 例えば、GBPUSDでは、インジケーターの4つのインスタンスを
チャートをプロットする: 線長100バーの各0.01間隔。 線の長さ25バーの0.0075間隔で終わる各価格。 線長50バーの0.0050間隔で終わる各価格。 25バーの線長で0.0025間隔で終わる各価格。 このようにして、定規に似ているので、この例が非常に見られます。
スクリーンショット。 また、色やラインのスタイルを異なるスタイルで設定できます。
レベルを視覚化しやすいようにします。
FREE

This auxiliary indicator displays time left before closing on the current timeframe with continuous update . It also shows the last trade price and variation from a previous day close in percentage and points. This indicator is pretty handy for daytraders and scalpers who want to precisely monitor closing and opening of candles.
Indicator parameters Show in shifted end - Default: False. Display time and values on screen. If True, Displays only time to close aside last candle. Distance from the
FREE

Currency Strength Meter is the easiest way to identify strong and weak currencies. This indicator shows the relative strength of 8 major currencies + Gold: AUD, CAD, CHF, EUR, GBP, JPY, NZD, USD, XAU. Gold symbol can be changed to other symbols like XAG, XAU etc.
By default the strength value is normalised to the range from 0 to 100 for RSI algorithm: The value above 60 means strong currency; The value below 40 means weak currency;
This indicator needs the history data of all 28 major curre

El indicador técnico conocido como Líneas de Tendencia Perfecta . Este indicador es una herramienta valiosa en el análisis técnico y se utiliza para mejorar la toma de decisiones en el trading. Aquí tienes una descripción paso a paso de cómo funciona y cómo puede ser utilizado por los traders: Identificación de Tendencias : Las líneas de tendencia perfecta se dibujan conectando dos o más puntos de precio en un gráfico, revelando así la dirección general del mercado. Una línea ascendente indica
FREE

FRB Trader - Our mission is to provide the best support to customers through conted and tools so that they can achieve the expected results
FRB Support and Resistance
- Indicator places lines on the chart to show Support and Resistance regions. - You can choose the timeframe you want to calculate, as well as the colors of the lines. - Algorithm calculates the points where the strengths of the asset are considered and are extremely important for decision making.
FREE

I present the well-known Fractal indicator.
Levels have been added to this indicator.
At the extreme points, you can see the continuation of the price line, which changes when the values of the Fractal indicator change.
The indicator is easy to use. The basic Fractal settings have been saved.
FractalLevels Parameters:
LeftBars - the number of bars on the left
RightBars - the number of bars on the right
FREE

//// Forex Bulls GBPUSD ////
No Martingale ,No HFT ,NO Grid one Shoot Trader Make Sure to Active Weekdays input For Bcaktesting and Live
This Expert Working 5 day a week 12 month of years Live Signal =
FTMO Mode = unique strategy where it continuously splits a single trade into seven smaller trades. This means that each time the EA executes a trade, it automatically divides it into seven smaller positions. Forex Bulls GBP USD stands out from other expert advisors due
FREE

Camarilla Swing Trade Indicator is an Indicator. Support and resistance points are calculated from the High Low Close of the previous TF Week's price.
What are Camarilla Pivot Points?
1.Camarilla Pivot Points is a modified version of the classic Pivot Point. 2.Camarilla Pivot Points was launched in 1989 by Nick Scott, a successful bond trader. 3.The basic idea behind Camarilla Pivot Points is that price tends to revert to its mean until it doesn't. 4.Camarilla Pivot Points is a mathematical
FREE

The advisor NewsCatcher Free opens trades when the price makes a reversal move from support and resistance levels. Market entries should be confirmed by the Relative Strength Index (RSI). The RSI is implemented as a tachometer. It is recommended to use this advisor in a highly volatile market after a political event or a release of major economic data.
You can use this advisor in the semi-automated mode (the RSI performs an information role) or in the fully automated mode (the RSI decides when
FREE

A new box will be added, if the closing price is higher than the maximum (lower than the minimum) of the current box series no less than for the specified value. Reversal will be made, if the closing price is higher (lower) than the last box on a value no less than the specified.
T his is a trend indicator and it can be used as an alternative for the trend definition instruments which use averaging.
FREE
私は、矢印インジケーター「RSI Arrow out of Zone iMA Trend」( https://www.mql5.com/ru/code/29363 ) から来る明確で透明なシグナルを生成する信頼できるアドバイザーを皆さんに紹介します。
このインジケーターをコードベースからダウンロードし、Indicators フォルダーにインストールします。
最適な時間枠 H1。
私はアドバイザーに次の機能を装備しました: 保護ストップ (SL/TP)、複数通貨テストの可能性、1 つのチャートからの取引 (設定で通貨のリストを指定)、トレーリング ストップと取引時間、合計利益に基づいてクローズ割合。
楽しい取引を!!! ..................................................................................................................................................................................
FREE

This indicator is a volume indicator it changes the color of the candles according to a certain number of ticks, and this number of ticks can be informed by the user both the number of ticks and the color of the candles, this indicator works in any graphical time or any asset, provided that the asset has a ticker number to be informed.
This indicator seeks to facilitate user viewing when analyzing candles with a certain number of ticks.
FREE

The indicator shows Jake Bernstein's MAC (Moving Average Channel) System signals ---------------------------------------- System assumes several types of entering in trade, in this indicator only one type implemented - on closing of second trigger bar. It is recommended to start using this indicator together with Jake Bernstein's free lessons https://www.youtube.com/@JakeatMBH/videos Arrow shows signal bar - enter on closing or on opening of the next bar, cross - stop level, dot - minimum profi
FREE

Tokyo Session Box Indicator : Draw a box of Tokyo session. Inputs tutorial: 1. Automatic: true/false. To calculate box automatic base GMT. 2. Broker time zone: if Automatic is False, you have to define broker time zone (ex: 2 ) 3. Button ON/OFF properties: x, y, corner, color, background fill, width, height, font name, font size. This button will toggle showing or hiding Tokyo session box.
FREE

CANDLESTICK_MT5
A very interesting indicator of candlestick patterns, converted from the free version of the CANDLESTICK indicator for the MetaTrader4 terminal to the version for the MetaTrader5 terminal. In addition to candlestick patterns, it draws support and resistance lines, which are perfectly worked out by the price on the chart. It can work on any timeframe. Has simple settings. When converting, the logic of work and the design of the original CANDLESTICK indicator for the MT4 termina
FREE

This is a smooth and responsive accelerometer which reveals the market trend and strength. [ Installation Guide | Update Guide | Troubleshooting | FAQ | All Products ]
Two moving averages indicate trend direction The histogram represents strength of the price movement It draws buy and sell zones as colored vertical lines Should be used as a confirmation indicator Customizable line widths and colors It implements alerts of all kinds This indicator is similar to MACD but aims to react faster t
FREE

Magic Trend
This MT5 indicator is a Moving Average with 3 signal colors. The 3 input parameters on this Indicator give you a chance to set any Moving Average of choice. A combination of 2 different exponential moving averages, relative strength index, commodity channel index, and William's percent range provide the signals.
White color = Null/No/Exit Signal Green color = Buy Signal Red color = Sell Signal
Point To Note: Confirm the color change only after the current candle closes to avo
FREE

The seven currencies mentioned are: GBP (British Pound): This is the currency of the United Kingdom. AUD (Australian Dollar): This is the currency of Australia. NZD (New Zealand Dollar): This is the currency of New Zealand. USD (United States Dollar): This is the currency of the United States. CAD (Canadian Dollar): This is the currency of Canada. CHF (Swiss Franc): This is the currency of Switzerland. JPY (Japanese Yen): This is the currency of Japan. Currency strength indexes provide a way to
FREE

This tool will remove buttons and text labels from the chart, after you remove Trading box Order management or Trading box Technical analysis .
You just need to drag this tool to your chart and after cleanup of objects is finished, the tool will remove itself from the chart.
Please check images below that present Before and After using the Removal tool.
There is also a short YouTube video at the bottom to show how easy it is to clean your chart after using Trading box tools.
- input var
FREE

Pivot Point Super trend it can be used to catch price turning points and can show arrows for buying and selling. calculations are based on price peaks . you can control the price turning points by increasing the Pivot point period input on the indicator the ATR factor is for how far apart do you want the bands to be spread apart price break outs are also spotted in their early stages which will make trading much better
FREE
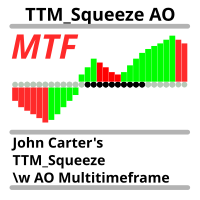
The same indicator as here Скачайте Технический индикатор 'John Carters TTM Squeeze with MACD Multitimeframe' для MetaTrader 5 в магазине MetaTrader Market (mql5.com) , but instead of MACD, Bill Williams' AO (Awesome Oscillator) is used. It goes well with a sleeping Alligator to determine periods of "compression-calm", which may be followed by significant movement.
It is useful to use an indicator from a higher timeframe (coefficient 5 or 6) to determine the possible direction of a breakout.
FREE

The trend is your friend!
Look at the color of the indicator and trade on that direction. It does not repaint. After each candle is closed, that's the color of the trend. You can focus on shorter faster trends or major trends, just test what's most suitable for the symbol and timeframe you trade. Simply change the "Length" parameter and the indicator will automatically adapt. You can also change the color, thickness and style of the lines. Download and give it a try! There are big movements
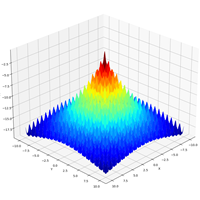
AO Core is the core of the optimization algorithm, it is a library built on the author's HMA (hybrid metaheuristic algorithm) algorithm. An example of using AO Core is described in the article: https://www.mql5.com/ru/articles/14183 https://www.mql5.com/en/blogs/post/756510
This hybrid algorithm is based on a genetic algorithm and contains the best qualities and properties of population algorithms.
High-speed calculation in HMA guarantees unsurpassed accuracy and high search capabilities,

For MT4 version please send private message. - This is the exact conversion from TradingView source: "Hurst Cycle Channel Clone Oscillator" By "LazyBear". - For bar color option please send private message.
- This is a non-repaint and light processing load indicator. - Buffers and inputs are available for use in EAs and optimization purposes. - You can message in private chat for further changes you need.

UPDATED AS OF 3.19.2024 WITH NEW QUALITY CONTROL UPDATE FOR PERFORMANCE VALIDATION! 4 MORE COPIES LEFT AT 60.00 THEN THE PRICE GOES TO 120.00 SECURE YOUR COPY WHILE THE PRICE IS LOWEST! Introducing SHRED FX, the expert advisor designed for the CADJPY H1 chart that has meticulously carved its niche in the trading world. From March 2021 to March 2024, SHRED FX's algorithm demonstrated an extraordinary ability to capture market momentum, amassing an impressive $11,700.00 net profit from a $3,000 b

EA の暗号通貨ライブティックデータの買値と売値および予約の深さ
利用可能な交換所:
1. Binance Spot (アクティブなチャートウィンドウで注文帳深度をサポート) および先物 (複数の注文帳深度をサポート)
2. Kucoin スポットと先物、アクティブなチャート ウィンドウでオーダーブックの深さをサポート
3. Bybit 先物およびインバース先物ティック データ ビッド アスク 最後
今後の取引所: OKX、MEXC など。
特徴 :
1. 買い値と売り値情報を含むライブティックデータ
2. 最高入札額と注文数量、ユーザーは設定から深さを有効/無効にできます
3. 履歴のロード: 始値高値安値終値値とティック値データを更新します
4. 履歴の自動更新:MT5ターミナルを再起動すると不足しているバーを埋める
5. 暗号データのストラテジーテスターを使用して、暗号シンボルティックのエキスパートアドバイザーであらゆる戦略をバックテストできます
6. このユーティリティは外部 DLL ファイルをロードする必

To get access to MT4 version please click here . This is the exact conversion from TradingView: "Supertrend" by " KivancOzbilgic ". This is a light-load processing and non-repaint indicator. You can message in private chat for further changes you need. Here is the source code of a simple Expert Advisor operating based on signals from Supertrend . #include <Trade\Trade.mqh> CTrade trade; int handle_supertrend= 0 ; input group "EA Setting" input int magic_number= 123456 ; //magic number input dou

To get access to MT4 version please click here . This is the exact conversion from TradingView: "ZLSMA - Zero Lag LSMA" by "veryfid". This is a light-load processing indicator. This is a non-repaint indicator. Buffers are available for processing in EAs. All input fields are available. You can message in private chat for further changes you need. Thanks for downloading

Drawdown Limit EA Prop Firm trading MT5
If you found this EA, it's probably because you want to get a funded account with a prop firm, but you see a rule that most of traders fear : Maximum Daily Drawdown. I've been through this problem myself as I'm a prop firm trader and I've made a bot to solve this rule, and you can get it to solve this problem too.
How does it work ?
When you first setup this EA, you need to input the initial deposit which corresponds to the size of your funded accoun

If You Are Discretionary Trader This Tool Is A Must Chart Switcher ------> Linking Multi-Time Frame Charts / Syncing Indicators And Drawings. Main USP Of This Indicator: Is Opening Multi-Time Frame Multiple Charts {Up To 10 Charts} Of A Symbol With Just 1 Click. You Do not Have To Save Any Template As It has Been Save Auto When You Click Same Symbol Or Move To Another Symbol. It Is Divided Into 2 Parts: 1} COMMON MODE and 2} SYMBOL MODE 1} COMMON MODE: Under This Mode, You Can Sync Commo

Golden_Star MT5 は、プロのトレーダーのグループによって開発されたMT5プラットフォームのプロのトレンドインジケーターです。 その作業のアルゴリズムは、元の著者の方法に基づいています。これにより、潜在的なトレンド反転ポイントを高い確率で見つけ、トレンド形成の開始時に市場に参入するためのシグナルを受信できます。 このインジケーターは、外国為替で金、暗号通貨、通貨ペアを処理するのに適しています。 アラートシステム(アラート、電子メール、モバイル通知)は、複数の取引商品を同時に監視するのに役立ちます。 チャートにインジケーターをインストールするだけで、インジケーター信号が表示されるとアラートがトリガーされます。 私たちのアラートシステムを使用すると、ポジションを開くためのシグナルを見逃すことはありません! Golden Starインジケーターを使用して取引するのは非常に簡単です。インジケーターラインが緑色の場合、買いポジションを開きます。 インジケーターラインが赤の場合は、売りポジションを開きます。
このインジケーターを購入すると、次のようになります。
優れたインジケータ

This is a buyer and seller aggression indicator that analyzes the shape of each candle and project this data in a histogram form. There are 4 histograms in one. On the front we have two: Upper - Buyer force. Lower - Seller force. At the background we also have two histogram, both with same color. They measure the combined strenght of buyers and sellers. This histograms can be turned off in Input Parameters. It is also possible to have the real or tick volume to help on this force measurement. IN
FREE

Genaral: Not martingale, not a grid; Use on EURUSD Use on M5 EA was opimized only on 2020 year
Signals: There is a good rational algorithm. Work of 3 indicators: WRP, DeMarker, CCI (from 3 timeframes) (you can set a separate Timeframe for each indicator)
Stop Loss/Take Profit: There is a good money management system (there are several type for trailing stop loss); There is virtual levels of Stop Loss / Take Profit; There is smart lot (percent by risk) or fix lot
Important: EA can work
FREE

Profitable Scalper EA - Rôla Scalper! Tested on EURUSDm Symbol on Micro Account created in XM Broker, but you can try it in any market or broker, any way I recommend that you use it on markets with volatility similar to EURUSD.
This EA can open a lot of positions, so I recommend that you use a broker that don't have comission fee and provide low spread.
You can use settings on 5 minutes timeframe, since I started to use it, and in tests, the maximum drawdown with this settings and M5 timefr
FREE

Cointegration Pair Trading Indicator
Indicator for statistical and quantitative pair trading strategies. You can perform Long&Short or Long&Long/Short&Short between two different assets.
The indicator performs a series of statistical tests between the assets and shows whether the pair is cointegrated or not.
Suggested Usage Strategies
(a) Verify if that the pair is cointegrated by the ADF test (Augmented Dickey-Fuller Test). 0% means the pair is not cointegrated; 90% 95% 97.5% and 99% means

This indicator is based on the Parabolic SAR indicator. It helps the user identifying whether to buy or sell. It comes with an alert that will sound whenever a new signal appears. It also features an email facility. Your email address and SMTP Server settings should be specified in the settings window of the "Mailbox" tab in your MetaTrader 5. Blue arrow up = Buy. Red arrow down = Sell. Line = Trailing Stop. You can use one of my Trailing Stop products that automatically move the Stop Loss and i
FREE
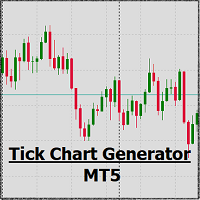
Tick Chart Monitor with countdown tick volume and easy to change tick size without going back to main chart. This work with Tick Chart Generator , which are available for download from the MQL5 Market: Tick chart generator: https://www.mql5.com/en/market/product/79763 NOTE: Custom symbols on MT5 are not directly tradable. This is by Metatrader5 design. If you want to place trades directly on the custom symbol generated by this product, you will either need a trade panel that offers this functi
FREE

AliSession Highlight is an indicator that highlights a specific period of time according to your preferences. It can help you gain a clear vision of price movements into a specific session, the range of a session, and also to easily identify the high and low of the session. You can use it on any currency pairs, indices, and any timeframes. Settings: Start Hour: Set the hour to initiate the session highlight. Start Min: Set the minute for the start of the session highlight. End Hour: Specify the
FREE

高精度の取引と市場全体のために設計されたスリッページ分析 ライブ口座とデモ口座の両方で機能し、テイク プロフィットとストップ ロスを使用してすべてのポジションを分析できるため、ブローカーのスリッページを分析できます。
取引におけるスリッページとは? スリッページまたはスライディングは、取引注文が出された瞬間と市場での実際の実行との間に発生する可能性がある価格の差です。
これは、注文が取引プラットフォームで発注され、市場で実行されてから、価格が変動する可能性がある非常に短い期間があるためです。
この要求価格と最終的に得られる価格の間の値動きがスリッページです。
私の他の開発はここで見ることができます
テイクプロフィットとストップロスですべてのポジションを使用して、すべてを正確に識別できるようにすることをお勧めします
サポートが必要な場合は、購入後すぐに連絡してください
着信パラメータ -
3つの高度な構成があります -構成モード 1 時間分析 -構成モード 2 平均化モード -構成モード 3 スリッページの分析
多くの場合、スライドするオ
FREE

This indicator scans for you up to 15 trading instruments and up to 21 time frames for occurrences of the high probability reversal patterns: Double Tops/Bottoms with fake breakouts . What this indicator detects: This indicator detects a special form of Double Tops and Bottoms, so called Double Tops/Bottoms with fake breakouts . For double tops with fake breakouts the highest price of the right shoulder must be higher than the left shoulder. For double bottoms with fake breakouts the lowest pric

This indicator evaluates the market sentiment using raw price action measurements, and it is an amazing trading confirmation. It can be used to take a trend-trade approach or a contrarian approach using reversal patterns. [ Installation Guide | Update Guide | Troubleshooting | FAQ | All Products ] Find early reversals Confirm short-term trades Detect indecision on the market Take contrarian trades near support and resistance levels Trade inside bars confirmed by overall direction of the market T
FREE
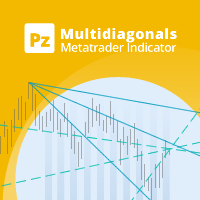
This indicator connects past price points drawing diagonals and trend lines, which converge in the future creating hidden reversal points. [ Installation Guide | Update Guide | Troubleshooting | FAQ | All Products ] Find hidden reversal points Spot convergence zones easily Dense criss-cross zones are reversal points Configurable amount of lines and price points Configurable colors
How to use the indicator The indicator draws several lines on the chart, and where many of these lines converge a
FREE

A pin bar pattern consists of one price bar, typically a candlestick price bar, which represents a sharp reversal and rejection of price. The pin bar reversal as it is sometimes called, is defined by a long tail, the tail is also referred to as a “shadow” or “wick”. The area between the open and close of the pin bar is called its “real body”, and pin bars generally have small real bodies in comparison to their long tails.
The tail of the pin bar shows the area of price that was rejected, and
FREE

Whether you are a scalper or daily trader, you will always look for bullish / bearish engulfing candles. This can be a bit tricky and stressful when you try to visually identify the engulfing candles on the chart. Not only that, you might be trading on the M15 time frame but the engulfing candle is forming or has already formed in the H4 time frame. This indicator is made to do that on your behalf. You can trade on any time frame and see Engulfing candles of another time frame, this means that
FREE
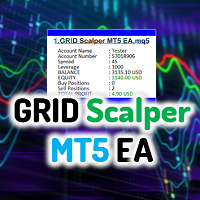
GRID Scalper MT5 EA is a FULLY Automated Trading Expert Advisor whose control logic is based on the Grid Trading strategy. GRID Scalper MT5 EA stands out from other expert advisors due to its remarkable approach to handling trades. With predefined optimization, the EA has proved to have a 75% rate of return. Basically, it uses martingale system to significantly counter trades that are in loss. The EA has added Break Even and Trail Stop mechanism that is activated when the set points deemed fit

Several assets in several markets have the behavior of using specific numbers as Force Numbers, where support, resistance and price thrust is created. Let this indicator draw those levels of support and resistance for you. You can also stack it to show different level of Prices! This technique is being used by Tape Readers and Order Flow traders all over the world for a long time. Give it a try. Challenge yourself to study new ways of Price Action!
SETTINGS
What Price reference to use in th
FREE

The Market Momentum indicator is based on the Volume Zone Oscillator (VZO), presented by Waleed Aly Khalil in the 2009 edition of the International Federation of Technical Analysts journal, and presents a fresh view of this market valuable data that is oftenly misunderstood and neglected: VOLUME. With this new approach of "seeing" Volume data, traders can infer more properly market behavior and increase their odds in a winning trade.
"The VZO is a leading volume oscillator; its basic usefulnes
FREE

Expert advisor based on your own personal moving average strategy. Whatever your strategy is, it's him. You can use it on all parities. No restrictions. Settings Buy Settings : 1.Moving Average Period 1.Moving Average Method 2.Moving Average Period 2.Moving Average Period Buy Lot Size Buy Stop Loss Level Buy Take Profit Level
Sell Settings : 3.Moving Average Period 3.Moving Average Method 4.Moving Average Period 4.Moving Average Period Sell Lot Size Sell Stop Loss Level Sell Take Profit Level
FREE

The standard Fractals Bill Williams indicator with the ability to specify the number of candles for formation. The indicator works on all charts and timeframes.
Settings: candles - the number of candles to the left and right on the basis of which the fractal is built (in the classic indicator this value is always 2)
Contact: If you have any questions or need assistance, please contact me via direct message. Author: Fertikov Serhii, More of my indicators, advisors, scripts are available i
FREE

Hello, This indicator is a unique high reliability 7-in-1 multicurrency indicator comprising these sub-indicator’s: A Trend Power Crossover Indicator. A Percent Change Crossover Indicator. A Currency Overbought/Oversold Indicator. A Currency Deviation Indicator. A Currency Impulse Signal Indicator. A Trend Power Indicator. A Currency Volatility Indicator. The main advantage of this indicator is that it's reasoning by currency and not by currency pair. The values of each sub-indicator are calcula
FREE

Blahtech Moving Average indicator is a multitimeframe version of the standard Moving Average indicator. It is also enhanced with customisable alerts, period breaks and other configuration options. The 50 day and 200 day moving averages are widely followed by investors and traders, with breaks above and below the MA lines considered to be signals of interest. Links [ Install | Update | Training | All Products ]
Feature Highlights Up to three timeframes Configurable calculation variab
FREE
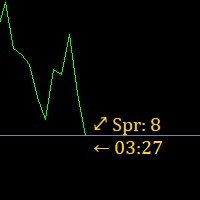
Super simple, convenient, useful tool. Allows displaying the end time of a candle (standard) and expanding the symbol's spread in real time.
The countdown tool is smooth, not jerky or slow like some other tools
Useful tool for professional traders specializing in short-term and long-term trading.
Contact author or user guide: https://www.mql5.com/en/channels/metool_trading
FREE

The Forex Breakout Scalping EA follows a scalping breakout strategy. It trades the breakouts from relative highs and lows. For the entry stop orders are used for the fastest possible execution. Profits can be secured by the adjustable trailing stop .This is also a high frequency breakout trading system. It produces high return if compounded properly with high speen internet and low commission. Since the strategy works with small average profits it is highly suggested to trade with a low spread a
FREE

HighDaily
このエキスパートアドバイザーは、HighDaily、ATR、および保留注文に基づいて、EURUSD H1向けに開発されました。20年以上のティックデータを使用して99%のモデリング品質でバックテストされました。添付されたスクリーンショットは、モンテカルロ分析による1000回のシミュレーションでの堅牢性テストを示しています。より良いパフォーマンスのためにスプレッドとスリッページの少ないブローカーをお勧めします。パラメーターを設定する必要はありません、これらの設定は最適化されています。 大口口座を使用する必要はありません。私は200米ドルから0.01ロットで取引することをお勧めします。
モンテカルロテスト
1000回のシミュレーション ティックデータを30%の確率でランダム化し、最大価格変動ATRを10%上下にランダム化 スプレッドを0から3にランダム化 戦略パラメーターを20%の確率でランダム化し、最大変更10%
テストのワークフロー
IS/OOSテスト、テスト期間を10部分に分割します。 異なる時間枠(30M)でのテスト。 最近性のテスト。 モンテカ
FREE

At first, I got my teeth into Dragon Ultra Expert Advisor. Take your time to test demo. You should be always perfectly familiar with your Expert Advisor before a live trading. Based on the statistics, you are more likely to succeed if you learn from experience to use this. Dragon Lite is a free version for you to understand how the bot works. Parameter Trading Mode: Change to UNLIMITED. You should use the Dragon Training proficiently before using the Dragon Ultra .
The Forex T
FREE

Highly configurable Bollinger Bands indicator. Features: Highly customizable alert functions (at levels, crosses, direction changes via email, push, sound, popup) Multi timeframe ability Color customization (at levels, crosses, direction changes) Linear interpolation option Works on strategy tester in multi timeframe mode (at weekend without ticks also) Parameters:
Bollinger Bands Timeframe: You can set the lower/higher timeframes for Bollinger Bands. Bollinger Bands Bar Shift: Y ou can set t
FREE

Indicator Introduction: The indicator comes from network ,It is more stable relative to RSI or CCI. It can be used to analyze market trend and design new expert that is based on trend. If the indicator below the axis ,this is a buy zone. The trend indicator is suitable for M1 and above timeframes. The work of the indicator is shown in the screenshots. My other indicators and EAs can be found at here : https://www.mql5.com/zh/users/hzx/seller
FREE

トレーダーのベストパートナー! 取引アシスタントの操作手順 基本的な使用設定 基本: 言語選択スイッチをサポート (現在中国語と英語をサポート) 自動言語認識 バインディングをサポート ポジションを開閉するホットキー 、ショートカット キーを使用してポジションをすばやく開閉します... ポジションを閉じるためのショートカット キー。 ロック解除はほとんどの機能をサポートします リプレイ で使用できる操作 テスト環境 オープンポジションとクローズポジション: ワンクリックでポジションをオープン ( テイクプロフィットとストップロスの便利な設定、ロットサイズの自動計算などの便利な機能を含む) ワンクリックで閉じる (ロック)、ミニマリストスタイルのデザイン、クローズポジションのタイプ、クローズポジションのタイプ(ロング注文、空の注文、または未決注文)、利益が0より大きい注文をクローズするかどうか、損失注文をクローズするかどうか、クローズ率の設定(0〜100%)、クローズを反転するか

The Martinware Volume indicator plots a colored moving average over volume bars. The coloring uses three colors and can be done in different ways choosable by the user and is applied both to the average as to the volume bars.
Three types of coloring are possible: None: no coloring is done Increasing or decreasing: changes the color depending on the current value being bigger or lesser than the previous one Volume relative to average: colors vary if the current volume is bigger or lesser then
FREE

サイレントトレーダー
完全に自動化されたサイレントトレーダーEAは、マネーフローインデックス、フォースインデックス、アリゲーター、標準偏差の4つのインジケーターからシグナルを受信した後にポジションをオープンします。ストップロスとテイクプロフィットも含まれています。
GBPJPY M30
エントリーロット:最小0.1
ストップロス:162ピップ
利益を得る:197ピップ
最小数:500-1000 $
最大スプレッド:20ポイント
アカウントのレバレッジ-1:500から。
ターミナル-MetaTrader5
勧告:
üMaxLotSize-最大許容取引ロット。このパラメーターは、自分が何をしているかを本当に理解している場合にのみ変更してください。
üTakeProfit-ポイントで利益を取ります。
üStopLoss–ポイントの損失を停止します。
üEAMagic-EAのマジックナンバーであり、アドバイザーがそのポジションでのみ作業できるようにします。グラフごとに異なる値を設定する必要があります。
üこの
FREE

Many Forex traders assume there is no volume in the foreign exchange market. And they would be correct. There is no central exchange, not yet anyway. And even if there were, what would it report? What there is however is activity, and this is captured as tick volume. After all, volume is simply displaying activity, the buyers and sellers in the market. So for volume read activity, and for activity read volume – simple. The MT5 platform delivers tick data which the Quantum Tick Volumes indicator

ある MT5 または MT4 アカウントから別の MT5 アカウントに取引量をコピーするためのシンプルなユーティリティ。 ネッティング口座とヘッジ口座の間で任意の組み合わせでポジションをコピーできます。デフォルトでは、同じボリュームを持つすべての一致するシンボルによって開かれたポジションがコピーされます。シンボル名が異なる場合、またはコピーされたポジションのボリュームが異なる場合、またはすべてのポジションをコピーする必要がない場合は、この 投稿 で説明されている設定で目的の動作を指定できます。この製品は、将来のリリースで機能を拡張します。 バージョン 2.0 までは、この製品は無料です。 インストール順序:
送信者アカウントの端末で、Expert Advisor を送信者モードで起動します。 受信者アカウントのターミナルで、Expert Advisor を受信者モードで起動し 、以前に起動した送信者の 1 つを選択して、そこからポジション ボリュームをコピーします。
FREE

Простой советник основанный на сигналах индикатора Relative Strength Index (RSI) в зоне перекупленности - продаем, в перепроданности - покупаем. Моя версия всем известного "Dynamic". Я рекомендую использовать этот советник в полуавтомате.
Добавляйтесь в друзья, присылайте свои интересные стратегии. Возможно после обсуждения всех нюансов напишу советника бесплатно . Параметры: "_Slippage" - Проскальзывание; "_
FREE

This indicator draws regular bullish and bearish divergences in real-time onto the charts. The algorithm to detect those divergences is based on my 10+ years experience of detecting divergences visually. The divergences are drawn as green and red rectangles on the charts. You can even do forward testing in the visual mode of the strategy tester. This FREE Version is restricted to EURUSD and GBPUSD. The full version without restrictions is here: https://www.mql5.com/en/market/product/42758
Par
FREE

Auto Levels is a technical analysis indicator designed to automatically identify and draw support and resistance levels on price charts. The robot is capable of automatically identifying support and resistance levels based on historical price patterns, eliminating the need for manual analysis. You can set the maximum number of lines that the indicator plots as a parameter
FREE

The selective pin bar is designed to identify reversals. To use the selective pin bar effectively, traders typically look for Strong Rejection: The tail of the pin bar should extend significantly beyond the surrounding price action. It indicates that there was a sharp rejection of higher or lower prices during the trading period. A strong rejection suggests that the market sentiment may be changing.
FREE

Introducing TRAD-E- LITE : Your Ultimate Trading Assistant! Are you tired of manually analysing the markets and executing trades? TRAD-E- LITE is here to assist you! Developed by Gold Lion XI, this expert adviser utilizes advanced algorithms to identify profitable trading opportunities and execute trades automatically, saving you time and effort. Key Features: Trading Time Management: Take control of your trading schedule. With TRAD-E- LITE , you can define specific trading hours based on your p
FREE

TransitGhost Signal indicator, this is one of my best forex trading strategy. The strategy is based on the simple moving average cross, 5 SMA AND 200 SMA of which take a longer time to cross. Whenever the is a cross between the 5 SMA and 200 SMA a signal will be given, when the 5 SMA cross the 200 SMA to the upside ,a buying arrow will appear on chart, and push notification(alert) "Buy now, use proper risk management" will be sent on both the MT5 PC and mobile app, and when the 5 SMA cross the 2
FREE

Baby ADX (BBADX ADXBB) Lo he diseñado con el propósito de operar automáticamente desde y para cuentas muy pequeñas (recomendable para cuentas de tan solo 100 USD ) y un apalancamiento de 1:30 aunque un apalancamiento mayor es preferible, con mayor capital no se obtiene un beneficio mayor proporcional, si no una reducción proporcionalmente menor. Con objetivo de alcanzar el punto de equilibrio a corto, medio plazo para retirar el capital y seguir operando tan solo con el beneficio obtenido en rie
FREE
MetaTraderマーケットが取引戦略とテクニカル指標を販売するための最適な場所である理由をご存じですか?宣伝もソフトウェア保護も必要なく、支払いのトラブルもないことです。これらはすべて、MetaTraderマーケットで提供されます。
取引の機会を逃しています。
- 無料取引アプリ
- 8千を超えるシグナルをコピー
- 金融ニュースで金融マーケットを探索
新規登録
ログイン