YouTubeにあるマーケットチュートリアルビデオをご覧ください
ロボットや指標を購入する
仮想ホスティングで
EAを実行
EAを実行
ロボットや指標を購入前にテストする
マーケットで収入を得る
販売のためにプロダクトをプレゼンテーションする方法
MetaTrader 5のためのエキスパートアドバイザーとインディケータ - 25

Encrypter 2 EA 1.7 で取引を次のレベルに引き上げる準備をしましょう! 取引体験をさらに向上させるために追加された最新機能をご覧ください。 新しい高度なツールを使用して結果を改善し、よりスマートな取引を行います。
注目の機能: 強力な分析: MACD や SAR などの優れたテクニカル指標を使用して、市場を正確に分析します。 賢明な決断: 市場の状況を評価し、高度なアルゴリズムに基づいて情報に基づいた意思決定を行います。 自動操作: 事前に定義された条件が満たされた場合に操作が自動的に実行されるため、定期的に手動で介入する必要がなくなります。 カスタム戦略: 好みに合わせて、独自のスタイルと財務目標に基づいて戦略を調整します。 高度なリスク管理: 潜在的な利益と資本の保全のバランスをとるインテリジェントなシステムで資本を保護します。 問題なくヘッジ: ヘッジ戦略と互換性があるため、運用を柔軟に管理できます。 継続的な監視: 市場の状況を常に分析し、リアルタイムで自動調整を行います。 検証可能な結果: 100% 品質の履歴データを使用した広範なバックテストに裏付けら

The EA has the same trading principle as SMARTHEDGE . We trade simultaneously on drum instruments with high correlation. Transactions made on one instrument compensate for the drawdown of transactions on the other instrument. Thus, we can trade fairly large volumes with relatively low risk. The principle of operation is clearly visible in the video below.
In this expert Advisor, I tried to simplify the settings as much as possible, but left all the main functions from the early development.

キャンドルボットのご紹介 - ローソク足パターンを認識しトレードするための究極の無料ツール!キャンドルボットを使用して、簡単に高値と低値の両方に認識できる牛さんと熊さんのエングルフィング、モーニングスター、イブニングスター、そしてハンマーシグナルを活かし、市場で優位性を得ましょう。特定の期間にわたる始値、高値、安値、終値から導き出されたローソク足パターンは、価格動向の視覚的な表現となり、トレーダーが市場センチメントを分析し、潜在的な逆転や継続を予測するのに役立ちます。 ローソク足パターンの理解: エングルフィングパターン: 二つのローソク足から成り立ち、二つ目のローソクが完全に最初のものを覆います。ベアッシュエングルフィングは下降トレンドの終わりにおいて上昇トレンドの反転の可能性を示し、ブルッシュエングルフィングは上昇トレンドの終わりにおいて下降トレンドの反転の可能性を示唆します。エングルフィングキャンドルの本体が大きいほど、そのシグナルは強力です。 ハンマーパターン: 一本のローソク足で、本体が上部近くに小さく、下部に長い尾を持つハンマーのような形です。ブルッシュハンマーは下降トレン
FREE

JCAutoFibonacci 简繁自动绘制斐波那契 1.Zigzag3浪,大中小三浪分别代表市场潮流、趋势、涟漪,以不同参数实现。 使用自定义函数获取三浪高低点,以最近高低点作为绘制价格与时间。 2.Fibonacci,黄金分割线,水平线比例0、0.236、0.318、0.50、0.618、1.0、1.236、1.382、1.50、1.618、2.0等。 斐波那契返驰理论包括:反弹/回调现象、反转现象。合理绘制Fibonacci获取市场有效SR。分别绘制三浪。 3.自定义Fibo颜色,自定义水平线比例(0为不显示),自定义水平线颜色,自定义可选择,自定义右射。 备注:如遇使用问题,请联系邮箱:16692618587@163.com
FREE
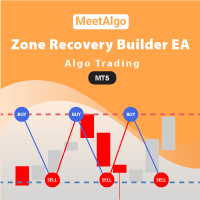
CAP Zone Recovery Strategy Builder EA MT5 is a another version of our Main Product CAP Zone Recovery EA. This EA is a strategy builder type EA has more then 34+ build in indicator that you can make more then 1 million combination strategy that boost you trading strategy. Also this Builder offers an incredible amount of functionality with zone recovery strategy. So you can test your strategy easy way without knowledge of coding. [ Installation Guide | Update Guide | Submit Your Problem

knight Rider EA 100% Profitable Expert Advisor 5 minutes Chart ||USDJPY||1H Chart EURUSD||500$ account||Try to use low spread Account According to MQL5 rules EA is in low Risk setting you can change according to your wish
FREE

A professional tool for trading - the divergence indicator between the MACD and the price, which allows you to receive a signal about a trend reversal in a timely manner or catch price pullback movements (depending on the settings). The indicator settings allow you to adjust the strength of the divergence due to the angle of the MACD peaks and the percentage change in price, which makes it possible to fine-tune the signal strength. The indicator code is optimized and is tested very quickly as
FREE

Descubre el poderoso aliado que te guiará en el laberinto de los mercados financieros. Este indicador revolucionario te llevará de la incertidumbre a la claridad, permitiéndote identificar con precisión los puntos de inflexión del mercado. Mejora tus decisiones de entrada y salida, optimiza tus operaciones y ¡multiplica tus ganancias con confianza.
¡Para más información, te invitamos a unirte a nuestro canal de Telegram en https://t.me/Profit_Evolution ¡Allí encontrarás contenido exclusivo, a
FREE

Trendy Stock is a price following indicator that uses Stochastic to show when the price is out of the oversold or overbought areas. The algorithm allows you to stay longer in a trend where the bulls or bears are in control. The indicator changes color immediately the price exits oversold/overbought state. In short, the downtrend [red] bars start to paint when the buying pressure decreases while the uptrend [green] bars form as the buy pressure kicks in. For MT4 version, follow :: https://www
FREE

INFOPadはMetaTrader 5ターミナルで選択された通貨ペアに関する情報を作成する情報パネルです。 この指標には5つの機能があります。 選択したシンボルの主および主な情報を表示します。売値、スプレッド、ストップレベル、スワップ、ティック値、コミッション価格。 SL目標とTP目標(確立されたストップロスとテイクプロフィットのポイント数、ドル額)の将来の目標を示します。 今日、週、月、年、選択した通貨の総利益などの期間に受け取った利益が表示されます。 それは現在のオープンポジション、そのロット(ボリューム)、ポジション数、ポイントでのポジションの利益、ドル、パーセントを表示します。 オープンディールのチャートに追加情報を表示します。それはストップロスを示し、利益レベルとこれらのストップレベルの目標を取ります。 トランザクションがシンボルに対して開かれたとき、トランザクションが閉じられたとき、トランザクションが変更されたときに、ログファイルに情報を書き込みます。 取引の開始時、取引の終了時、取引の変更時にサウンドファイルを再生します。 トランザクションを開くとき、トランザクション
FREE

Harmonic patterns are characteristic series of price movements with respect to Fibonacci levels, which statistically precede price reversals. This indicator searches for harmonic patterns. It is capable of recognising 26 classical and non-classical harmonic patterns : Classical Gartley Butterfly Alternate Butterfly Bat Alternate Bat Crab Deep Crab Three Drives Non-classical Shark Alternate Shark Cypher 5-0 Anti Gartley Anti Butterfly Anti Alternate Butterfly Anti Bat Anti Alternate Bat Anti Crab

次の価格は125ドルです IntelliAlpha Premiumの紹介:あなたのForex取引のパートナー こんにちは!心を込めて作成したIntelliAlpha Premiumをご紹介できることにわくわくしています。これは、ただのエキスパートアドバイザーではなく、Forex取引の世界でのあなたの伴侶です。あなたがこれから取引を始める初心者であろうと、長年の経験を持つトレーダーであろうと、取引の旅をより楽しいものにするためにデザインしました。 IntelliAlpha Premiumが好きな理由: 使いやすさ:取引がいかに圧倒的なものかを知っているので、IntelliAlpha Premiumを設定して使うのが簡単になるようにしました。複雑な設定に悩まされることはありません。 市場に適応:市場は常に変化しており、あなたの取引戦略も同様に変化するべきです。IntelliAlpha Premiumは現在の市場状況に基づいて戦略を調整し、あなたに優位性を提供します。 固定SLとTP:固定ストップロス(SL)とテイクプロフィット(TP)の新機能により、取引にさらにコントロールを持たせ、自動的

Bollinger Bands % or Bollinger Bands Percentage is one of the indicators used in the Sapphire Strat Maker - EA Builder .
It is calculated using the following formula:
Perc = (CLOSE_PRICE - LOWER_BOLLINGER) / (UPPER_BOLLINGER - LOWER_BOLLINGER) * 100
Thus, by taking the difference between closing price to the lower band and dividing it by the difference of the upper and the lower price levels of a Bollinger Bands indicator, we can calculate this indicator.
It shows how far the price is f
FREE

Secret Code トレーディングアドバイザーは、有名トレーダーの長年の経験に基づいて開発された高度なトレーディングシステムです。 このアドバイザーは、EUR/USD 通貨ペアの取引に焦点を当てており、高リスクの取引方法の使用を回避しているという事実によって区別されます。 特に、グリッド取引、マーチンゲール法、ダブリングダウン法などのアプローチは使用しません。 注目のトレーダー。 部数は100~150部までとさせていただきます。
25 部ごとにアドバイザーのコストが 200 ドル増加します
購入後、次のレベルのアドバイザーをギフトとして受け取るために私に連絡してください!!!
シークレットコードアドバイザーの主な特徴: セキュリティ: 危険な取引方法を排除することで、過度のリスクを回避するトレーダーにとって、より予測可能で信頼できるオプションになります。
戦略: アドバイザーの戦略は、自動取引に適応された実証済みの取引原則に基づいています。
ツール: EUR/USD 通貨ペアに特化することで、アドバイザーはこの市場の特定の特徴に合わせてアルゴリズム

BEETLEJUICE IS NOW FREE FOR ALL COMMUNITY MEMBERS!!! EXPERIENCE THE AWESOME PERFORMANCE WITHOUT COMING OUT OF POCKET!! Introducing the 'Beetlejuice' EA: a powerhouse in the forex trading arena, meticulously crafted for the EURGBP H1 chart. This expert advisor embodies precision, profitability, and unparalleled performance, making it a must-have tool for serious traders. Key Features: Astounding Profitability: The 'Beetlejuice' EA has turned a modest $3,000 starting balance into a staggering $70,
FREE

McS Super Trend -This is one of the most popular classic trend indicators. It has a simple setting, allows you to work not only with the trend, but also displays the stop loss level, which is calculated by this indicator. Benefits:
Instruments: Currency pairs , stocks, commodities, indices, cryptocurrencies. Timeframe: М15 and higher. Trading time: Around the clock. Shows the direction of the current trend. Calculates the stop loss. It can be used when working with trading. Three types of n
FREE

This indicator calculates gann support and resistance prices with use gann pyramid formulation and draw them on the chart. And If you want, Indicator can alert you when the current price arrive these pivot levels. Alert Options: Send Mobil Message, Send E-mail, Show Message and Sound Alert Levels: S1, S2, S3, S4, S5, R1, R2, R3, R4, R5 Inputs: GannInputPrice: Input price for gann pyramid formulation. GannInputDigit: How many digit do you want to use for calculation formula. (The number and the
FREE

Disclaimer : Keep in mind that seasonal patterns are not always reliable. Therefore, thoughtful risk management is crucial to minimize losses. Seasonal patterns in the financial world are like a well-guarded secret that successful investors use to their advantage. These patterns are recurring price movements that occur during specific periods or around special events. Additionally, there are also intraday patterns that repeat. For example, Uncle Ted from Forex Family suggests examining previou

このインディケーターはダブルトップとダブルボトムの反転パターンを見つけ、ブレイクアウトを使用して取引シグナルを発生させます。 [ インストールガイド | 更新ガイド | トラブルシューティング | よくある質問 | すべての製品 ]
クリアな取引シグナル カスタマイズ可能な色とサイズ パフォーマンス統計を実装します カスタマイズ可能なフィボナッチリトレースメントレベル 適切なストップロスとテイクプロフィットのレベルを表示します 電子メール/音声/視覚アラートを実装します これらのパターンは拡張でき、インジケーターは再描画によってパターンに追従します。ただし、インジケーターはトレードを容易にするためにツイストを実装します。トレードをシグナルする前に正しい方向へのドンチャンブレイクアウトを待機し、シグナルを非常に信頼性が高く、ほとんど再描画しません。
入力パラメータ
振幅:振幅は、代替価格ポイント間のバーの最小量を表します。大きなパターンを見つけるには、振幅パラメーターを大きくします。小さなパターンを見つけるには、振幅パラメーターを小さくします。 最小リトレースメント:

Rental/Lifetime Package Options and Privileges * For optimum results the yearly or lifetime package is suggested due to live training !
Rent Monthly Six Months Yearly/Lifetime Weis Wave with Speed with Alert+Speed Index x x x Manual x x x Quick Set up Video x x x Blog x x x Lifetime Updates x x x Setup and Training Material
x x Free Rectangle Break Alert Tool x Discord Access Channel "The SI traders"
x 2-hour live methodology training
x
How to trade with it: http://

The DYJ SignalSourceOfWPR is based on WPR indicator. It can be used for any currency pair and timeframe. The WPR recommends Indicator values ranging between 80 and 100% indicate that the market is oversold. Indicator values ranging between 0 and 20% indicate that the market is overbought. The entry signal of this indicator is a turning point in the trend.
The indicator uses analog trading technology,
Provide you with indicators to evaluate the overall profit of the opening signal and clo

SST Chart Trade creates a new experience for the trader and investor using Metatrader 5.
Available in English and Portuguese !
It creates a control panel that has the following features:
Selection of Stop Loss and Take Profit, independently Volume Quantity Selection 3 Quick Quantity buttons Easy-to-identify buttons for Buy, Sell, Buy at Bid Price or Sell at Ask Price Reset button that automatically closes your position Cancel orders + Fkat button, which in addition to closing your posit
FREE
This is a strategy builder . One of a kind. Turn your trading strategies and ideas into Expert Advisors without writing single line of code. Generate mql source code files with a few clicks and get your fully functional Expert Advisors, which are ready for live execution, strategy tester and cloud optimization.
There are very few options for those who have no programming skills and can not create their trading solutions in the MQL language. Now, with Bots Builder, anyone can create Expert Advi
FREE

The indicator IQuantum shows trading signals for 10 symbols in the daily chart: AUDUSD, EURGBP, EURUSD, GBPCHF, GBPUSD, USDCAD, USDCHF, USDJPY, USDNOK, and USDSEK.
Signals of the indicator are produced by 2 neural models which were trained independently from one another. The inputs for the neural models are normalised prices of the symbols, as well as prices of Gold, Silver and markers of the current day.
Each neural model was trained in 2 ways. The Ultimate mode is an overfitted neural mo
FREE

Are you tired of plotting Fibonacci retracements or extensions manually? This indicator displays Fibo retracements or extensions automatically, calculated from two different price points, without human intervention or manual object anchoring. [ Installation Guide | Update Guide | Troubleshooting | FAQ | All Products ] Easy to use Manual anchoring is not needed Perfect for price confluence studies The indicator evaluates if retracements or extensions are needed Once drawn, you can manually edit t
FREE

Stochastic indicator alerts when EA Available in comments , must have indicator installed buys stochastic main line is above signal line stochastic is below 30 rsi 5 is below 20 sell stochastic main line is below signal line stochastic is above 70 rsi 5 is above 80 ADD to chart Stochastic k 30 - d 9 - slowing 3, levels 30/70 rsi 5 lelels 20.80
Full alerts push, mobile , email ect All input settings variable feel free to contact for more information or alert sugestions
FREE
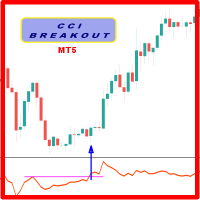
Probability emerges to record higher prices when oscillator breaks out oscillator historical resistance level when exhibit overbought values. Since, oscillator breakout of support and resistance have similar effect as price breaks support and resistance levels, therefore, its highly advised to confirm price breakout with oscillator breakout; certainly, will have the same output in short trades. Concept is based on find swing levels which based on number of bars by each side of peak or trough -
FREE

プレシジョン・インデックス・オシレーター(Pi-Osc)は、Precision Trading SystemsのRoger Medcalfによるものです。
バージョン2は、チャートにスーパーファストでロードされるように注意深く再コードされ、その他の技術的な改良も組み込まれて、エクスペリエンスを向上させています。
Pi-Oscは、市場が強制的に行かなければならない、すべての人のストップを取り除くためのポイントである、極限のエクソースト・ポイントを見つけるために設計された正確な取引タイミング信号を提供するために作成されました。
この製品は、極限のポイントがどこにあるかを知るという古代の問題を解決し、トレーダーの生活をはるかにシンプルにします。
これは、業界標準のオシレーターとは異なる強力な要素を持つ高度なコンセンサス・インジケーターです。
使用されている一部の機能には、需要指数、マネーフロー、RSI、スティリング、パターン認識、出来高分析、標準偏差の極値などがあり、異なる長さでこれらのバリエーションが多く含まれています。
初めて見ると、訓練されていない目には、他の

Master Bollinger Bands is designed with a bollinger bands indicator for entry points.
Please give me 5 stars reviews, than I will be maintain & update this free EA for longtime or all of time. I am promise.
Recommendations:
Currency pair: ALL PAIR CURRENCIES Timeframe: M5 Minimum deposit currencies : $250 ($500 recommended) Minimum deposit gold/xauusd : $1000 ($2000 recommended) Account type: Raw or zero spread accounts IMPORTANT: It is very important to use LOW SPREAD accounts for best
FREE

O LAVOAZZIE ROBOTRADER é um robô de negociação automatizada que opera em diversos tipos de mercados e ativos, incluindo Forex e a Bolsa Brasileira B3. Ele negocia ativos como miniíndice WIN, minidólar WDO e outros, sem martingale ou scalping. A estratégia de negociação do Lavoazzie é baseada na análise dos candlesticks, usando uma configuração do indicador William's Alligator (médias móveis, moving averages, melhor que Renko) e um algoritmo próprio de detecção de pontos de entrada, com filtro V

For the next 72 hours when you buy ECHO FX You will also get Knox Fx or world's FX absolutely free!!! get it while the deal lasts!!! Echo FX Expert Advisor for GBPUSD H1 Chart Only 10 copies left at $100 before the price doubles!!! Introducing Echo FX, an advanced Expert Advisor (EA) with a laser focus on the GBPUSD H1 chart, designed to dominate with a trifecta of trading strategies: trend-following, scalping, and hedging. This formidable EA is your trading partner, fine-tuned to the past year'

The "Moving Average Range Painter" is a robust MetaTrader 5 (MT5) indicator meticulously crafted to illustrate the fluctuating range between an exponential moving average (EMA) and a simple moving average (SMA) on any financial chart. This tool offers traders a comprehensive visual depiction of the price range within which an asset is oscillating. Here's a succinct interpretation of what this range signifies for technical analysis: Trend Dynamics : The range delineated by the EMA and SMA unveils
FREE
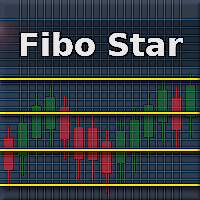
The price in the market always moves between the resistance and support levels. These levels create a channel in which the price moves, sometimes breaking through its boundaries and forming a new channel. The ZigZag indicator is used to search for a channel. The channel boundaries are indicated as 0% and 100% Within the channel, the Expert sets the working levels ( FIBO LEVELS SET group of settings) at which limit orders are set. You can set your own trading volume for each order ( LOT FOR LEVEL
FREE

Introduction
The SuperBands Indicator is a sophisticated technical analysis tool designed to provide traders with a clear visual representation of price movements within well-defined bands. This indicator is specifically engineered to filter out minor price fluctuations and market noise, offering traders a more accurate and reliable view of price trends and potential reversal points.
Signal
Buy when price breaks below the "Extremely oversold" band (darker red color) and then clos
FREE

MT4 Version Wave Trend MT5 Wave Trend is an oscillator, which helps identifing in a extremely accurate manner market reversals. The Oscillator being obove the overbought level and a cross down of the fast into the slow MA usually indicates a good SELL signal. If the oscillators is below the oversold level and the fast MA crosses over the slower MA usually highlights a good BUY signal. The Wave Trend indicator can be also used when divergences appear against the price, indicating the current move

“Smart Golden”は、スキャルピング戦略を使用して特に金市場向けに設計された商品です。そして、マーチンゲール、グリッド、ヘッジなどの管理手法は使用しません。 私たちはAIツール(機械学習)を使用して、金の過去のデータから堅牢な特徴を抽出し、“Smart Golden” に直接エンコードしています。 特定の過去のデータ(フィッティング)またはChatGPT予測に継続的にトレーニングしないため、過学習の可能性を最小限に抑えることができます。 最新のお知らせ: - 特徴: スキャルピング戦略 マーチンゲール、グリッド、ヘッジなどの管理手法は使用していません。 バックテストMDD < 5% すべての取引には予期せぬ損失を防ぐためのストップロスがあります。 取引の推奨事項: 取引:XAUUSD タイムフレーム:M1 最低入金額:$200 口座タイプ:ECN/Raw/Razor レバレッジ:1:30+ 設定: スタートロット: 0.01 リスク管理者: true GMTオフセット:ブローカーによって異なります 使用_DST: true

親愛なる友人、ご清聴ありがとうございました。 異なる通貨ペアの動きが相互に関連していることを観察したい場合は、インジケーター Visual Correlation に注目してください。 異なる通貨ペアの動きは相互に関連しています。 Visual Correlation インジケーターを使用すると、スケールを維持しながら 1 つのチャート上にさまざまな金融商品を表示できます。 正の相関、負の相関、または相関なしを定義できます。
親愛なる友人、あなたは、いくつかの楽器が他の楽器よりも先に動くことをご存知でしょう。 このような瞬間は、グラフを重ね合わせることで判断できます。
親愛なる友人へ、チャート上に商品を表示するには、Symbol フィールドに商品名を入力する必要があります。
Version for MT4 https://www.mql5.com/ja/market/product/33063
FREE

All traders should know the trend before making their decision when placing the buy or sell orders. The first step always starts with supply and demand , rising and falling channels , trend lines, engulfing candles etc. All the above contribute to what is called “Price Action” and that is the best and most reliable way in trading and catching the trend and making profits, without stress. The Investment Castle Trend Line Indicator will automatically draw the trend lines on the MT5 for you.
FREE

このインディケータは、価格アクション分析とドンチャンチャネルのみを使用して、ジグザグ方式で価格の反転を検出します。再描画やバックペインティングを一切行わずに、短期取引向けに特別に設計されています。それは彼らの操作のタイミングを増やすことを目指している賢明なトレーダーにとって素晴らしいツールです。 [ インストールガイド | 更新ガイド | トラブルシューティング | よくある質問 | すべての製品 ]
驚くほど簡単に取引できます すべての時間枠で価値を提供します 自己分析統計を実装します
電子メール/音声/視覚アラートを実装します 可変長のブレイクアウトと混雑ゾーンに基づいて、インディケータは価格アクションのみを使用して取引を選択し、市場が非常に高速に行っていることに反応します。 過去のシグナルの潜在的な利益が表示されます この指標は、独自の品質とパフォーマンスを分析します 負けブレイクアウトは強調表示され、説明されます インジケータは、非バックペインティングおよび非再ペイントです この指標は、日中のトレーダーが単一の価格反転を見逃さないようにするのに役立ちます。ただし、す

For those who love to trade using the Heikin Ashi Candlesticks, here it is a powerful ally: Heikin Ashi Delta . This indicator was presented by Dan Valcu in his book about Heikin Ashi candlesticks called " Heikin Ashi - How To Trade Without Candlestick Patterns " - and by the way this is a very cool book, we totally recommend it. Even for those of you who don't trade using Heikin Ashi candlesticks could use this Leading Indicator anyway. It is more "nervous" than let's say a Stochastic, but coul
FREE

We often need to know the sudden change in trend that happens on the graph and this can be confirmed through indicators.
This indicator shows the moments of trend reversal and how in which trend the price is shifting.
Custom background, no need to configure the colors in the chart, just drag the indicator!
Indication with arrows.
- Blue arrow: Upward trend.
- Pink Arrow: Downward Trend.
NOTE: Free indicator, support may take a while to respond.
FREE

Breakout based strategy, generates market entry signals when the price crosses a border of a certain price range. To create the strategy, we have used the history data with 99,9% quality for the last 15 years. The best signals had been selected and the false signals have been filtered out. The Expert Advisor performs technical analysis and considers only the breakouts that show the best result.
It uses a system of filtering false signals. The EA uses adaptive trailing stop. The EA uses a v

The Period separators indicator separates time periods, specified by user.
It supports all timeframes, greater or aliquot to current timeframe. In case of the incorect timeframe, the indicator modifies it to closest correct value. Additional bonus - the separation of non-standard time periods - MOON, MOON/2, MOON/4 (moon phases). The separators are plotted using the indicator's buffers. The indicator uses one graphic object for information about the progress and current bar properties. The grap
FREE

The simple strategy used to get funding "Fundednext" My EA for My Project.. 2 signal entry methods for Breakout or Reversal PDH-PDL... New Version 1.2 update entry Lots Base on % of Account We recommend doing a backtest first on your demo account before using it on a real account...
By default, the settings we use for teams apply to the GOLD,GU,EU,Nas100US pairs...
For BreakOut OpenPosition = true For Reversal OpenPosition = false Include Reset All Variable For New Day Youtube Tutorial Her

This Supertrend strategy will allow you to enter a long or short from a supertrend trend change. Both ATR period and ATR multiplier are adjustable. If you check off "Change ATR Calculation Method" it will base the calculation off the S MA and give you slightly different results, which may work better depending on the asset. Be sure to enter slippage and commission into the properties to give you realistic results. If you want automatic trade with Supertrend indicator, please buy following pr
FREE

革新的なメタトレーダーテーマビルダーで取引チャートに命を吹き込みましょう!
テーマビルダーを使えば、あなたのスタイルや好みに合った取引環境を作ることができます。使いやすいインターフェースとメタトレーダーとの完全な統合により、チャートのルック&フィールを完全にコントロールすることができます / MT4無料版
特徴 完全カスタマイズ: ローソク足の色やチャートの背景を簡単に変更し、独自の取引スタイルを反映させることができます。ソフトでプロフェッショナルな色調から、鮮やかで大胆な色まで、可能性は無限です。 無限の創造性: 様々な色の組み合わせやスタイルを試して、あなたの個性や好みに合った完璧な外観を見つけましょう! 使いやすさ: 当社のツールは、初心者トレーダーでも直感的に使いやすいように設計されています。数回クリックするだけで、チャートを完全にカスタマイズし、全く新しいルック&フィールを与えることができます。 取引体験の向上: 視覚的に魅力的な取引環境は、見て楽しいだけでなく、金融市場の取引中の集中力を高めます。
使用方法 以下のビデオをご覧ください
FREE

Based on the most famous QFL strategy, this bot combines new entry techniques and many characteristics of the famous QFL strategy.
Recommend to backtest everything before you go live.
Original setup is for BTCUSD M15 and you need 10k usd on real account or 100 usd in CENT account in ROBOFOREX.
Please preserve Quantity 1 , 2 ,3 and 4 relation with EarnTarget. Multiply or divide this values all with the same factor to adjust it to your capital. Multiply all by 2, 4 or else. This strategy buys t
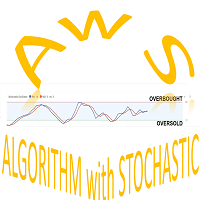
AwS Algorithm whit Stocastic: It is a algorithm system that uses the stocastic signal as a reference to enter the market.
The system detects the important points and operates the trend o the pulback, you chosse the direction
You can download the demo and test it yourself.
Very stable growth curve as result of smart averaging techniques.
"Safety first" approach in development. Stress-tests on historical data for

Indicator IRush uses a modified version of a popular indicator RSI (Relative Strength Index) to look for entries on a daily chart or lower. The indicator has been set up and tested with the major symbols: AUDUSD, EURUSD, GBPUSD, USDCAD, USDCHF, and USDJPY. An automated trading with this indicator is implemented in the expert advisor Intraday Rush . This expert advisor can open, trail and close its trades. Check it out, it may be exactly what you are looking for!
A Correct Reading of IRush
Th
FREE

Hello
This EA for send Orders Signals when you open or close order and send statics to your channel in Telegram with sum of profit or Loss Pips you can share your orders with your clients in your telegram please watch our video to see how it is fast. https://www.youtube.com/watch?v=u_7twtYZhyI
you must have Telegram channel then make bot and give it Permission and get token (watch this video to know how do it) https://www.youtube.com/watch?v=x1bKWFOjSBE
and you must download this files h

Introducing UJ Master EA, a simple yet powerful Expert Advisor for trading the USDJPY pair! Developed, tested and traded by a team of experienced traders with trading experience of over two decades. Prop-Firms Ready Easy To Set up Not sensitive to broker conditions UJ Master EA is updated every 3 months to get the best results!
UJ Master EA utilizes a complex price action strategy and smart money concepts, following strict mechanical rules. For the best possible results, follow these st

Seconds Chart For MetaTrader 5 The Indicators allows you to create charts in the MetaTrader 5 terminal with a timeframe in seconds. The timeframe on such a chart is set in seconds, not in minutes or hours. Thus, you can create charts with a timeframe less than M1. For example, S15 is a timeframe with a period of 15 seconds. You can apply indicators, Expert Advisors and scripts to the resulting chart. You get a fully functional chart on which you can work just as well as on a regular chart. The t

What is crypto trading? A cryptocurrency is a digital (virtual) financial currency, where security of making transactions is provided by using cryptography methods. The concept of the very first digital currency, Bitcoin, was introduced by Satoshi Nakamoto in 2008. Since the moment cryptocurrencies appeared, they have been growing in popularity quickly and at present may be considered as some of the most highly-demanded trading instruments. There are more than 1,500 cryptocurrencies in the worl

The XR Gartley Pattern MT5 is an indicator which displays and alerts Gartley pattern detected on the candlestick chart. It also displays potential trade with calculated Take Profit and Stop Loss. After purchasing XR Gartley Pattern Indicator, you can immediately download this indicator from the MT4-MT5 Market and start using it because all features are set to default, is not necessary to change any parameter. In addition, we have created a private group for customers who have purchased one of
FREE

この製品は、ブローカーサーバーのタイムゾーンに基づいて15か国の取引セッションを表示するように設計されており、希望の設定に基づいたさまざまな表示モードにより、チャートの混雑を防ぎ、ユーザーの希望の時間でセッションを設定することが可能です。
外国為替市場に太陽が沈むことはありませんが、そのリズムは独特の取引セッションのビートに合わせて踊ります。これらのセッション、それらの重複、およびその独特の雰囲気を理解することは、市場に逆らうのではなく、市場とともに動きたい外国為替トレーダーにとって非常に重要です。
Tokyo China London Canada New York Moscow Saudi Arabia ... USDJPY *** *
***
AUDJPY ***
NZDUSD *
***
EURAUD
**
GBPUSD
***
***
EURCHF
***
USDCHF
FREE

Tokyo Expert Advisor trades several symbols simultaneously in automatic mode: AUDUSD, EURUSD, GBPUSD, USDCAD, USDCHF, and USDJPY. Trading decisions are made by a recurrent neural network. I use price changes and indicator values as inputs. I developed a special algorithm of price normalization for Tokyo EA. I named it "sliding". Price comparison is not always reliable for different periods. However, a good history analysis should help make more accurate decisions in the current market situation.

この指標は、YouTube チャンネル「The Secret Mindset」のビデオ「A Reliable Scalping Strategy I Discovered After 1 Month of Price Action Trading」で提案された戦略に基づいています。 信号をフィルタリングするための戦略と条件の完全かつ詳細な説明は、ビデオで公開されています。 * YouTube チャンネルの作成者はこのインジケーターの開発とは関係ありません シグナルは他のインジケーターと組み合わせて、各トレーダーの判断によってフィルタリングする必要があります
インジケーター
前のバーの高値/安値範囲内にあるバーは、インサイドバーと呼ばれます。 インジケーターはオプションでこれらのバーをペイントできます 2 つの連続するインサイドバーはチャネルを作成し、多くの場合サポートレベルまたはレジスタンスレベルとしても機能します
信号
インジケーターは、2 つの異なるモードで信号矢印を表示できます。 FAST: バーが閉じるまでシグナルが再描画されるため、トレーダーはシグナル バーがすで
FREE

SI Connectは、FX VolumeやSIEAの取引システムを利用するために、当社のサーバーへの接続を確立するユーティリティです。
SI Connectを使用するために端末を準備する技術的な手順 Web リクエストを許可し、[ Terminal Options ] -> [Subcategory Expert Advisors ] で許可された URL のリストに https://stein.investments を挿入してください。 ターミナルごとに1つのEAインスタンスを実行する必要がありますが、当社のデータセンターから最新のデータを取得するため、バックグラウンドで常に実行する必要があります。
ご質問がある場合は、プライベートメッセージを送信してください。
FREE

Automatic Trend Line Fit. This indicator automatically plots the straight line and parabolic (curved) trend to any symbol at any timeframe. The plotted straight line is a good indication of the current trend and the curved line is an indication of a change momentum or change in the current trend. Plotting the straight line over about 2/3 the number of candles as the curved line is usually a good way to determine entry and exit points as it shows the current trend and momentum of the market. This
FREE

ケルトナー・エンハンスドは、ケルトナー・チャネルの精度と見やす さを向上させるもので、METAデフォルトを超える多くの調整オプショ ンと5つの価格計算を備えています。
ケルトナーEインディケータは、ボリンジャーバンドや移動平均エンベロープ に類似したバンド型インディケータです。ケルトナーEは、ボリンジャーバンドや移動平均線に似た帯状のインジケータで す。
ケルトナー・チャネルを使用する際に注意すべき主な現象は、上限エンベロープの上方または下限エンベロープの下方へのブレイクアウトです。上側のエンベロープを上抜けた場合は、買われ過ぎを意味します。下限エンベロープを下抜けた場合は、売られ過ぎを意味する。
ただし、ケルトナー・チャネルを使用する際には、買われすぎや売られすぎの状態はしばしば強さの兆候であることに留意してください。
トレンドが明確に定義されている場合、買われ過ぎや売られ過ぎは強さを示すことがあります。この場合、現在のトレンドは強まり、最終的に継続する。横ばい相場では、少し違った動きをする。相場が横ばいトレンドにある場合、買われすぎや売られすぎの読みは、多くの場合
FREE

マトリックスアローEAMT4 は、 マトリックスアローインジケーターのMT5 シグナルをチャート上のトレードパネルと手動または100%自動でトレードできるユニークなエキスパートアドバイザーです。 マトリックスアローインジケーターMT5 は、初期段階で現在のトレンドを判断し、最大10の標準インジケーターから情報とデータを収集します。 平均方向移動指数(ADX) 商品チャネルインデックス(CCI) クラシック平研アシキャンドル 移動平均 移動平均収束発散(MACD) 相対活力指数(RVI) 相対力指数(RSI) 放物線SAR ストキャスティクス ウィリアムズのパーセント範囲 すべてのインジケーターが有効な買いまたは売りシグナルを与えると、対応する矢印がチャートに印刷され、次のろうそく/バーの開始時に強い上昇トレンド/下降トレンドを示します。ユーザーは、使用するインジケーターを選択し、各インジケーターのパラメーターを個別に調整できます。 Matrix Arrow EA MT5 を使用すると、チャートのトレードパネルから直接、または100%アルゴリズム取引オプションを使用して100%自動

The big figure is a crucial aspect of forex trading, serving as a reference point for trade execution, risk management, and technical analysis. By understanding the importance of the big figure and incorporating it into their trading strategies, forex traders can improve their decision-making process and increase the likelihood of successful trades. Why is the Big Figure Important? The big figure is important for several reasons: Simplification: Traders often refer to the big figure when discu
FREE

The Expert Advisor for this Indicator can be found here: https://www.mql5.com/en/market/product/115564 The Contraction/Expansion Breakout Indicator for MetaTrader 5 (MT5) is a powerful tool designed to identify and signal the breakout of bullish and bearish contraction or expansion formations in financial markets. Utilizing advanced algorithmic calculations, this indicator helps traders spot significant price movements that often accompany these formations, providing valuable insights for stra
FREE

The MACD 2 Line Indicator is a powerful, upgraded version of the classic Moving Average Convergence Divergence (MACD) indicator.
This tool is the embodiment of versatility and functionality, capable of delivering comprehensive market insights to both beginner and advanced traders. The MACD 2 Line Indicator for MQL4 offers a dynamic perspective of market momentum and direction, through clear, visually compelling charts and real-time analysis.
Metatrader4 Version | How-to Install Product | How
FREE

This indicator allows you to measure retracements of price between any two points in either direction. It displays the price points, percentages and also displays the extension levels.
User may Modify and Add addition levels and extensions." User may also Add multiple Fibonacci indicators on the chart and change their colors, style and sizes.
Can be used on any timeframe.
This is the only Fibonacci Tool you'll need to measure and trade on Structure.
MT4 Version Available as well.
ADDI
FREE
これは、外国為替ペア、株価指数、個別株、債券、およびいくつかの商品を含むほとんどの市場で取引できる、高い勝率の平均回帰戦略です。 このエキスパートアドバイザーは、堅牢で機能することが実証された取引原則と統計ルールに基づいて構築されており、BS はありません。 ターゲット市場に合わせて Expert Advisor をバックテストして最適化します。 相関関係のない複数の市場で EA を実行し、より優れた分散ポートフォリオと信頼性の高いパフォーマンスとリターンを実現します。 取引市場の最適化とバックテストの結果に基づいて、最も可能性の高い結果の予測シミュレーション テストを実行します。 希望するドローダウンとパフォーマンスに合わせて取引ごとのリスクを設定し、それに応じてライブ戦略で取引ロットサイズを設定します。 あなたがリスクを調整するためにこの部分に注意を払い、相関関係のない商品の小さなバスケットで戦略を取引する場合、統計的な可能性をすべて自分に有利に置くことになります。 製品が気に入ったら、レビューを書いてください。
これは経済的なアドバイスではなく、教育と娯楽のみを目的としてい
FREE

This version is a basic iteration, click the link below to access the full version: https://www.mql5.com/en/market/product/110060 "ICT, short for Inner Cycle Trade, revolutionizes your Forex trading experience by focusing on the intricacies of inner market dynamics. Built upon the principle of understanding and capitalizing on short-term market fluctuations, ICT utilizes advanced AI algorithms to provide traders with real-time insights into emerging opportunities within the Forex market. By com
FREE

This indicator show Gann Swing Chart (One Bar) with multi layer wave. 1. Wave layer F1: Gann waves are drawn based on candles. SGann wave(Swing of Gann) is drawn based on Gann wave of wave layer F1. 2. Wave layer F2: Is a Gann wave drawn based on the SGann wave of wave layer F1. SGann waves are drawn based on Gann waves of wave layer F2. 3. Wave layer F3: Is a Gann wave drawn based on the SGann wave of wave layer F2. SGann waves are drawn based on Gann waves of wave layer F3. ---------Vi
FREE
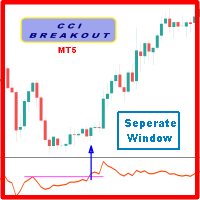
Probability emerges to record higher prices when oscillator breaks out oscillator historical resistance level when exhibit overbought values. Since, oscillator breakout of support and resistance have similar effect as price breaks support and resistance levels, therefore, its highly advised to confirm price breakout with oscillator breakout; certainly, will have the same output in short trades. Concept is based on find swing levels which based on number of bars by each side of peak or trough - a
FREE
*** ATR --------------------------------- RSI ***
MQLuxe B1 is a special MT5 Robot that is a fully automated trading system that doesn't require any special skills from you. Just fire up this EA and rest. You don't need to set up anything, EA will do everything for you. EA is adapted to work on small deposits. Combining the Average True Range (ATR) indicator with the Relative Strength Index (RSI) can create a robust trading strategy in the Forex market. This combination can help you
FREE
MetaTraderマーケットはトレーダーのための自動売買ロボットやテクニカル指標を備えており、 ターミナルから直接利用することができます。
MQL5.community支払いシステムはMetaTraderサービス上のトランザクションのためにMQL5.comサイトに登録したすべてのユーザーに利用可能です。WebMoney、PayPal または銀行カードを使っての入金や出金が可能です。
取引の機会を逃しています。
- 無料取引アプリ
- 8千を超えるシグナルをコピー
- 金融ニュースで金融マーケットを探索
新規登録
ログイン