YouTubeにあるマーケットチュートリアルビデオをご覧ください
ロボットや指標を購入する
仮想ホスティングで
EAを実行
EAを実行
ロボットや指標を購入前にテストする
マーケットで収入を得る
販売のためにプロダクトをプレゼンテーションする方法
MetaTrader 5のための新しいエキスパートアドバイザーとインディケータ - 83

The indicator calculates the correlation coefficient of 2 instruments, shifts the chart of the 2nd instrument relative to the 1st and displays the charts of both instruments on the current chart. The maximum positive and negative deltas and the current delta as a percentage of the maximum are calculated. It is possible for signals to set a delta for entry and exit with displaying the direction of entry into trade for each instrument. The space between the charts is also filled with different col

SupportResistancePeaks Indicator indicator - is the combination of dynamic support/resitance and price action pattern. As a rule support/resistance indicators uses already calculated, history levels. The most disadvantage of this method - new(incomming) levels always are not the same as were on history, in other words accuracy is not so high as expected. My indicator is looking for dynamic/live levels that are forming right now after trend lost it's power and choppy market starts. As a rule exac

Close All and Change Take Profit and Stop Loss All Orders. Main Features
Ability to Close All Orders the Symbol you put this EA. Ability to Change Take Profit to All Order. Ability to Change Stop Loss to All Order. Show Order count. Show Average price with info and Horizontal Line. Show lot open.
Show Price diff from average to price now Show broken price with info and Horizontal Line. Easy to use . How to use
Close All (Symbol) PC : you can click on Clos

The fractal indicator shows the latest support and resistance levels. If the price breaks through the level and is fixed, the indicator draws a rhombus of yellow or crimson color signaling a possible continuation of the movement towards the breakdown.
Indicator Settings:
- BarCount: sets the minimum number of bars required to build a fractal.
It is better to use the indicator in conjunction with other indicators.
FREE

PRESENTATION
This EA uses several non-directional strategies that allows it to generate profits regardless of price trends. It manages a pool of positions ("session") in a totally autonomous way To avoid risks related to this strategy, several recovery functions have been implemented. This makes it a reliable and secure EA, its DD remains low.
RECOVERY MODE This EA is designed to run on several pairs simultaneously on an account. When the DD of a session exceeds a defined value, all positions

Awesome Oscillator by Bill Williams with the ability to fine-tune and replace the averaging algorithms of the indicator, which significantly expands the possibilities of using this oscillator in algorithmic trading and brings it closer in its properties to such an indicator as the MACD. To reduce price noise, the final indicator is processed with an additional Smooth averaging. The indicator has the ability to give alerts, send mail messages and push signals when the direction of movement of th

Accelerator Oscillator by Bill Williams with the ability to fine-tune and replace the averaging algorithms of the indicator, which significantly expands the possibilities of using this oscillator in algorithmic trading and brings it closer in its properties to such an indicator as MACD.
To reduce price noise, the final indicator is processed with an additional Smooth averaging. The indicator has the ability to give alerts, send mail messages and push signals when the direction of movement
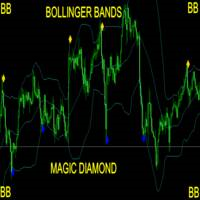
Take Your Trading Experience To the Next Level ! and get the Magic Bollinger Bands Diamond Indicator MagicBB Diamond Indicator is MT5 Indicator which can suggest signals for you while on MT5. The indicator is created with Non Lag Bollinger Bands strategy for the best entries. This is a system to target 10 to 20 pips per trade. The indicator will give alerts on the pair where signal was originated including timeframe. If signal sent, you then enter your trade and set the recommended pips targ
Bi Stable Trading - a stable bot for the whole history with one setting! Works on the basis of the Trading Direction indicator. Since the Trading Direction indicator generates stable signals for trading without redrawing exactly at the opening prices, the EA works as stably and reliably as possible. Everything that you read in the description of the indicator is also suitable for an expert. The expert goes through the whole story! The EA is designed for stable long-term trading, although it can

Multi Stable Trading is a unique trading system based on a stable indicator without Trading Direction repaints. The uniqueness lies in the high stability of the system and work with a large portfolio of tools. A portfolio can be formed as you like, new instruments can be added, additionally, you can use the basic indicator optimization utility for the desired instrument for free. The bot goes through the entire history in multi-currency mode. Naturally, all instruments have their own settings.

Trend driver bars is the manual trading system, which defines current trend continue or it's pull-back/reverse. "Driver" bars - are price action patterns that has powerfull affect on market, defining it's near future direction. Generally, driver bars represents trend "skeleton" and often anticipates new market impulse. System plots arrows when market shows 3 pattenrs in a row(most powerfull combo-pattern), and makes fast scalping of incomming movement. Loss positions closes by common profit. Lot

The indicator calculates intraday levels based on the average daily price range, builds support and resistance levels that may be reversal.
Parameters Period ATR - period of the ATR indicator Shift time - time offset for the opening of the day Color opening of day - color of the opening line of the day Color 1AR, -1AS - line color 1AR, -1AS Color AR 1/2, AS -1/2 - line color AR 1/2, AS Color AR 1/4, AS -1/4 - line color AR 1/4, AS -1/4 Color AR 3/4, AS -3/4 - line color AR 3/4, AS -3/4 Colo

** All Symbols x All Time frames scan just by pressing scanner button ** *** Contact me after the purchase to send you instructions and add you in "Harmonic Scanner group" for sharing or seeing experiences with other users. Introduction Harmonic Patterns are best used to predict turning point. Harmonic Patterns give you high win rate and high opportunities for trade in during one day. This indicator detects the best and successful patterns based on Harmonic Trading concepts . The Harmonic Patt
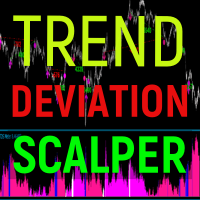
Trend deviation scalper - is the manual system to scalp choppy market places. Indicator defines bull/bear trend and it's force. Inside exact trend system also defines "weak" places, when trend is ready to reverse. So as a rule, system plots a sell arrow when bull trend becomes weak and possibly reverses to bear trend. For buy arrow is opposite : arrow is plotted on bear weak trend. Such arrangement allows you to get a favorable price and stand up market noise. Loss arrows are closing by common p
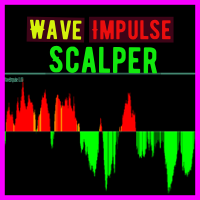
Wave Impulse OmegaScalper - is the manual system for scalping. In many cases Indicator "eats" almost all possible trend wave. System defines up price wave and down price wave. Inside the exact wave - system defines true trend movement and choppy market. Indicator plots signals while market is trending, powerfull and has quiet good volatility. This is complete system with enter and exit points. Main Indicator's Features Signals are not repaint,non-late or disappear(exept cases when system recalcu

Reverse side scalper is the manual trading system, that works on choppy(anti-trend) market. As a rule markets are on 80% choppy and only 20% is trend phase. System is based on custom step Moving and RSI and reverse pattern. System defines up movement, down movement, trend / choppy phases. Indicator plots Buy signal arrow when current direction is down and phase is trend, Sell signal arrow is plotted when currently is up movement and phase is trend. As a rule it allows to "catch" local maximum/mi

Welcome to Investment Castle products This product is exclusively available in the MQL5 market and is not available and will not be available anywehere else. The Combined indicator is a multi-time frame indicator and it is built using 3 indicators: Bands indicator which draws the support and resistance key levels using up to 5 different time frames Patterns indicator which draws the chart patterns using up to 6 different time frames Spots indicator which shows the common candlestick patterns Yo
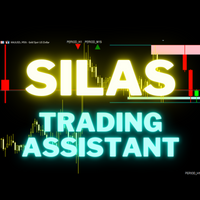
Silas is a trading assistant for multi-timeframes traders. It show on the screen, in a very clear way, all the informations needed to suits to your trading. It show : - Supply and demand zone from 2 timeframes of your choice - Setups based of market structure from 2 timeframes of your choice - Daily current high and low points - The last 2 closed candles and the current candle from an higher time frame on the right of the graph. - Actual daily candle on the left Everything is customisable !

В основу алгоритма этого осциллятора положен анализ веера сигнальных линий технического индикатора RSI . Алгоритм вычисления сигнальных линий выглядит следующим образом. В качестве исходных данных имеем входные параметры индикатора: StartLength - минимальное стартовое значение первой сигнальной линии; Step - шаг изменения периода; StepsTotal - количество изменений периода. Любое значение периода из множества сигнальных линий вычисляется по формуле арифметической прогрессии: SignalPeriod(Number)

Inventory Retracement Trade it is designed based on one of the most popular tradingview indicator. This is mostly combined with other popurlar trend indicator to confirm the strength of the movement. Definition Inventory Retracement Trade is quickly becoming one of the most popular ways to identify where short-term counter trend institutional inventory has subsided and when it’s time to re-enter into a trade’s original trend direction.

OPTIMIZE EA BEFORE BACKTEST AND USE In times of high inflation, hedging with gold is valid. Trade this EA on the XAU/USD 5 minute chart. It is important to optimize sl a tp before use if out of date. This was built on this years data 2022. Also continual optimization of tp and sl is required for any EA. The strategy uses Williams Percent Range and ADX for entries and Standard Deviation and Moving Averages for exits. The lots are fixed and every trade has a stop loss and a take profit.
I really like this indicator. But I made it, so of course I would.. NOW FREE. But please consider supporting me by buying my 2 for sale indicators. You can multiply the weight of each indicator used to give more emphasis on it's value when averaging between the 3. Boost fast TEMA and it can move the indicator faster. Boost slow FrAMA and watch it smooth out. I like to use them as open/close lines and set them up so they move quick, but have the FrAMA smooth it out more.
Check out my other ind
Originally made for MT4 now for MT5. It is important to optimize the inputs before use in back test and real trading.
Gold Machine trades XAU/USD. Depending on the time frame used, adjust the inputs accordingly. Try it out on the demo and report back with stars and reviews. This uses break evens and trailing stops. 1 hour is recommended for larger tp and smaller time frames would be less but experiment freely but use a demo first.
Inputs: Move SL to BE Profit Target Trailing Stop Risk

How it works? This EA trades with Stochastic Signal line Cross over low and high levels. Only allows one open trade at a time on the currency you have attached this EA. if Reverse Logic is FALSE will open BUY if Stocha Signal Line Cross below Low Level will open SELL if Stocha Signal Line Cross Above High Level if Reverse Logic is TRUE will open SELL if Stocha Signal Line Cross below Low Level will open BUY if Stocha Signal Line Cross Above High Level Key difference with my other EA " Maste

Индикатор iVeles_Perfect_Oscilator является опережающим и одним из самых лучших осциляторов на сегодняшний день, использует специализированный расчет текущих цен графика. Очень качественно и своевременно показывает смену направления, очень точный подход к уровням перекупленности и перепроданности, что позволяет своевременно принять решение по сделке. Работает качественно на любом ТФ и с любым инструментом. Параметры: Period - период расчетов Average - усреднение МА Method - применяемый мето

PK Crash 1000 EA is an EA designed specifically to trade Crash 1000 Index on the M2 Timeframe.
The minimum deposit is 100 USD per 0.2 Lot Size for a 1:500 leverage account. PK Crash 1000 EA shows stable trading results. PK Crash 1000 EA only trades one direction. It only sells thus profiting from the drops that occur in the Crash 1000 Index. This unique feature allows the EA to maximize your profits and minimize the drawdown. The trailing stop feature tracks 50% of the profit gained thus reduc

В основу алгоритма этого трендового индикатора положен анализ веера сигнальных линий универсального мувинга I . Алгоритм вычисления сигнальных линий выглядит следующим образом. В качестве исходных данных имеем входные параметры индикатора: StartLength - минимальное стартовое значение первой сигнальной линии; Step - шаг изменения периода; StepsTotal - количество изменений периода. Любое значение периода из множества сигнальных линий вычисляется по формуле арифметической прогрессии: SignalPeriod(

Top indicator for MT5 providing accurate signals to enter Trades.
This Indicator will provide pretty accurate trading signals and tell you when it's best to open a trade by giving alerts to buy or sell. Mainly was created to target Volatility Index on Deriv broker however, the Spot Detector Arrow Indicator can be applied to any financial assets(Forex, Crypto, Indices, Volatilities) on MT5 Brokers.
HOW TO BUY Wait for signal Alert to Buy will be sent to your MT5 Terminal Blue arrow facin

PK Crash 1000 PRO is an EA designed specifically to trade Crash 1000 Index on the M1 Timeframe. It doesn't trade frequently but it offers a high return of profits with lesser risk. The minimum deposit is 100 USD per 0.2 Lot Size for a 1:500 leverage account. PK Crash 1000 PRO shows stable trading results. PK Crash 1000 PRO only trades one direction. It only sells thus profiting from the drops that occur in the Crash 1000 Index. This unique feature allows the EA to maximize your profits and mini

PK Crash 500 EA is an EA designed specifically to trade Crash 500 Index on the M1 Timeframe.
The minimum deposit is 100 USD per 0.2 Lot Size for a 1:500 leverage account. PK Crash 500 EA shows stable trading results. PK Crash 500 EA only trades one direction. It only sells thus profiting from the drops that occur in the Crash 500 Index. This unique feature allows the EA to maximize your profits and minimize the drawdown. This EA only uses the stop loss feature. It automatically closes trades

PK Crash 500 PRO is an EA designed specifically to trade Crash 500 Index on the M5 Timeframe.
The minimum deposit is 100 USD per 0.2 Lot Size for a 1:500 leverage account. PK Crash 500 PRO shows stable trading results. PK Crash 500 PRO only trades one direction. It only sells thus profiting from the drops that occur in the Crash 500 Index. This unique feature allows the EA to maximize your profits and minimize the drawdown. The trailing stop feature tracks 50% of the profit gained thus reduci

PK Crash 300 EA is an EA designed specifically to trade Crash 300 Index on the M2 Timeframe. PK Crash 300 EA shows stable trading results. PK Crash 300 EA only trades one direction. It only sells thus profiting from the drops that occur in the Crash 300 Index. This unique feature allows the EA to maximize your profits and minimize the drawdown. The trailing stop feature tracks 50% of the profit gained thus reducing on the drawdown. PK Crash 300 EA is very simple to use. All you have to do is to

PK Boom 1000 EA is an EA designed specifically to trade Boom 1000 Index on the M1 Timeframe.
The minimum deposit is 100 USD per 0.2 Lot Size for a 1:500 leverage account. PK Boom 1000 EA shows stable trading results. PK Boom 1000 EA only trades one direction. It only buys thus profiting from the spikes that occur in the Boom 1000 Index. This unique feature allows the EA to maximize your profits and minimize the drawdown. This EA targets the spike trends that's why it has a huge take profit ta

PK Boom 500 EA is an EA designed specifically to trade Boom 500 Index on the M1 Timeframe.
The minimum deposit is 100 USD per 0.2 Lot Size for a 1:500 leverage account. PK Boom 500 EA shows stable trading results. PK Boom 500 EA only trades one direction. It only buys thus profiting from the spikes that occur in the Boom 500 Index. This unique feature allows the EA to maximize your profits and minimize the drawdown. This EA doesn't use trailing stop since it automatically detects a change in

Angle of Moving Averages This indicator is very simple yet powerful concept which constantly calculate the slope of the current bar moving average with respect to the N bar before moving average value. This no only give a good entry and exit signal but also it shows traders the strength of the signal. It shows positive green histogram when market is moving toward upward direction and red histograms for downtrend. When large histograms found means market has very strong trend. Inputs Available

This EA and setting are designed for you who want to pass FTMO Challenge or MFF challenge.
best designed for major pair like eurusd,usdjpy,audusd or usdcad. time frame m15-h1.
On the backtest I test with 10.000 balance with lot 0.04 and result as seen on attached screenshot. On The FTMO demo I test with 50.000 balance with starting 0.5 lot on USDCAD TFM15 and risk 4%. All you need is calculate the risk and reward and lotsize.
we not guarantee to be the same result on the future because o
This EA utility does not trade on its own, but it only modifies the open trades to add take profit and stop loss that was opened manually or by any other expert advisors.
The distance is based on Average True Range Indicator(ATR).
How Does It Work?
If Symbol to modify is set to "All Symbol" simply attach it to one chart, and all open trades in the entire terminal will set the take profit and stop loss with the distance of Average True Range value of their corresponding symbol.
If
Just learning how to create an indicator from this tutorial .
its just a garbage text to fill the descriptions. Hello there. Hello there Hello there Hello there Hello there Hello there Hello there Hello there Hello there Hello there Hello there Hello there Hello there Hello there Hello there Hello there Hello there Hello there Hello there Hello there Hello there
FREE

The FX Stewards EA Signals Alert Financials Indicator works with every trading instrument(if used on synthetics, performance will not be optimum). Do not use on synthetics. Synthetics are not affected by fundamental analysis. The signals indicator assists with choosing which instrument to trade and the direction to take(follow the trend - the trend is your friend), making it easer for you to enter, re-enter or exit a trade with confidence(you're, however, still required to confirm entry before e

Wink IND is an indicator that tell you: -when MACD is saying buy or sell -when RSI is saying buy or sell -work on multi timeframes MT4 Version
by Wink IND: you don't need to have Knowledge about MACD or RSI don't need to check and compare MACD and RSI respectly don't need to check all of timeframes and compare the resaults don't lose time, save more time for your decisions in trading
Wink IND: multi timeframe indicator multi currency indicator show the positions by graphic shapes, arrows an
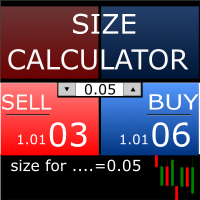
Size Calculator allow you to calculate the size you need for your position giving two parametres: the number of pips risked and the money risked, for example if you want to risk 20 USD on 200 pips, then you will need to input 200 in the case reserved for pips and 20 in the case reserved for risk, the size will appear in left top carner of the chart in your metatrader 4 platform, Size Calculator support the following symbols : EURUSD GBPUSD AUDUSD NZDUSD GOLD WTI EURJPY GBPJPY USDJPY AUDJP

The indicator very accurately determines the levels of the possible end of the trend and profit fixing. The method of determining levels is based on the ideas of W.D.Gann, using an algorithm developed by his follower Kirill Borovsky. Extremely high reliability of reaching levels (according to K. Borovsky - 80-90%) Indispensable for any trading strategy – every trader needs to determine the exit point from the market! Precisely determines targets on any timeframes and any instruments (forex, met

UR モメンター
UR Moenter は、オシレータとして表される価格変動の枯渇に相関する価格のモメンタムを完全に計算します。 したがって、これは潜在的な反転またはリトレースメントの本当に初期のシグナルを提供します. この公式は、2018 年に市場バブルが崩壊した後に発見されました。
UR Moenter を使用する利点:
パラメータなし 価格の動きを表す 2 本の線があります。白線は、オシレーター (青い線) として表される価格の移動平均偏差と相関する価格のモメンタムです。 ヒストグラムは、価格の勢いに応じた最大偏差を視覚化したものです インターフェースは、両極端 (上部の赤と下部の緑の領域) のいずれかの線の枯渇を示しています。 最大の利点: 簡単で、すべてのアセットに合わせて調整できます。 ツールの最新情報を入手できる特別な電報チャットがあり、何か不足していると感じた場合はリクエストを送信することもできます!
UR モメンターを選ぶ理由
このインジケーターは、スタンドアロンのエントリーまたはエグジット インジケーターとして使用できます。 価格に依存

数列の一つに「森林火災数列」があります。これは、最も美しい新しいシーケンスの 1 つとして認識されています。その主な特徴は、このシーケンスが線形トレンドを回避することです。最短のものであってもです。この指標の基礎を形成したのはこのプロパティです。 財務時系列を分析する場合、この指標は可能なすべての傾向オプションを拒否しようとします。そして失敗した場合にのみ、トレンドの存在を認識し、適切なシグナルを発します。このアプローチにより、新しいトレンドの始まりの瞬間を正しく判断できます。ただし、偽陽性の可能性もあります。それらの数を減らすために、このインジケーターに追加のフィルターが追加されました。新しいバーが開くとシグナルが生成されます。いずれの場合も再描画は発生しません。 指標パラメータ: Applied Price - 適用価格定数; Period Main - インディケータのメイン期間、その有効な値は 5 ~ 60 です。 Period Additional - 追加の期間。このパラメーターの有効な値は 5 ~ 40 です。 Signal Filter - 追加の信号

Archiは指標に基づいて構築されており、将来的にはその数が増加します。 "末尾位置"と"ステップ末尾"で"末尾停止"を使用することができます。 乗算と加算の両方によって、損失を生み出す現在の取引で、後続の取引の量を増やすことが可能です。 不採算取引よりも肯定的な取引の優位性に達した後、ボリュームは元の取引に戻ります。
"ボリュームワーク"–ボリューム増加モードを選択するために必要です。 この関数には、「音量の一定増加」と「音量の可変増加」の2つの値があります。
"体積の一定の増加"-現在の損失での体積の一定の増加。
"可変ボリュームの増加"-現在の損失での合計ボリュームの増加。
Archiには2つの操作モードがあります(傾向の方向を追跡)。:
指標に従ってください-取引は指標によってのみ開かれます。
混合モード-取引は指標に従って開かれ、損失の場合、取引は逆になります。
Archiの基本的な設定:
マジックナンバーは、すべての開いている取引の一意の番号です。 注意!!! EAは履歴で動作するため、以前の番号とは異なる一意の番号を使用する必要がありま

Indicadores Quânticos rápidos baseados no modelo SSC inovador e rastreamento em tempo real buscam os níveis de suporte e resistência. É uma iniciativa inovadora negociada em todos os tipos de mercados. Fast Quantum Indicators is a innovate initiate SSC model Real time tracking pursuit trend , based on innovate SSC model and Real time tracking pursuit the breakouts of support and resistance levels. It's a innovate initiate traded on all types of markets. Fast Quantum AI Expert Tradi

Indicadores Quânticos rápidos baseados no modelo SSC inovador e rastreamento em tempo real buscam os níveis de suporte e resistência. É uma iniciativa inovadora negociada em todos os tipos de mercados. Fast Quantum Indicators is a innovate initiate SSC model Real time tracking pursuit trend , based on innovate SSC model and Real time tracking pursuit the breakouts of support and resistance levels. It's a innovate initiate traded on all types of markets. Fast Quantum AI Expert Tradin

UR フロントエンドバックエンド
UR FrontEndBackEnd は、サポートとレジスタンスの最も正確なレベルを見つけるための私のお気に入りの公式です。 また、それらをさまざまなカテゴリ (破線、実線、および領域) に分割して、その強度を示しています。 すべてがバッファに格納されるため、簡単にアクセスして他のツール内で実装できます。
追加: ツールは、適用される資産に合わせて調整する必要がある場合があります。資産は、ツールに影響する価格の桁数に関して異なります。 そのために必要なパラメーターは、設定で提供されます。
UR FrontEndBackEnd を使用する利点:
計算の密度と距離を設定するための 2 つのパラメーターのみ サポートとレジスタンスはバッファ内に保存され、指定された資産の価格から上昇/下降します サポート/レジスタンスラインの強さをすばやく視覚的にフィードバックするための 3 種類のライン -> DASHED、SOLID、AREA ツールの最新情報を入手できる特別な電報チャットがあり、何か不足していると感じた場合はリクエストを送信

The Weis Wave Chart Forex for MT5 is a Price and Volume indicator. The Price and Volume reading was widely disseminated through Richard Demille Wyckoff based on the three laws created by him: Supply and Demand, Cause and Effect and Effort vs. Result. In 1900 R.Wyckoff already used the wave chart in his analyses. Many years later, around 1990, David Weis Automated R. Wyckoff's wave chart and today we bring you the evolution of David Weis' wave chart. It shows the amount of Volume and the amount o

The Weis Wave Chart for MT5 is a Price and Volume indicator. The Price and Volume reading was widely disseminated through Richard Demille Wyckoff based on the three laws created by him: Supply and Demand, Cause and Effect and Effort vs. Result. In 1900 R.Wyckoff already used the wave chart in his analyses. Many years later, around 1990, David Weis Automated R. Wyckoff's wave chart and today we bring you the evolution of David Weis' wave chart. It shows the amount of Volume and the amount of pips

YOU CAN NOW DOWNLOAD FREE VERSIONS OF OUR PAID INDICATORS . IT'S OUR WAY OF GIVING BACK TO THE COMMUNITY ! >>> GO HERE TO DOWNLOAD
More About Advanced Currency Meter Every good forex system has the following basic components: Ability to recognize the trend direction. Ability to identify the strength of the trend and answer the basic question Is the market trending or is it in a range? Ability to identify safe entry points that will give a perfect risk to reward (RR) ratio on every position
FREE

MartexPO MT5 is a moderately aggressive advisor working on a martingale strategy and with the ability to hedge unprofitable positions. Uses pending orders for opening the first order and for hedging. With an asymmetric "lock" - the MartexPO MT5 EA is able to independently exit the "lock" with a profit. The MartexPO MT5 EA can average orders manually opened by a trader and orders opened by another EA. The EA will be of interest to both beginners and experienced traders. A set files and a guide to

Drawdown Limit EA Prop Firm trading MT5
If you found this EA, it's probably because you want to get a funded account with a prop firm, but you see a rule that most of traders fear : Maximum Daily Drawdown. I've been through this problem myself as I'm a prop firm trader and I've made a bot to solve this rule, and you can get it to solve this problem too.
How does it work ?
When you first setup this EA, you need to input the initial deposit which corresponds to the size of your funded accoun

This tool is useful for indicating resistance and support levels It bases on zone in setting to identify top/bottom of candles and and draw rectangle according to those resistance/support level Beside user can edit the zone via dialog on specific timeframe and that value will be saved and loaded automatically. User can determine what strong resistance and support and make the order reasonably.
FREE
Simple RSI indicator.
User can choose TimeFrame for the RSI.
For example, you are using chart with M5 data
but want to see RSI from different fimeframe H4 drawn below the main chart window.
RSIhtf.ex5(iRSI.ex5 - another name) (h = higher, tf = timeframe) is designed specifically for this case.
Exports 1 buffer with indicator data.
The indicator is part of TS_DayTrader system.
FREE

Сonverter for historical data files(TICKS) from external sources
like ducascopy or others sources of non-standard .csv quotes.
The output format is compatible with MetaTrader5 and
can be imported to MetaTrader5.
The script can process multiple files(batch),
see parameter "Convert all files in folder Files/FrankEditor".
User can choose output timeframe, months and other options.
Input files should contain raw tick data and look like(UTC or EET time):
GBPUSD_Ticks_2014.01.01_202
FREE

Сonverter for historical data files(2 files, Ask and Bid) from external sources
like ducascopy or others sources of non-standard .csv quotes.
The output format is compatible with MetaTrader5 and
can be imported to MetaTrader5.
The script can process multiple files(batch),
see parameter "Convert all files in folder Files/FrankEditor".
User can choose output timeframe, specific months and other options.
2 input files should look like(UTC or EET time):
GBPUSD_1 Min_Ask_2017.01.01
FREE

iFrankenstein - an essential part of TS_DayTrader trading system( Frank.ex5 / Franken.ex5 / Frankenstein.ex5 ).
The indicator provides with 10 pattern-based signals.
For each of the 10 patterns there's a number of internal indicators and filters used:
Fractals
KeyLevels
RSI Divergences
BollingerBands
ATR
Technical Pocket
Pattern-specific volatility filters
The first 30 buffers of the indicator export a signal
that consists of TakeProfit, StopLoss, Price values, for each of the 1

Signal provider based on RSI Divergences
from a higher timeframe.
First 3 buffers export a signal.
Timeframe for which divergences are detected is optional, see
'RSI divergences timeframe' parameter.
The indicator uses different algorithms for divergences detection:
'Fast' algorithm is the simplest solution that works the fastest.
'Strict' algorithm filters out more noise but works slower than the previous one.
'Full' algorithm uses recursive functions and provides with lots of d

This product generates signals at closing bars thanks to channel scaling. It visualizes these signals with an arrow. The color of the arrow indicates the direction of the trade. The default settings are valid for the H1 period. You can backtest for each period and product. The code content of the indicator has been applied in accordance with price movements as much as possible. For this reason, it detects trend beginnings and ends well.
Parameter descriptions:
PER: Indicates the number of b
This robot is based on an MACD strategy for trending markets. The description of the strategy can be found on the attached youtube video. The video explains the strategy and shows a basic backtest and optimisation on a few symbols. It is advised to carry out a a backetst and optimisation of your own before using the robot. The video can be found at >> https://www.youtube.com/watch?v=wU_XCM_kV0Y  ;

Smart Market Scanner and Dashboard The trend is very important when trading a financial instrument. The trend can be identified by checking various of structures and indicators. Trend shifts can be identified by trendline breakouts and horizontal support/resistance levels. Scanner will scan the selected symbols and show you the direction/trend on selected timeframes. Algo is based on: Price Cycles, Fractals, Order Blocks, Hi-Lo
Advantages: Multi timeframe Multi instruments including Currencies

Indicator iPatterns.ex5 detects 8 different classes of volatility patterns.
DD, SD, RD, SSD are the so-called "bottoms".
DV, SV, RV, SSV are "peaks".
User can set up an Alert to be notified about a new pattern detected.
Parameters 'Pattern maximal height' and 'Pattern minimal height' work
as filters.
'iBB period' and 'iBB deviation' parameters regulate performance of
BollingerBands indicator - it provides one of the signals
forming already mentioned above 8 patterns.
iPatter

Expert works on EURUSD, GBPUSD and XAUUSD timeframe M15. Trade will be executed when Hilo Candle M15 timeframe reaches the set target. Experts are sensitive to spreads & slippage. Experts are highly dependent on the Pull Back that occurs on the M15 Timeframe. EURUSD,GBPUSD,XAUUSD Setfile Input Parameters: 1. Manage Open Positions Working time frame : Candle & chart timeframe Minimum Hilo size (in Point): Minimum High and Low distance to start trade. 2. Manage pending orders Distance of pen

Gatotkaca Support Resistance Trendline Indicator is a simple indicator that detects support, resistance and trendlines. It will helps you find breakout momentum based on lines calculated by this indicator. This is conceptually based on fractals, but with customizable periods. Compatible for any timeframes. You can customize how this indicator work by setting up the period input.
FREE

Djin is an scalper designed for USDCHF H1/M15 (hedge account) . It doesn't use martingale. Always setup stoploss and takeprofit.
RECOMMENDATIONS :
- Recommended pair: USDCHF (hedge account)
- Recommended setting: USDCHF H1/M15 (hedge account)
- Recommended Lot: auto
- Minimum capital: 1000 USD (in this case a DD of 15/20% is possible, as the account is small)
- Minimum leverage: 1:100 or upper PARAMETERS: stoploss - stop loss in points takeprofit - take profit in points Trade
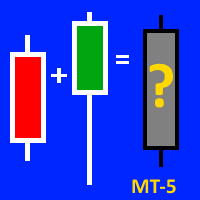
This indicator will be VERY USEFUL for anyone who works with candlestick patterns. This indicator is designed to display the average figure from two adjacent candles (current and previous). Accordingly, it shows IN CONTEXT the strength or weakness of bulls / bears (!). But please, don't forget about the classical basics of technical analysis (!). All indicators are just an auxiliary tool for reading a chart (!). A demo version on the example of mt-4 can be found here: https://www.mql5.com/ru/ma
SK Stochastic Candle Moves EA based on Stochastic oscillator . It is used to generate overbought and oversold trading signals. Easy to use and Simple No Martingale Recommended GBPUSD,EURUSD Timeframe M30,H1 others timeframes with the appropriate settings. Works for ECN/Non-ECN brokers and 2-3-4-5 digit symbols
A low latency vps is and an lower spread broker is always recommended. Support us by open My recommended broker. Exness Tickmill How its work ? Candles move XXX bars above
FREE

OPTIMIZE EA BEFORE TEST AND USE. Bitcoin M5 is for trading BTC/USD on 5 min charts. SL and TP should Start with 50000. OPTIMIZE BEFORE USE The trading strategy uses Bollinger Bands and Envelopes indicators to trade from. Trading to catch some breakout points of where the price breaches the bands and then exiting when the price crosses the envelopes. Every trade uses a fixed lot amount and has a SL and TP. The EA does not use martingale or hedging in the logic.

RISK TO REWARD TOOL for MT5 with UI on chart: (creates similar RR boxes like on tradingview) -creates and deletes draggable boxes on chart, ANY SYMBOL, ANY TF. Menu buttons:
NEW BUY, NEW SELL, DELETE ALL, ( and minimize) -draggable target TP level
-draggable SL limit level
-text labels with pips SL TP, RR ratio-there is no limit of boxes
-but program remembers first 100 boxes after changing input. there is parameter "delete_on_init" so false = every created box stays as it is,
MetaTraderマーケットは、履歴データを使ったテストと最適化のための無料のデモ自動売買ロボットをダウンロードできる唯一のストアです。
アプリ概要と他のカスタマーからのレビューをご覧になり、ターミナルにダウンロードし、購入する前に自動売買ロボットをテストしてください。完全に無料でアプリをテストできるのはMetaTraderマーケットだけです。
取引の機会を逃しています。
- 無料取引アプリ
- 8千を超えるシグナルをコピー
- 金融ニュースで金融マーケットを探索
新規登録
ログイン