YouTubeにあるマーケットチュートリアルビデオをご覧ください
ロボットや指標を購入する
仮想ホスティングで
EAを実行
EAを実行
ロボットや指標を購入前にテストする
マーケットで収入を得る
販売のためにプロダクトをプレゼンテーションする方法
MetaTrader 5のための新しいエキスパートアドバイザーとインディケータ - 118
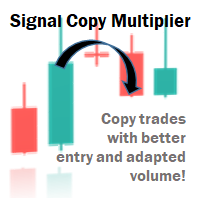
Signal Copy Multiplier automatically copies trades on the same account, for example, to get a better entry and adjusted volume on a subscribed signal. MT4-Version: https://www.mql5.com/de/market/product/67412 MT5-Version: https://www.mql5.com/de/market/product/67415 You have found a good signal, but the volume of the provider's trades is too small? With Signal Copy Multiplier you have the possibility to copy trades from any source (Expert Advisor, Signal, manual trades) and change the volume

This indicator displays the spread Simple and easy to use and fully customisable: View as Pips or Pipettes Chart symbol can be hidden Text display can be changed Change color and text styles Add or hide a decimal point Spacing options between inputs Default screen positions Screen position inputs
How to use 1. Simply use the default settings; or 2. Choose to show pips or pipettes; 3. Choose to display symbol, text or decimal; 4. Choose where to place it on the screen; 5. Save settings or save
FREE

Помощник для торговой системы SystZ . Чертит трендовые линии по соседним экстремумам зигзага. Условие для линии сопротивления - правый должен быть ниже левого. Для линии поддержки - правый выше левого. Не допускается, чтобы между экстремумами, по которым проводится трендовая линии были другие. Экстремумы, удовлетворяющие этим условиям, отмечены символом фрактала. Закрытие свечи за линией - сигнал для открытия позиции.
FREE

MA Price Crossing EA by Capitarc CAPITARC`s MA Price Crusader for MT5 MA Price Cross -is a professional expert advisor used by our investment firm it is based on moving averages and the crossing of the candlesticks. This product looks at all the pairs, the candles closing above and possible trend continuation formations of the ever changing markets, while the usual experts are based on one or two indicators, this expert trades with naked price in addition to Moving Averages!! THIS IS A TR

目前全额购买折扣 中 ! 任何交易者的最佳伙伴! 该指标具有独有的支撑阻力计算方案, 是独一无二的交易系统 。 指标特性 想象一下,如果您能提前精确的判断出重要的交易支撑阻力区域以及点位, 您的交易将如何改善?基于独特的计算方式,我们可以看到波段走势中清晰的支撑和阻力。将过去重要的支撑阻力区域经过独特的计算,将关键位置在图表中显示. 本指标支持周期设置,可以设置其他周期. 大周期重要支撑阻力,以及小周期辅助判断可以在同一图表中完成.
基本显示 显示支撑阻力的价格标签。 显示实时的支撑和阻力。 显示历史的支撑和阻力.
基本设置 设置支撑阻力计算的周期 。
警报设置 接近报警 碰触报警 报警弹窗 报警邮件发送 发送推送警报 颜色设定 可以设置不用的实时支撑阻力颜色 可以设置不用的历史支撑阻力颜色 可以设置价格标签颜色 可以点击价格标签或者点击显示区域改变区域填充方式 任何问题,相互交流

Baze Zone is a configurable combination of tools/levels (MT4 version also available at MT4 section): - Fib levels, 14, 23,50 - Fib Extension 27,61 - Pivot Points - Adds boxes to indicate range 'breakout' - ATR Range - Prev Daily Candle Range - Shortcut keys to hide/show the lines (configurable) In short, use this tool to add some extra zones to you fib tool. And use the extra's in combination with the shortcut keys to keep your chart clean. You can drag the lines for the Fib Levels.
The name

TRADING STRATEGY
Keep It Simple and Smart (KISS principle) and not stupid! This automatic expert advisor enters a trade in the DOW JONES exactly at 9 a.m. EST i.e. 30 minutes before US market open to make 10 points in profit for a continuous income stream. This is a professional trading strategy and not a get-quick-rich scheme. The trade direction (long or short) is determined by a simple algorithm based on every day market observation and thorough backtesting. For all trades to win (since 1

Strategy Overview
The Ignition EA tries to take advantage of sudden momentum when the Ignition pattern is detected. The final bar in the ignition pattern has a small opening wick, a very little or no closing wick, is large in comparison to recent bars and must start from the lower end of the current range (for a bullish ignition)
Quick Testing
Use Symbol EURUSD, Timeframe M2, and remove the GBPUSD symbol from the "Symbols" input (stratergy 1 and stratergy 2)
Settings The below settings

DESCRIPTION The ‘No Open Trades’ Expert Advisor is a dream come true to any mindful trader that knows that controlling risk is extremely vital to any successful trading plan. The ‘No Open Trades’ Expert Advisor closes all open trades in the account once the percentage loss you set is met. For example, if your account balance is $5,000 and you set the percentage loss to 5. This information has been passed to the Expert Advisor and it will close all open orders once the loss made is -$250 (which

Serepok MT5 is a trending following EA. This EA uses a custom indicators to detect entry signal. The fixed stop loss and take profit are always set for each trade. This EA has smart money management. Users only need to determine the accepted loss for each trade, EA will calculate the lot size for each trade according to stop loss price. Therefore, this EA is very safe. This EA is very easy to use and can apply for many currency pairs. Recommended time frame is H1. Note:
1. Please do back test

DYJ TradePanelMT5 allows you to perform trading operations ,opening market positions, placing pending orders, removing pending orders, and closing all positions When you use the "DYJ TradePanelMT5" to make a mistake in the direction of manual trading, you can cooperate with our remote order rescue service to turn the order back into profit. Parameters
Volume = 0.01 - - default volume; InpTP = 1200 -- default takeprofit POINTS; InpSL = 600 -- default stop loss POINTS; InpStep = 200 --
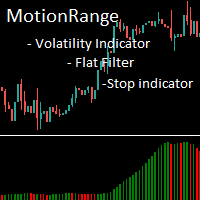
MotionRange - индикатор волатильности цены.
Индикатор не показывает направление движения цены и предназначен для наглядной демонстрации наличия трендового движения, силы тренда, ускорения и замедления трендового движения. Индикатор можно использовать для: - фильтрации флэтового состояния рынка, - открытия позиций в момент начала тренда, - закрытия позиций в момент замедления или остановки тренда.
У индикатора один входной параметр - Calculation Period. Это количество сравниваемых свечей

This indicator will draw patterns based on Rob Smith's The Strat as they emerge in real time on your chart.
As price evolves, TheStrat offers 18 distinct price action patterns that can help you get good entries in the market. Each pattern involves two or three candles, and this indicator will draw a bounding box around the candles and name the pattern. The indicator also shows when a potential setup is forming, known by stratters as an Actionable signal.
Candles
Each candle is de

FTFC は、Rob Smith の The Strat で定義されている Full Timeframe Continuity を指します。 このインジケーターはチャートに 2 本の線を引きます。四半期、月次、週次、日次、または時間次の開始レベルの最高値の 1 つと、これらの値の最低値の 2 つ目です。これにより、取引が一方向に非常に強くなる可能性が高いチャネルより上または下のチャネルが得られます。ライン間では、価格アクションが途切れ途切れになり、より広いストップを使用する必要がある場合があります. 高値と安値の中間点を示すために、3 番目の破線も描画されます。これは、市場が価格を特定の方向に押し上げようとするため、サポートまたはレジスタンスを見つけるのに適した場所です。色を NONE に設定して選択すると、この行をオフにすることができます。
設定
四半期ごとのレベルを含める 一部の人々はそれを無視することを好むため、四半期の始値を計算に含めることを選択できます。 IncludeCurrentTimeframeOpen true の場合、現在表示されている時間枠が H1、D1、W

The "VSA on the FLY" indicator is designed to quickly display various Volume Profile / Market Profile parameters.. The indicator takes the initial data for operation from the M1 timeframe. The indicator is installed on any timeframe and starts displaying data starting from the selected left border. This can be the beginning of a day, a week, a trading session, any hour, etc.
The version of this indicator for MetaTrader 4 can be found here .
The following input parameters are available: Show

Blended Candle Strength (BCS)
Any trading strategy, whether it is a continuation, trend reversal or breakout requires, in addition to analyzing the context of the price movement, confirmation signals for both trading entry and exit. And for that, it is necessary to analyze the formats of the candlesticks and fit them in known patterns to assist decision making. In addition to the context and format, two other important information to determine the strength of candlesticks are the size of the ba
FREE
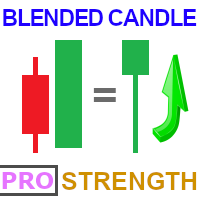
Blended Candle Strength PRO (BCS)
Any trading strategy, whether it is a continuation, trend reversal or breakout requires, in addition to analyzing the context of the price movement, confirmation signals for both trading entry and exit. And for that, it is necessary to analyze the formats of the candlesticks and fit them in known patterns to assist decision making. In addition to the context and format, two other important information to determine the strength of candlesticks are the size of th

This indicator will draw a label above or below each candle based on Rob Smith's The Strat as they develop over time on your chart.
As price evolves, a candle can switch between three states. When the candle first opens, if it sits completely within the previous candles high and low, then it will start as a Type 1. As time moves on, if it breaks either the high or low of the previous candle, it will be come a type 2, and should the price action be volatile and directionless, it may then

SuperMax MT5 is a fully automated, intelligent expert advisor with advanced mechanisms, using a dynamic system to measure market volatility to be consistent with the timing of market entry and exit. The mechanism of this system is based on the principle of mean reversion and momentum of market price. Rely on scalping and recovery strategies with optimal trading frequency and can still work well in all market conditions, be it trend or sideways, can be traded full time in any condition. This EA

This indicator draws the prior Highs and Lows for multiple timeframes, and can display potential Take Profit and Stop Loss levels. In Rob Smith's # The Strat terms, these are potential entry points, or alternatively potential targets for open positions. I like to use them in both ways. On a lower timeframe, say 5 minutes to get a good entry on a daily or weekly level, and then as a potential target. Very small stops required giving an excellent risk/reward ratio. Key Features
- Levels from Ho

The main application of the Security indicator is to generate buy and sell signals. Determining the market trend is an important task for traders. The Security indicator implements an advanced algorithm for visualizing the market trend. The main purpose of the indicator is to assess the market. Probably, almost every trader has dreamed of non-lagging MAs at least once. I have embodied this dream in my indicator. With this indicator, you can predict future values. The indicator is designed to det

The channel calculation algorithm uses the upper and lower boundaries that are separated from the price at a certain different distance. The setting is as simple as possible, apply to certain construction prices.
The indicator works best during periods of stable asset volatility, giving reliable signals on bounces and breakouts of borders and the middle line. Forex statistics show that 90-95% of the time the price moves within the range, so pullbacks are preferable to breakouts. Also, if tech

The Rocket Trend indicator is trending. The indicator draws two-color points connected by lines along the chart. This is a trend indicator, it is an algorithmic indicator. It is easy to work and understand when a blue circle appears, you need to buy, when a red one appears, sell. The indicator is used for scalping and pipsing, and has proven itself well. Rocket Trend is available for analyzing the direction of the trend for a specific period of time. Ideal for novice traders learning the laws o

Do you already know the Start Midas indicator?
What about the Vwap Standard Deviation indicator?
And I need to speak again in the book MIDAS Technical Analysis ...
The Start Midas SD Channel indicator combines the two in one, bringing the practicality and efficiency of Midas with the statistical calculation of the standard deviation.
All of this with the practicality of the White Trader Start indicators, where you can plot the indicator and move them on the screen using keyboard s

Here we have the Start Midas Fibo Bands , I confess that it is an indicator that excited me enough to operate because I was able to find more defined rules. Well, the indicator has the functions of the other indicators of the Start line , which is a possibility to plot several Midas on the screen, you can move the anchor point using keyboard shortcuts and use the legend to differentiate one anchor from another. The rules that I have analyzed for my possible setup are recommended to the entry, st

RubdFx Perfect Reversal , The reversal indicator is used to determine areas of support and resistance by Drawing an arrow with a level of supply and demand ( ReversalZones ). - You will catch more swings by reducing the period, and less swings if you increase period - Mobile, computer and email alerts available . it is not pushed by price which means the arrow will stay in one place,suitable for scalping and long term trading Also Compatible with all forex paris , BUY RULES; open a buy positio
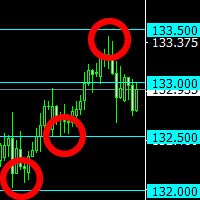
The indicator plots "round" levels, the step of which is specified in the settings. Perfect as an addition to any trading systems.
Very low price - only $30! Round levels often become price support or resistance. MT4 version: https://www.mql5.com/en/market/product/67245
This allows you to either fix a profit, or open a position after a breakdown of the level, work towards a rebound in price. The indicator will be an excellent tool in a trader's arsenal!

Put Last Viking to work now, this amazing EA was carefully made and tested for the EUR/CHF market exclusively in the 5m time frame, the purpose of this EA is to keep your capital safely and get constant profit monthly.
This EA can be used with little capital $ 100 and it works perfectly, I tried with $ 50 but it is advisable to start with a minimum of $ 100, I recommend using a VPS. You can also work a higher capital, you just have to raise the lots according to your capital, for example $ 10

Weighted average price indicator or VWAP. The well-known standard VWAP with the beginning of the day is added with the function of selecting the periodization. It can be calculated both every day and on other periods. Also the indicator allows to exclude the volume from the calculation, which will allow using it on the cryptocurrencies and forex. There is an alert for a VWAP price crossing. There are 1 and 2 standard deviation. Settings: Volume: turning volume on and off in the calculation mecha

This indicator creates the perfect RENKO for you to work with timeless types of Candles! Due to RENKO characteristics of timeless, the indicator adjusts trading arrows (otherwise they would be lost) and leaves them exactly where the negotiation occurred in Renko Candles! In addition, this indicator shows exactly the division between days, in order to make it clear to user where each trading session started and ended!
Important details: The automatically generated RENKO has an accuracy of up t

Midas is the acronym for Market Interpretation / Data Analysis System is a trade approach started in 1995 by technical analyst Paul Levine and later developed by Andrew Coles, PhD and David Hawkins. Learn more in the book MIDAS Technical Analysis: A VWAP Approach to Trading and Investing in Today's Markets , (I saw that it is possible buy via Amazon). The positive points in relation to the Midas-based indicators are the prediction of movement reversal points, the negative point is the subjectivi

The Vwap Bands Auto indicator seeks to automatically map the maximum market frequency ( automatic update of the outermost band ) and has two intermediate bands that also adjust to daily volatility.
Another tool from White Trader that combines price and volume, in addition to mapping the daily amplitude.
The external band is updated automatically when the daily maximum or minimum breaks the current frequency, and can be an input signal, seeking a return to the daily vwap.
Thus, in ad
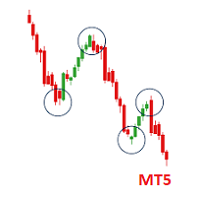
Powerful Price Action Engulfing Doji Robot MT5 version Package Contains: (Price includes both versions) SET files in Comment section. 1. Powerful Price Action EA Advanced Version with NomadTrader Money Management System: --Full EA with all adjustable settings and parameters to tweak or optimize. --It uses the NomadTrader Money Management system with Dynamic exit strategy based on Price %(percent) based Stop loss, Take Profit and Adjustable Time Filter to 1 minute preciseness, all parameters ar

CAPITARC`s NAKED TRADER Expert Advisor for MT5 Naked Trader -is a professional expert advisor used by our investment firm it is based on pure price action. This product is looks at all the price action patterns, candles and possible trend reversal formations of the ever changing markets, while the usual experts are based on one or two indicators, this expert trades naked! Literally! Pun Indented! FOREXSIGNALS uses a similar robot for their INTRADAY trades. This allows the expert to adapt to

One time offer: Only the first 10 copies of this EA will be sold at the current price. Next price: $150
HunterFX is a 100% automatic trading robot with REAL account results! Watch signals here https://www.mql5.com/en/signals/968946?source=Site+Search
Unfortunately, is the world of trading there are many scams and manipulation, fake back testing and more,
Therefore, make sure you only BUY a ROBOT who's been CONFIRMED by signals in MT5: Back test of over 9 years! https://y

Trading has never been easier. Simplify makes trading effordless. Your only work here is to buy it, attach to the EURUSD on H1 , set your risk and wait for results. Strategy was developed by genetic algorithms and of course tested by advanced robustness tests and delivered to you. It is great addon to your portfolio or as standalone strategy.
Benefits for you Amazing Plug & Play system - studying configuration and finding the best optimization is history. This work is included in the pri

O indicador Vwap Deviation Bands segue na mesma linha dos outros indicadores da White Trader, que buscam leveza, personalização e qualidade, para entregar o que há de melhor para o trader. Isto, além de combinar preço e volume (informações importantes para o trader) com uma medida estatística do desvio padrão.
Este indicador já foi utilizado e testado por outros traders que deram sugestões, inclusive, para chegarmos nesta versão final (embora ainda esteja aceitando sugestões, sempre :) ). O d

CAPITARC`s RSAS Expert Advisor for MT5 RSAS MT5 -is a professional expert advisor used by our investment firm it is based on price action and Relative Strength Index (RSI) indicator. This product is with dynamic overbought and oversold levels that automatically adapts to the ever changing markets, while the standard MT5 RSI maintains levels static levels and do not change. This allows the expert to adapt to the ever-changing market without the need to constantly optimize, just make sure yo

The Alligator indicator uses three smoothed moving averages, set at five, eight, and 13 periods, which are all Fibonacci numbers. The initial smoothed average is calculated with a simple moving average (SMA), adding additional smoothed averages that slow down indicator turns. Scan all your favorite pairs with Alligator, and get notified on your preferred time frames.
Setting is Customizable
Click to change time frame or open new pairs
Notification: Phone/Popup/Email

This indicator Allow you to get notification from 7 indicators. Scan all your favorite pairs with your favorite technical indicator, and get notified on your preferred timeframes.
Settings are Customizable
(RSI, ADX, MACD, Alligator, Ichimoku, Double MA, and Stochastic)
Click to change the time frame or open new pairs
Notification: Phone/Popup/Email
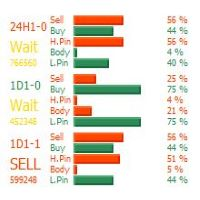
Bar Direction, This indicator is created for MetaTrader 5, It will show you strength of bar directions which you can add more options of bar as adjustable requirement such as Bar Timeframe, Bar Shift, Bar Period and also you can set true or false for Signal Alert to your Popup, Email or Push Notice and more of more you can set to show guideline for entry point according to your adjustable options also Ask-Bid and Spread Showing. It will be your assistance for reading bar strength direction easil

This EA optimized for XAUUSD on 30 minutes chart and tested on some brokers (such as XM, IC Markets, AMarkets, HotForex , ...). You can use it on any pairs with your optimization. We constantly monitor and optimize the EA and the best inputs for XAUUSD will be update on future version.
If you have any question, you can contact us on Telegram: https://t.me/BagheriEA Instagram : https://instagram.com/bagheri_ig
RISK DISCLOSURE: Prior to trading CFDs, and Forex you must be aware of the risks i

Average Cost Price helps you keep track of your open positions on the chart. In doing so, it provides lines and explanations on the chart. This line is the average price value of the Bid or Ask.
If you wish, you can see the average cost price by adding SWAP and COMMISSION to the average price value.
*** You can add commission manually per lot.
The legend below the Average Cost Price line gives you: * Average Buy or Sell price line, * Swap Amount, * Commission Amount, * Total Profit or Los

FX Adjutant Based on Price Action Signals Can be attached to any Timeframe Trades frequently (depending on Timeframe) makes profit every month Adjusts position Size accordingly to the risk you want to take Recommended Account Type: ECN or Raw Spread (Brokers: ICMarkets Raw Spread or Roboforex ECN) Recommended Leaverage: 500:1 Recommended Account Size: 2000 €/$ (min. Account Size: 1000 €/$)
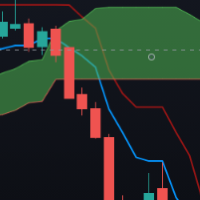
Follow the trend with the Advanced Ichimoku EA. Built upon the famous Ichimoku breakout strategy but with plenty of customization's. This EA will only trades on the candle opening if the following basic rules are met:
BUY RULES: Tenkan is greater than Senkou Span A Tenkan is greater or equal to Kijun Price is greater than Tenkan Kijun is greater than Senkou Span B
SELL RULES:
Tenkan is less than Senkou Span A Tenkan is less or equal to Kijun Price is less than Tenkan Kijun
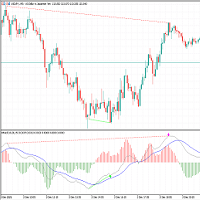
The Macd Signal with DIF line, DEA line and colored Macd Histogram. The Moving Average Convergence Divergence Indicator (MACD) is both a trend–seeking and momentum indicator which uses several exponential moving averages set to closing prices to generate trading signals. The Gray Line is the DIF line. The Blue Line is the DEA line. Version 2.0: New features are added: The indicator can show Classical bearish divergence, Classical bullish divergence, Reverse bearish divergence and Reverse bullish
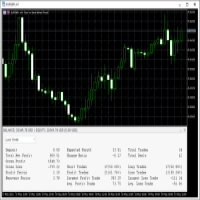
This Trading Statistics Indicator gives you an overview of your trade statistics for a selected period. You can set different periodsand filter for Symbols and magics to analyse your trading success. You can also create charts for Balance/Equity, MFE and MAE Periods: Total Time Today Yesterday This Week Last Week This Month Last Month This Year Last Year This Trading Statistics Indicator is still work in progress. In the next versions I will add telegram and email notifications and some more

////////////////////////////////////////////////// ////////////////////////////////////////////////// /////////////////////////////////
Go My Wayは、トレンドの方向性または価格の動きを示す非常に正確な指標です。
この指標は、他の12の指標に基づいて計算され、非常に複雑なメカニズムを備えています。
////////////////////////////////////////////////// ////////////////////////////////////////////////// /////////////////////////////////
設定は非常に簡単ですが、変更しないことを強くお勧めします。これはほとんどの場合、すべての時間枠で機能します。
このインジケーターを使用すると、時間通りに高精度で価格変動の方向を常に知ることができます。
このインジケータの読み取り値は、特別な数式によって注意深く

Hyper DM, Moving Distance from Moving Averages is an indicator that allows you to define the distance in points of the upper and lower bands in relation to the moving average in the middle.
Its operation is simple, it has configuration parameters of the moving average of the middle and based on it and the defined distance parameters of the upper and lower bands, it is plotted in the graph.
FREE

A personal implementation of the famous Bollinger bands indicator as a trend following mechanism, which uses a moving average and the standard deviation to define what a trend is and when it changes. Bollinger bands are usually used as an oversold/overbought indicator only, but in my opinion, the trading approach is more complete using the trend variant as an exit strategy. [ Installation Guide | Update Guide | Troubleshooting | FAQ | All Products ] Easy to trade Customizable colors and sizes I
FREE

Simple Renko Chart Generator. Just place the EA on the desired symbol, configure and hit OK, your Renko Chart is generated. You can attach any MT5 compatible indicator or template to the renko chart and perform your technical analysis.
Settings: Origin Symbol Custom Symbol Type (Pips, Ticks, Points, R) Brick Size Show Wicks Brick Open Time Asymmetric Reversals Chart Mode Refresh Ratio Watch Market Book History Start Date History Type (1 minute OHLC, Real Ticks) * Strategy Tester: Use 1 minu
FREE
多シングルと平倉を自動的に実現するEAです。ご利用ください。架台する前に何回かのヒストリカルデータテストを通過しました。以下はEAのマルチシングルと平倉の原理です。 1、2つの均等線から生まれた金叉は自動的に多単買いを実現します。2つの均等線の周期は自分で設定できます。小周期平均線のデフォルト値は5で、大周期平均線のデフォルト値は20です。 2、K線図の始値と終値を比較して減少したK線図かどうかを判断し、連続して3つの下げたK線図(すなわち三羽のカラス)の形態が現れた場合、EAは自動平倉の全部の多単である。 3、ユーザーはEAを開く時に購入の数量を設定できます。設置しないとデフォルトで0.1手となります。自分の資金状況によってこのパラメータを設定して、小さい資金の場合に投資の比率が高すぎることを防ぐように強く提案します。 4、平均線をどの時間周期で運転するかを設定してもいいです。設定しないとデフォルトでは1分間チャートとなります。これは超短線の設定値です。長い線の投資家なら、この値を変更することを勧めます。
FREE

Complete indicator that collects all results from your MT5 trading account. It a ggregates your past trading performance , displays historical price ranges. It also shows key market information, like swaps, current market spread on chosen instrument, floating P&L, number of trades, drowdown etc. Check out the below video presentation.
If you are interested in more of my products, do not hesitate to PM me.
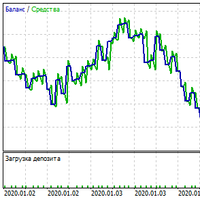
UPD: https://t.me/mql5_neuroExt актуальная версия и обсуждение. -作成されたトレーニングベースを成功させるために、一時的に使用するためのアドバイザーを無料で提供します。 -トレーニングの進行に伴い、トレーニングベースが配置されます。 -トレーニングには約20エポックが必要です。 なぜならExpert Advisorはリソースを大量に消費し、市場はそれを処理できません。Market値を持つTypeOfWorkパラメーターが導入されました。 他の希望する値に切り替える必要があります! 共同学習のために公開されました! 入力データのセットの深さは、設定で指定された時間枠の50バーです。 ThresholdOUTは効果がありません。 場合によっては、速度は非常に大きな値にのみ影響します。 トレーニングモードでは、SLとTPが等しい最小ロットで1つの注文のみを開きます。スケジュールは統一されている必要があります。このモードでは、利益自体は重要ではありません。 距離は、MaxOrders> 1でのみ機能します。 MaxOrde
FREE

The professional browser of News and Trading Sessions is now available in MetaTrader 5.
Now all the most important market information is collected on one dial!
News located on the Time scale. Planning your working time has never been so easy and convenient ... The news scale can be switched a day, two, a week, a month forward or backward (see the details in the short video). All news updates in real time.
Thanks to the built-in filters, you can configure the display of news by importance,

DETECT THE TREND AND THE BEST PRICE TO ENTER A TRADE
Trend Detection for perfect entry - Distinguish the direction of thetrend and its strength, showing a line of different colors depending on whether the trend is strong bullish, weak bullish, strong bearish or weak bearish.- Best Entry point for perfect entry - Shows an area with the best entry in favor of trend. Never trade against the trend again.
Entry signals and alerts - When the price is in a valid zone, it sends pop up alerts, teleph

トリガーは、チケットが作成または更新された直後に実行するために定義するビジネスルールです。たとえば、トリガーを使用して、チケットが開かれたときに顧客に通知できます。もう1つは、チケットが解決されたときに顧客に通知するために作成できます。 このプログラムは、トレンド反転トリガーがトリガーされたときにユーザーに示します。 このプログラムは、ミニインデックスでの取引に大きな安心感を与えてくれました。 無料のバックテストを受けてください! よろしくお願いします! Torigā wa, chiketto ga sakusei matawa kōshin sa reta chokugo ni jikkō suru tame ni teigi suru bijinesurūrudesu. Tatoeba, torigā o shiyō shite, chiketto ga aka reta toki ni kokyaku ni tsūchi dekimasu. Mō 1tsu wa, chiketto ga kaiketsu sa reta toki ni kokyaku ni tsūchi su

This indicator is able to determine the price levels at which there was the most volume for the specified period of history. In the future, the price often bounces off such levels, and this can be successfully applied in trading. They are displayed as lines, some parameters for determining the levels can be adjusted. This indicator is simple, therefore, it does not report signals, and only builds levels on EUR/USD. Parameters
HistoryBars - the number of bars to determine the near volume levels;
FREE

This indicator plots in the candles the divergence found in the selected indicator and can also send a notification by email and / or to the cell phone.
Works on all TIMEFRAMES. Meet Our Products
He identifies the divergences in the indicators:
Relative Strength Index (RSI); Moving Average Convergence and Divergence (MACD); Volume Balance (OBV) and;. iStochastic Stochastic Oscillator (STOCHASTIC).
It is possible to choose the amplitude for checking the divergence and the indicator has

Was: $49 Now: $34 Blahtech Better Volume provides an enhanced version of the vertical volume bars. Each bar is compared to the previous 20 bars. Depending on its volume, range and volume density it will be assigned a state and colour. Low Volume – Minimum volume High Churn – Significant volume with limited movement Climax Neutral – High volume with unclear direction
Climax Up – High volume with bullish direction Climax Dn – High volume with bearish direction Climax Churn – High vol

Dark Support Resistance is an Indicator for intraday trading. This Indicator is programmed to identify Support and Resistance Lines , providing a high level of accuracy and reliability.
Key benefits
Easily visible lines Only the most important levels will be displayed Automated adjustment for each timeframe and instrument Easy to use even for beginners Never repaints, never backpaints, Not Lag 100% compatible with Expert Advisor development All types of alerts available: Pop-up, Email, Pus
Big promotion! , prices are now on discount , get your copy now The Rubdfx Price Tracker that is used to show price price bound , the price almost never goes out of the channel and most of the time price will react when it touches the channel limits .It determines the best highest and lowest prices at which you can sell and buy respectively Suitable for scalping & swing trading It Draws arrows that appear after a candle close , The arrows indicate bullish or bearish pressure For bearish an

Expert Interstellar works with the price levels that. Based on stronger levels, the algorithm generates an entry signal. Topping up the series is carried out at weaker levels, but those that are more often recorded. The maximum refill is 8 orders in a series in one direction. To align profits and losses, a take profit correction algorithm has been created. The texprofit which is set in the settings is applied if there are already all 8 orders in the series. If there are fewer orders, then the t

- The expert advisor determines the number of characters in quotes automatically. - The timeframe on the chart does not matter, you can set any digits. Working timeframe is set directly in the settings of the EA. - You can use a dynamic calculated volume or a fixed one. - The spread filter prevents the expert advisor from opening trades when its value is large. - All trades the EA are open with the Take Profit parameter. - The drawdown control function allows the EA to forcibly close all posit

The market price usually falls between the borders of the channel .
If the price is out of range, it is a trading signal or trading opportunity.
Basically, Fit Channel can be used to help determine overbought and oversold conditions in the market. When the market price is close to the upper limit, the market is considered overbought (sell zone). Conversely, when the market price is close to the bottom range, the market is considered oversold (buy zone).
However, the research can be used

STL TradeBooster trades on the currency pairs EUR/USD, GBP/USD, USD/CAD, AUD/USD, on the 5-minute timeframe. STL TradeBooster works with any deposit STL TradeBooster enters the market on the Stochasic and MA indicators STL TradeBooster has a convenient control panel STL TradeBooster trades in two modes Safe mode and Hard mode Safe mode - intermediate lot 0.02 is used in a series of orders, trailing stop is activated, which prevents gaining profit, but also does not increase large series. Sui

Buy and sell signals based on the Reversal Closing Price Setup for trend continuation, created by Stormer.
How does it work? The indicator activates the buy signal when we have a low below the 2 previous lows and a close above the previous close.
For a sell signal we need a high above the 2 previous highs and a close below the previous close.
How to use it? One way of using it, as suggested by Stormer, is to enter the trade with a buy stop order one tick above the high of the candle w

Automatic Trend Line Fit. This indicator automatically plots the straight line and parabolic (curved) trend to any symbol at any timeframe. The plotted straight line is a good indication of the current trend and the curved line is an indication of a change momentum or change in the current trend. Plotting the straight line over about 2/3 the number of candles as the curved line is usually a good way to determine entry and exit points as it shows the current trend and momentum of the market. This
FREE

Gapless Moving Average (GMA)
Improved version of standard Moving Average (MA) from MetaTrader library which provides the possibility to eliminate the 'gaps' between candle sticks which distort the average values mainly during the N ('period') initial candles after market opens due to the spread ('gap') between closing price from previous day and opening price from the next day. The greater these 'gaps' are, the more divergent the standard MA is in order to indicate the current p
FREE

GenMA MTF
The signal indicator WITHOUT REDRAWING gives recommendations on the direction of trading.
When the price moves through the internal channel, it gives signals (red and blue arrows) that recommend a possible change in the direction of the price movement up or down.
When the price crosses the external channel, it gives signals (yellow arrows), warning that a strong price movement is possible, which will not immediately change the direction of trading.
When the price crosses the a
FREE
MetaTraderプラットフォームのためのアプリのストアであるMetaTraderアプリストアで自動売買ロボットを購入する方法をご覧ください。
MQL5.community支払いシステムでは、PayPalや銀行カードおよび人気の支払いシステムを通してトランザクションをすることができます。ご満足いただけるように購入前に自動売買ロボットをテストすることを強くお勧めします。
取引の機会を逃しています。
- 無料取引アプリ
- 8千を超えるシグナルをコピー
- 金融ニュースで金融マーケットを探索
新規登録
ログイン