YouTubeにあるマーケットチュートリアルビデオをご覧ください
ロボットや指標を購入する
仮想ホスティングで
EAを実行
EAを実行
ロボットや指標を購入前にテストする
マーケットで収入を得る
販売のためにプロダクトをプレゼンテーションする方法
MetaTrader 5のための新しいエキスパートアドバイザーとインディケータ - 107

Santa Trend Indicator is an efficient way to forecast and detect the trend in any market. Advantages Generates instant buy and sell signals. Provides an alternate exit strategy to your existing trading system. Never repaints, never backpaints, never recalculates. Works in all symbols and all timeframes. Perfect trend filter for any strategy or expert advisor. Fully compatible with Expert Advisor (EA) development. Does not lag.
FREE
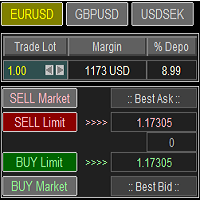
Trade Panel with Loss Breaking for MT5
Multi-instrumental trading panel with the function of transferring the stop loss of positions to loss breaking.
Has the following distinctive properties:
All trading parameters and panel operation are set in the settings. The traded position volume (lot size) is quickly changed. The required margin and the percentage of the required margin of the current deposit for the specified lot size are displayed. Shows profit when take profit is triggered and lo

Sprocket is an Expert Advisor that implements the scalping principle. A minimum spread is required for correct operation. What is a prerequisite.
There is an opinion that scalping is the lot of beginners. But in fact, it is wrong. In order to conduct a trading operation correctly for himself, a trader needs to learn scalping, otherwise the result may be negative. That is why this bot exists to be an assistant to the trader.
By placing currency fluctuations on time charts with timeframes for
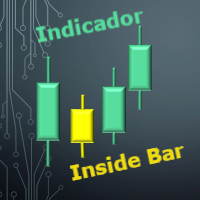
Identificador de Inside Bar O Inside Bar é uma formação de vela de reversão / continuação, e é um dos padrões de Candle mais operados pelos trader. Esse indicador permite que você identifique um O Inside Bar no gráfico de forma rápida e fácil, lhe permitindo uma tomada de decisão muito rápida e precisa. Sendo ideal para lhe ajudar nas suas diversas estratégias de Day Trade ou swing trade. O visual e a marca registrada da análise gráfica por esse motivo esse indicador conta com 3 opções visuais p

Less is more. Find the strongest trends! This expert scans ALL currency pairs for a strong trend combined with a breakout.
Requirements for a trend report: 1. Up-trend or down-trend must be found in all of the following timeframes (D, H4, H1, M30) 2. Breakout in the daily timeframe (the upper or lower band of the Bollinger band must be broken)
The correctness of the trend is confirmed to 90%
FREE

This indicator shows the breakeven line level for the total number of open positions of the current symbol with P/L value and total volume. This indicator is helpful to decide the exit level when using a trading grid strategy. The style of the breakeven line is customizable to choose the color, line shape and font size of the positions description. Send mobile notification when crossing a positive P/L target
FREE

Santa Donchian Indicator is an efficient way to detect support, resistence and break outs in any market.
The Donchian channel measures the high and the low of a previously defined range. Typically, a trader would look for a well-defined range and then wait for the price to break out to either one side for a trade entry trigger. Advantages Never repaints, never backpaints, never recalculates. Works in all symbols and all timeframes. Perfect trend filter for any strategy or expert advisor. Fu
FREE

Santa Bollinger Indicator is an efficient way to detect price retracement in any market. A common approach is to identify overbought or oversold market conditions. When the price of the asset breaks below the lower band of the Bollinger Bands, prices have perhaps fallen too much and are due to bounce. On the other hand, when price breaks above the upper band, the market is perhaps overbought and due for a pullback . Advantages Generates instant buy and sell signals. Never repaints, never back
FREE

MT4/5通用交易库( 一份代码通用4和5 ) #import "K Trade Lib5.ex5" //简单开单 long OrderOpen( int type, double volume, int magic, string symbol= "" , string comment= "" , double opprice= 0 , double sl= 0 , double tp= 0 , int expiration= 0 , bool slsetmode= false , bool tpsetmode= false ); //复杂开单 void SetMagic( int magic, int magic_plus= 0 ); void SetLotsAddMode(int mode=0,double lotsadd=0); long OrderOpenAdvance( int mode, int type, double volume, int step, int magic, string symbol= "" , string comm
FREE
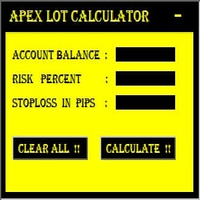
MT5 It Calculates Lot size for Manual Money Management.
If you want any custom feature or want to remove something from this product for your personal use. Please send me a personal message, I'll be happy to do so for you.
Inputs : Account Balance Risk Percent StopLoss in Pips
How to Use it : Put it on the Chart of Currency Pair which wanted to be Calculated Fill up All three Input fields with Desired Details After filling input
Reversal candles indicator , use in second window with rsi,levels 10-20-50-80-90 so u can see where the reversal candles pop upat the overbought oversold rsi levels.Great oppertunity to get in early and get out at the best moment. Candle turns blue at the 10-20 level "buy" candle turns red at the 90-80 level "sell" Always look at the major trend beore taking a buy or sell!!!

This EA uses the following Built-in indicators: Channels indicator Supply and demand indicator Trend indicator It is based on multi-directional grid system, not the normal martingale you are familiar with. When the price is in supply or demand zones, the EA will wait for a confirmation before entering a position. The confirmation is through the three above indicators together. You don't need to purchase any of the indicators mentioned above if you don't want to see them on the live chart.
Necessary for traders: tools and indicators Waves automatically calculate indicators, channel trend trading Perfect trend-wave automatic calculation channel calculation , MT4 Perfect trend-wave automatic calculation channel calculation , MT5 Local Trading copying Easy And Fast Copy , MT4 Easy And Fast Copy , MT5 Local Trading copying For DEMO Easy And Fast Copy , MT4 DEMO Easy And Fast Copy , MT5 DEMO
Auxiliary indicators It waits for the hunt, waits for the price limit to appear, waits for

INTRODUCTION KMBC Trader EA is based on 4 famous indicators that can help you get an annual profit of over 90% in the last 14 years. Focusing on long-term trading strategies may potentially help your account growing year by year.
INDICATORS The 4 famous indicator is: Keltner Channel Moving Average Bollinger Bands Cumulative Sum
FEATURES Built-in trade management Indicator parameter customization
HOW TO SET UP Symbol: EURUSD ( specialize in EURUSD) Timeframe: D 1 Lot: Amount for a new

Moving Wizard indicator will guide you to work with Trend and give pure Entry point depending on crossing on the chart it work on all currency and all Timeframe you can use it daily or scalping or swing its good with all and This indicator you can make it your strategy i work on it on H1 Timframe and make a good money you can take alook on it and you see a great resault on chart .Gold moving is to Know the Trend of price other moving below it mean we looking to sell orders . if above it we loo

Stair shape EA was created after several years of effort and programming by a strong program team. This expert is a fully automated, multi-currency trading system that doesn't require any special skills from you. Just fire up this EA and rest. You don't need to set up anything, EA will do everything for you. But if there is a problem or you do not know what to do, be sure to let me know. I will help you in the shortest possible time. The expected estimated profitability according to the backte

High and Low
The indicator marks bars with a simple trend definition“ each subsequent high above/below the previous one and each subsequent low above/below the previous one ”. Charles Dow
Formula:
Max – The current maximum Min – The current minimum MaxK – Maximum per period MinK – Minimum per period
Min>MinK & Max>=MaxK – Symbol on top Max<MaxK & Min<=MinK – The symbol on the bottom
Input parameter:
Number of bars in the calculated history Period for current timeframe The distance
FREE

バスケットEAMT5 は、最高の利益ハーベスターであり、究極のアカウントプロテクターであり、すべてが1つの非常に使いやすいソリューションです。 バスケットEAΜΤ5 の背後にある考え方は、すべてのオープンポジションを合わせて、バスケットレベルでトレーディングアカウント全体の利益および/または損失を制御できるようにすることです。 これは、すべての管理されたポジションについて、口座残高のパーセンテージまたは口座通貨(金銭)で、バスケットテイクプロフィット、ストップロス、損益分岐点、およびトレーリングストップロス設定を提供します。 マジックナンバーやシンボルに応じて、特定の取引の管理または管理からの除外を可能にします。 また、アカウント保護設定を備えており、アカウントが利益を得るかストップロスのエクイティに達したときに、すべてのオープントレードを閉じ、すべての保留中の注文を削除し、すべてのチャートを閉じ、それらに添付されている他のEAを削除します。
ヒント:Basket EA MT5 デモバージョンをダウンロードして、デモアカウントで試すことができます: こちら ダウンロードした無

This is a multi-currency Expert Advisor with an intelligent order opening function, a news filter and dynamic drawdown control.
The Expert Advisor analyzes the price of each candle and its dynamic deviation in the flow of quotes and makes a decision only when the candle closes. A series of orders is closed only when a positive result is achieved.
A system of algorithms is used in combination with risk control technology to reduce account drawdown. Champion EA is suitable for beginners and

ブリックダイアグラム-別の取引方法 数え切れないほどのチャートのローソク足で混乱しているトレーダー、または線の描き方や支持線と抵抗線の描き方がわからない場合は、現時点で自分に合った別の取引方法を見つける必要があります。NS。ドライバーが繰り返し問題に遭遇した後、完全なオーバーホールのために停止するのと同じように、同じことがトランザクションにも当てはまります。 レンガチャートは、日中のトレーダーに簡単な取引方法を提供します。実際、この方法は川崎汽船と同じ歴史があり、日本でも始まりました。 ブリックチャートを定義するために、それらはセットポイントまたはベーシスポイントの価格トレンドのみを記述します。たとえば、10ポイントのブリックチャートは、価格変動の10ポイントの上昇傾向または10ポイントの下降傾向のみを表すことができます。 ブリックダイアグラムには、価格が時間に関係しないという独自の利点があります。つまり、価格の変化が設定値に達したときにのみ、新しいブリックダイアグラムが表示され、ブリックダイアグラムによって価格のバリが削除されるため、感覚から非常に快適です。

Smart Gridder MT5は、RSIおよびボリンジャーバンドに基づいています。最適化された設定を以下に示します。 EAの戦略は、ボリンジャーバンドを横切るろうそくに基づいており、RSIは、買いまたは売りの取引を開始するかどうかを決定する要因になります。グリッドサイズは自動的に計算されます。
最適化された設定:
最小入金額:$ 400セントアカウント
EURUSD-https://drive.google.com/file/d/1BVz5ad8kwgz7NcJCNr0mfQzGurc53u1t/view?usp = sharing GBPUSD - https://drive.google.com/file/d/1HresrpXpbpWPhiCF_GlnVdVszFX6bUwr/view?usp=sharing
設定:
RSI設定
RSI期間
買われ過ぎ
売られ過ぎ
RSIの時間枠
平均グリッド
AGタイムフレーム
スプレッドフィルター
最大スプレッド
時間枠
資金管理
自動ロ

"Elder Ray" or "Ray" indicator is based on the Dr. Alexander Elder's oscillators: Bulls & Bears Power. Both of them works with an EMA. This indicator is used by traders to identify divergence, market directions and more... Dr. Elder's method generally uses a 13-day EMA Period but this can be modified based on your personal demand. The calculations are: Bulls Power= high candle - EMA close Bears Poder= low candle - EMA close Lime line represents Bulls Power and OrangeRed line, shows Bears Power
FREE
This expert advisor trades using the famous super trend indicator: it is completely loyal to the original algorithm and implements many other useful features for the exigent trader, like customizable trading sessions, multi-timeframe filters and many others. [ Installation Guide | Update Guide | Troubleshooting | FAQ | All Products ] Easy to use and supervise Fully configurable indicator settings Customizable break-even, stop-loss, take-profit and trailing-stop settings Works for ECN/Non-ECN br
FREE

Ing (inguz,ingwar) - the 23rd rune of the elder Futhark ᛝ, Unicode+16DD. Add some runic magic to your trading strategies. The correct marking of the daily chart will indicate to you the successful moments for counter-trend trading. Simple to use, has high efficiency in volatile areas. Be careful in lateral movements.
Signals ᛝ are generated when the main lines of construction intersect.
Red arrow down - recommended sales
Blue up arrow - recommended purchases
rare purple arrows indicate

Implements a channel based on integrated comparison of moving average values with improved functionality. As a result, the chart displays a channel of deltas of moving averages in the center line and an indentation of the channel boundaries over a specified range.
What is the channel? This is the price range (limited), in which all its dynamics (movement) takes place over a certain period of time. This method is very old, the Forex channel strategy dates back to a long time, when the theory
Bollinger Bands (BB) are similar to Envelopes. The difference between them is that the boundaries of the Trade Bands (Envelopes) are located above and below the moving average curve at a fixed percentage distance, while the Bollinger Bands are plotted at distances equal to a certain number of standard deviations. Since the magnitude of the standard deviation depends on volatility, the bands themselves adjust their width: it increases when the market is unstable, and decreases in more stable per

GRat Clusters is an indicator that shows various data in the form of clusters on a price chart: volume, delta, ratio of sales and purchases, etc. It allows you to visually see the market profile in real time and on history at a given depth. Capabilities 1.8 types of cluster data: volume, delta, purchases and sales , volume and delta, imbalance between sales and purchases , volume profile, delta profile, buy and sell profile. 2. A cluster period can be either any available in MT5 timeframe or

Moving average, moving average (English Moving average, MA) is a general name for a family of functions, the values of which at each point of determining the level of some average value of the original function for the previous period.
CalcPipsOn - In order to add rozruhunok on the chart, you must activate this field.
The previous development of a variant of this indicator differed in that it had an extended functionality for calculating averaging in the set, as well as advanced possibili

Vegas Tunnel, with up to 20 levels, allowing you to plot or not each level with color change, line thickness and ON/OFF visualization for easy use 100% free and lifetime Recommended use for time frames: Original --> H1 Fractals --> M15, M30, H4, D1 and W1 When the black dots are above the tunnel, start short positions. When the black dots are below the tunnel, start long positions. It's important to remember that just because the market breaks the line of lying doesn't mean it's time to enter a
FREE

BLAZING NIGHT SCALPER ALL NEW GRID RECOVERY SYSTEM ADDED
Night scalping using Stop Losses have worked incredibly well in previous years prior to 2022. Blazing Night Scalper was originally tested on more than 10 years of Tick Data using Take profit and Stop Loss with amazing results. As soon as we hit 2022 night scalpers became gradually more difficult to gain profits most likely due to many reason such as brokers increasing spreads and having too many Expert advisors trading during these hou

Implements a channel based on the moving average indicator with improved functionality.
Moving average, moving average (English Moving average, MA) is a general name for a family of functions, the values of which at each point of determining the level of some average value of the original function for the previous period. The channel moves up and down relative to the moving average by a specified number of points.
This indicator is suitable for those who are interested in the classic calc
Moving average, moving average (English Moving average, MA) is a general name for a family of functions, the values of which at each point of determining the level of some average value of the original function for the previous period.
This indicator is suitable for those who are interested in the classic calculation method but with improved functionality. There is a version for both MT4 and MT5.
Moving averages are commonly used in time series data to smooth out short-term fluctuations a

This is an intra day strategy that is simple and resilient for long term use. There are only a few parameters and the entry is triggered by price action, no indicators are needed. The time of entry and exit will affect the performance, defaults can be used for safe and conservative trading. Broker spreads will also affect the returns, because it is intraday, the frequency of trade is once per day per pair. Do try out the backtest and forward test to verify the results. No grid or martingale
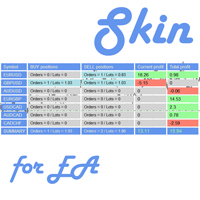
This utility is a graphical shell for other Expert Advisors that do not have their own graphical shell or whose graphical shell you do not like. Just run the utility on a free chart of any currency pair, specify in the input parameters the "Magic Number" of the advisor to which you want to connect the utility, and a graphical shell will appear on the graph, containing information about the traded currency pairs, current positions and trading results of your advisor. If you like this utility, tak
FREE

Implements an oscillator based on a simple comparison of the last two moving average values with improved functionality. As a result, the graph displays the delta of the two moving average values. In the case of a single value, the moving delta is calculated relative to the last two candles, which price of comparison will be specified in the Price parameter. The delta of two values is often used to determine the trend, depending on the length of the moving averages, it can be a longer or sh
An indicator of patterns #9 and #10 ("Cup with handle") from Encyclopedia of Chart Patterns by Thomas N. Bulkowski.
Parameters: Alerts - show alert when an arrow appears Push - send a push notification when an arrow appears (requires configuration in the terminal) PeriodBars - indicator period K1 - an additional parameter that influences the accuracy of recognition and pattern shape (the lower the value, the smoother the cup edge is) K2 - an additional parameter that influences the accuracy o

An indicator of patterns #24, #25, #26 and #27 ("Head and Shoulders", "Complex Head and Shoulders") from Encyclopedia of Chart Patterns by Thomas N. Bulkowski.
Parameters: Alerts - show alert when an arrow appears Push - send a push notification when an arrow appears (requires configuration in the terminal) PeriodBars - indicator period K - an additional parameter that influences the accuracy of pattern shape recognition. The smaller the value is, the smoother the row of peaks/valleys shoul
An indicator of pattern #54 ("Dead cat bounce") from Encyclopedia of Chart Patterns by Thomas N. Bulkowski.
Parameters: Alerts - show alert when an arrow appears Push - send a push notification when an arrow appears (requires configuration in the terminal) PeriodBars - indicator period ArrowType - a symbol from 1 to 17 ArrowVShift - vertical shift of arrows in pixels. Note. Arrows appear on a forming bar and do not disappear.
It cannot be guaranteed that the indicator recognizes the pat
An indicator of pattern #55 ("Dead cat bounce, inverted") from Encyclopedia of Chart Patterns by Thomas N. Bulkowski.
Parameters: Alerts - show alert when an arrow appears Push - send a push notification when an arrow appears (requires configuration in the terminal) PeriodBars - indicator period ArrowType - a symbol from 1 to 17 ArrowVShift - vertical shift of arrows in pixels. Note. Arrows appear on a forming bar and do not disappear. It cannot be guaranteed that the indicator recognize

This is an indicator advisor that trades 24 hours a day. This advisor is not for get rich quick This EA does not draw millions of dollars in profit in the tester. I will develop this Expert Advisor and improve the parameters for different pairs and will be happy to discuss trading with this Expert Advisor here in the appropriate section. The Expert Advisor has no installation files. I did this for ease of installation. Timeframe I recommend and use only H1 This is not a scalper. The EA

The QRSI indicator is one of the most important and well-known indicators used by traders around the world. By its nature, the QRSI indicator is an oscillator, that is, it fluctuates in a certain zone, limited by the maximum (100) and minimum (0) values. Specifically, this indicator works according to an accelerated algorithm, but this is not its only difference. This indicator implements a more advanced calculation based on the Relative Strength Index algorithm. The peculiarity of the implemen
An indicator of patterns #50 and #51 ("Triple Bottoms", "Triple Tops") from Encyclopedia of Chart Patterns by Thomas N. Bulkowski.
Parameters: Alerts - show alert when an arrow appears Push - send a push notification when an arrow appears (requires configuration in the terminal) PeriodBars - indicator period K - an additional parameter that influences the accuracy of pattern shape recognition. The smaller the value is, the smoother the row of peaks/valleys should be, so fewer patterns will

An indicator of patterns #45 and #46 (Three Falling Peaks and Three Rising Valleys) from Encyclopedia of Chart Patterns by Thomas N. Bulkowski. Parameters: Alerts - show alert when an arrow appears Push - send a push notification when an arrow appears (requires configuration in the terminal) PeriodBars - indicator period K - an additional parameter that influences the accuracy of pattern shape recognition. The smaller the value is, the smoother the row of peaks/valleys should be, so fewer patt

>>> Index Trader Suite Live Results here >>
>>> Index Trader Suite v.1.0 Presets: Download >>
>>> Index Trader Suite MT4 version available here >> Index Trader Suite is a fully automated trading advisor based on a proprietary trading strategy for the world's most popular and liquid Stock Indices. The system is based on the principles of Price Action and does not use technical indicators to determine the optimal points for opening trades. The strategy is based on 2 key principles

Эксперт, способный приносить прибыль при открытии позиций случайным образом. Показывает хорошие результаты при долгосрочном трейдинге – на периодах от H12.
Особенности
Доступен полностью автоматический режим работы. Открытие позиций производится случайным образом. Применяется Мартингейл – в случае, если предыдущая позиция закрылась с убытком, текущая открывается с объемом, компенсирующим данный убыток. Параметры
Mode – режим работы Эксперта: Automatic – автоматический (рекомендуется); Ma
FREE

Killer Market MT5 is an advisor with a system for "Resolving" a basket of unprofitable orders, a news filter, a filter for open positions on other trading instruments and the function of sending trading signals to your Telegram channel.
The Expert Advisor can be used to restore unprofitable positions on the account as a utility to bring trades to breakeven that you opened with your hands or other Expert Advisors.
Works inside a linear regression channel, input on several conditions. The s

An anchored Vwap With Arrows is an indicator that includes a moving average weighted by volume that allows you to plot on a bottom or a top. Usually banks and institutions measure an average price, this average price is a price range where they agree to make a trade. Using the logic of anchored vwap with arrows it is possible to understand that if the price breaks the vwap it means that someone with enough buying and selling power has lost control. You can use vwap anchored with arrows in any ti

This is the MetaTrader version of the very popular Squeeze Momentum indicator. It is based of of John Carter's TTM Squeeze volatility indicator, as discussed in his book Mastering the Trade. With this version you can enable notifications when a squeeze is released (push notification, email, or pop-up message). Strategie
Grey dots indicates a squeeze in the current timeframe. Blue dots indicates that the squeeze is released. Mr. Carter suggests waiting till the first blue dot after a grey dot a

Horizontal volume bars, Cluster analysis, Volume profile Volume in Range gets information about the accumulated volume in a specified vertical range and period in bars. The received data is then plotted on the chart as rectangular boxes with the volume quantity inside. Usage:- The tool acts as a support resistance levels but most importantly it should be used to check in which direction the price breaks out of the significant levels formed by this indicator and then actions to be taken on correc

Market structures, Market balance, Range breakouts This tools helps to identify areas of market ranges, structures and plots colored boxes on breakout of those areas. User is given the option to receive alerts and notifications on the formation of the blocks. The tool has the ability to become an essential part of a technical trading system or even pure price action trading. Usage:- An essential tool for price action or technical traders. More information in the blog

Adapted from the award winning international best seller (Short Term Strategies That Work) by Larry Connors and Cesar Alverez in 2008, this concept was retested 10 years after the book published and that will give you an idea of the concept if it still works. Take the last 10 years as walk forward and this strategy is added with a twist to risk management with arbitrary 5% stop loss and exit day counted as calender days instead of trading day. This EA works on dual mode, Long and Short. Origin

Open Risk Profit shows your current risk or possible profit of all open positions. Total open risk is your loss if all positions run into the stop loss.
Total open profit is your profit if all positions reach your take profit.
Total float is your current profit or loss of all positions. The program also breaks down the information into the individual symbols. For example, you can monitor how much is your current profit and your potential risk in EURUSD, no matter how many individual positio
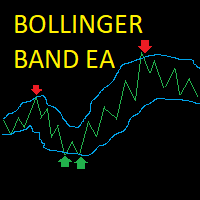
Bollinger Band Scalper EA This EA opens trades when the price hits and bounces off the Bollinger Bands, it closes the trade when it reaches the opposite Bollinger band or if the price reverses into the trailing stoploss. Posisitions are sized dynamically depending on the user's account balance. The EA waits for the price to cross the Bollinger Band and then opens a market order at a set percentage of the bandwidth from the band chosen by the user. The position is sized a percentage of the user's
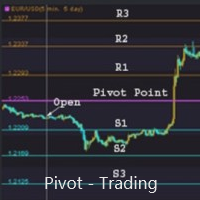
支点交易 : 1.pp 支点 2. r1 r2 r3 , s1 s2 s3 交易实用必备工具指标 波浪自动计算指标,通道趋势交易 完美的趋势-波浪自动计算通道计算 , MT4版本 完美的趋势-波浪自动计算通道计算 , MT5版本 本地跟单复制交易 Easy And Fast Copy , MT4版本 Easy And Fast Copy , MT5版本 本地跟单复制交易 模拟试用 Easy And Fast Copy , MT4 模拟账号运行 Easy And Fast Copy , MT5 模拟账号运行
支点( pivot points) 作为一种交易策略已经很长时间了,最初是场内交易员使用这种方法。使用这种方法通过几个简单的计算就可以了解市场在一天中的去向。 支点法中的支点是一天中市场方向的转向点,通过简单地计算前日的高点、低点和收盘价,可以得到一系列点位。这些点位可能形成关键的支撑和阻力线。支点位,支撑和阻力位被统称为支点水位。 你所看到的市场每天都有开盘价、高价、低价及收盘价(有一些市场是 24 小时开盘,比如外汇市场,通常用 5pm EST 作为开盘和收盘时间)。这些信

CandleVolume is an indicator that colors bars according to increasing or decreasing volume. You can use it to identify strategic regions of the chart and complete an analysis. White means low volume, yellow means medium volume and red means climax volume. It is a recommended indicator if you like to interpret market contexts and understand how market cycles work.

Все паттерны из книги Томас Н. Булковский "Полная энциклопедия графических ценовых моделей" в одном индикаторе со сканером. Cканер включается параметром ScannerMode. При ScannerMode=false индикатор ищет один паттерн (выбирается переменной Pattern). При выявлении паттерна индикатор рисует стрелку, открывает окно сообщений, выполняет push-уведомление. У индикатора много параметров, некоторые их них задействованы всегда, некоторые выборочно. Включите переменную ShowHelp - на графике отобразится по

This indicator is an oscillators that shows the real strength of 8 main currencies in the Forex market. It recreates a basket of the main currencies and applied a True Strength Indicator on each of them. The calculated real currencies are: EUR - USD - GBP - CHF - JPY - AUD - CAD - NZD. It clearly identifies overbought and oversold ares. From reading the oscillator you can choose the right Forex symbol to trade.
Future versions: I am working on adding alarm and a real buy sell signal, choos

Save Profit MT5 was created after several years of effort and programming by a strong program team. This expert is a fully automated, multi-currency trading system that doesn't require any special skills from you. Just fire up this EA and rest. You don't need to set up anything, EA will do everything for you. But if there is a problem or you do not know what to do, be sure to let me know. I will help you in the shortest possible time. The expected estimated profitability according to the backte
Dark Gold is a fully automatic Expert Advisor for Scalping Trading on Gold , Bitcoin , Eurusd and Gbpusd. This Expert Advisor needs attention, in fact presents highly customizable. Dark Gold is based on Dark Support Resistance mt5 indicator (owning it is not necessary) , these Trades can be manage with some strategies. If you Buy this Expert Advisor you can write a feedback at market and get Dark Support Resistance indicator for Free , for More info contact me The basic strate

セミオートマーティンシステム
導入
このツールは半自動マーティン取引に使用され、パネルをクリックして注文すると、EAがポジションを管理します トランザクションの方向を決定し、残りはEA管理に任せてください 自動マーティン、設定されたグリッドに従って倉庫を追加し、この機能を無効にすることもできます ワンクリック清算 1つのキーロック機能 時間制御 警告音プロンプト
特性
トレーディングチャート:任意 取引可能な通貨:任意 自動テイクプロフィットクロージング バックテストに使用できます クリアパネルディスプレイ
パラメータ
主な設定パラメータ
LogLevel = LOG_LEVEL_INFO; //ログの書き込みレベル UseAutoMagic = true; //マジックナンバーを使用するかどうか MagicNumber = 6; //マジックナンバー0-2000を設定します ロット= 0.01; //初期取引量 UseMartin = true; // Martin関数を使用するかどうか ブースター= 1.7; //増加の倍数 NetGap = 10;

EasyTradePad は、手動/半自動取引用の取引パネルです。 ポジションと注文を処理し、ワンクリックで資金管理を計算します!
パネルは間違いなくあなたを助けます:
あなた自身が%または預金の通貨で指定した正確なリスクで取引を開始します ストップロスを損失なしに移動して利益を節約する 市場のボラティリティを平滑化することによって取引を平均化する 取引があなたの方向に進む場合は、トレンドに沿ってポジションを追加します さまざまなトレーリングストップ設定を使用して最大利益を絞ります すでに開いている取引のパラメータを変更する 収益性の高いポジションの部分的なクローズを実行する 主な機能: 注文の開始と終了 ポイント単位のSLとTPの計算 預金の%でのSLとTPの計算 $でのSLとTPの計算 ピラミッド 平均化 損益分岐点に転送 リスクに対する利益の比率の自動計算(比率) ポイントとローソク足の影によるトレーリングストップ ピラミッド
パネルは、取引が最初に指定されたTPに近づくと、追加の取引の段階的な開始を実行します。同時に、次の注文ごとに%リスク削減を設定できるため、新

MT5のエキスパートアドバイザーリスクマネージャーは非常に重要であり、私の意見ではすべてのトレーダーにとって必要なプログラムです。
このエキスパートアドバイザーを使用すると、取引口座のリスクを管理することができます。リスクと利益の管理は、金銭的およびパーセンテージの両方で実行できます。
エキスパートアドバイザーが機能するには、それを通貨ペアチャートに添付し、許容可能なリスク値を預金通貨または現在の残高の%で設定するだけです。 PROMO BUY 1 GET 2 FREE - https://www.mql5.com/en/blogs/post/754725
アドバイザ機能
このリスクマネージャーは、リスクの管理を支援します。
-取引のために -1日あたり - 1週間 - ひと月ほど
制御することもできます
1)取引時の最大許容ロット 2)1日あたりの最大注文数 3)1日あたりの最大利益 4)エクイティを引き受ける利益を設定する
それだけではありません。設定で自動設定を指定した場合、アドバイザーはデフォルトのSLとTPを設定することもできます。
このスクリーナーを使用すると、選択した期間(時間枠)内に通常よりも買われ過ぎ(成長率)または売られ過ぎ(減少率)の資産を特定できます。 市場は法律によって支配されており、より安く購入し、より高価に販売しますが、自動スキャナーがないと、たとえば今週内に、通常よりも買われ過ぎまたは売られ過ぎの通貨/株を特定することは非常に困難です。現在の時間、または月。 数十または数百の機器が存在する可能性があり、すべてを手動で分析する時間がないことが物理的に可能な場合もあります。これらの問題は、Screenerを使用して簡単に解決できます。 スクリーナーができること スキャナーはどのTFでも使用できます スキャナーは、通貨、株式、暗号通貨、商品、インデックス、およびその他の機器で動作します 資産を特定するロジックは、市場の基本法則に基づいているため、普遍的です。 スクリーナーの助けを借りて、あなたはさまざまな戦略に従って作業することができます、最も一般的なものの1つはポンプとダンプです 各商品の平均値を明らかにする-SoftimoTradeScreenerは、選択したTFの資産の買われ過ぎと売られ過ぎ

iPumpインジケーターは、3つのカテゴリーのインジケーターの利点を組み合わせた用途の広いインジケーターです。
複数のTFでの同時トレンド検出 抵抗とサポートのゾーンを定義する 買われ過ぎと売られ過ぎのゾーンの決定 インジケーター機能:
トレンドの定義 この機能は、現在の市場の方向性を客観的に評価し、主観を避けたいすべてのトレーダーに必要です。ほんの一瞬で、最も重要な時間枠でトレンドの方向を比較することができ、これは明確で直感的になります。
サポートとレジスタンスレベルの決定 iPumpインジケーターを使用すると、数秒以内に資産の潜在的な価格障壁を評価できます。
また、インジケーターは目の前にあるレベルのタイプを示します。
テストレベル(抵抗/サポート) 逆転レベル 弱いレベル テストされていないレベル 買われ過ぎと売られ過ぎのゾーンの決定 このタスクでは、インジケーターに遅延や再描画のないシグナルオシレーターがあり、アセットの現在の状態を示します。このデータに基づいて、次のことができます。
購入するのが面白くなる時期を正確に知る 資産を売却することが興味深い

作業ロジック この指標の重要性は、「燃料が機器に残っている」量を理解できるという事実にあります。状況を想像してみてください。あなたが半分放電したバッテリーを搭載した車に残した場合、平均して、この量のエネルギーは通常250 kmの車に十分であるため、必要に応じて700kmの距離を超えることはできません。そのため、商品ごとに一定の日次価格変動があり、統計的観察の結果、資産が1日あたり1 ATRを通過する時間の95%、2以上のATRを通過する時間の5%のみであることが明らかになりました。
例、毎日のATR EURUSD = 682ピップ。トレードに参加します。たとえば、TPが500ピップのレベルのブレイクアウトの場合、正しいTPサイズを設定したように見えますが、資産がすでに1日のATRの90%を通過していることを考慮していません。取引が開始された時間、したがって、楽器にはTPを受け取るのに十分なエネルギーがない可能性があります。楽器の残りのチャージが10%しかない場合は、TPを調整するか、取引にはまったく参加しません。
パワーリザーブインジケーターは、計測器が慣性を使い果たした量を

EAの戦略はスウィングトレードに基づいており、iPumpインジケーターによって計算された鋭いインパルスの後のエントリーがあります。 前述のように、EAには自動サポートで手動取引を開始する機能があります。 -下降トレンドの場合↓価格が修正された後に取引を開始し、資産が買われ過ぎゾーンに入り、トレンドに沿って販売します。 -上昇トレンド↑の場合、価格が修正的に下落した後に取引を開始し、資産が売られ過ぎゾーンに分類され、トレンドに沿って購入します。 選択した資産で取引する場合、アドバイザーはトレンドを考慮し、現在のトレンドに従ってのみ取引を開始します。不採算の取引は、停止と平均化の両方を使用して閉じることができます。2番目のオプションは確かにより収益性が高く、リスクも高くなります。 利点 さまざまなTFのレベルを分析するための組み込みレベルインジケーター チャート上で手動で平均化のレベルを選択する機能 多くのピラミッド型注文を開くことによって利益を増やす能力(注文数は自分で制御できます) iPumpインジケーターのリバースシグナルに基づいて、TPを%で設定するためのより多くの基準 「ハ
戦略ロジック Pump and Dump for mt5 Expert Advisorは、トレーダーがトレーダーのために作成した完全に自動化されたトレーディングアドバイザーです。 戦略は「より安く購入し、より高価に販売する」です。価格が大幅に上昇/下降した後、注文が開始されます。 ポンプアンドダンプ戦略の基本的な意味は、価格が下がると資産を安く購入し、価格が上がると資産を高く売ることです。 市場での急激な価格変動の後、反対方向に大幅な価格ロールバックが発生し、いわゆる「ヘアピン」が描画され、EAが力強い成長または価格の下落の瞬間を捉え、に基づいて市場に参入することにお気づきかもしれません。これらの信号。ビデオとスクリーンショットで詳しく説明します。
アドバイザの戦略は、iPumpインジケーターを使用した%価格変動の分析に基づいて資産の買われ過ぎ/売られ過ぎゾーンを識別するアルゴリズムに基づいています。インジケーターは資産の買われ過ぎ/売られ過ぎレベルを評価し、これに基づいてアドバイザーは取引された商品の最適な売買ゾーン、そして市場に参入します。
利点 アカウントドローダウン

The robot uses one of the most used indicators in Asia:
* ICHIMOKU CLOUD *
There are two trading strategies:
Crossing of Tenkan and Kijun lines and; Kumo lines crossing.
Know our products
Position openings are based on the parameters identified as signals, if you activate all the robot will issue a trading order only if the number of signals is greater than the minimum stipulated by the user.
This Expert Advisor (EA) works on HEDGE (Forex, etc.) and NETTING (Bovespa, etc.) accou

このインジケータは、横ばいを検出し、検出された領域を色の付いた四角形で塗りつぶします。
このインディケータの主なアイデアは、価格がチャート上の特定の領域を埋 めたときにフラットを検出することです。
入力パラメータ
Color rectangle - 影を付ける矩形の色。
Bars in rectangle - 長方形内のバーの最小許容数。
Density in % - 平坦の密度。矩形の面積に対するパーセンテージで設定。 __________________________________________________________________ __________________________________________________________________

作業ロジック
ダウ戦略エキスパートアドバイザーは、「トレンド保持」のChalseDow理論に基づくエキスパートアドバイザーです。
エキスパートアドバイザーは選択されたTFを使用します。前のバーが上がっていた場合、それは買いを開き、前のろうそくの安値の後ろにストップを置くことを意味します(前のろうそくからのオフセットにフィルターを設定することが可能です)、次に、現在のろうそくが閉じた後、ストップロスは再び安値を超えて移動するため、足でノックアウトされなくなるまで取引は市場で保持されます。
中長期のトレンド商品の取引に最適です。取引を開始する前に、トレンドの存在について商品の独立した分析が必要です。 m1-MNからのすべての時間枠で、バーによるトレーリングポジションに最適です。
取引には、株式、通貨、金属、指数が適しています-一般的に言えば-中期的な傾向がある金融資産のほとんど。
推奨される時間枠はD1です。
ポジションは、前のバーの高値/安値を価格の方向に突破した後に開かれます。
ストップロスは、ローソク足の前のピークの後に設定されます。
トレーディング
MetaTraderマーケットは、開発者がトレーディングアプリを販売するシンプルで便利なサイトです。
プロダクトを投稿するのをお手伝いし、マーケットのためにプロダクト記載を準備する方法を説明します。マーケットのすべてのアプリは暗号化によって守られ、購入者のコンピュータでしか動作しません。違法なコピーは不可能です。
取引の機会を逃しています。
- 無料取引アプリ
- 8千を超えるシグナルをコピー
- 金融ニュースで金融マーケットを探索
新規登録
ログイン