YouTubeにあるマーケットチュートリアルビデオをご覧ください
ロボットや指標を購入する
仮想ホスティングで
EAを実行
EAを実行
ロボットや指標を購入前にテストする
マーケットで収入を得る
販売のためにプロダクトをプレゼンテーションする方法
MetaTrader 5のための有料のテクニカル指標 - 56

Smart Engulfing MT5の紹介:
洗練されたトレーディングの領域に足を踏み入れて、Smart Engulfing MT5を使用してトップクラスの吸収パターンを識別しましょう。精密かつ使いやすさを念頭に置いて設計されたこのツールは、MetaTrader 5のユーザー専用に製作されています。Smart Engulfing MT5がアラート、矢印、そして3つの異なる利益取得レベルでガイドする中で、簡潔さと効果を求めるトレーダーにとって究極の仲間となります。 パート2:純粋な吸収パターンの力を解放
Pure Engulf Pattern Analyzerを使って市場動向の複雑さに飛び込んでみましょう。従来のツールとは異なり、これは洗練された操作で、関連のないパターンをフィルタリングし、最も利益の見込まれる機会にだけ焦点を当てています。そのユニークなアルゴリズムは70%以上の注目すべき成功率を誇り、すべての取引が知的な意思決定に裏打ちされていることを保証します。 パート3:適応型のシグナル表示モード
Smart Engulfing MT5の革新的なシグナル表示モード、リバース

This is my trusted friend of trading.
So... I musted re-write this in MQL5 to use in brokers where there is only MT5.
The indicator is like a mother-in-law, who talks often, talks a lot and often inappropriately.
The indicator, in addition to giving us an entry signal on parameters which I will then list, monitors the trend of the hourly timeframe, OSMA to understand the entry direction, RSI to sense any overbought or oversold conditions from which to abstain, ATR for the volatility and ADX
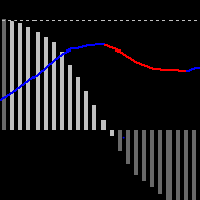
This indicator shows the MACD line and the difference WMACD - MACD to it. that is, the divergence between price and weighted acceleration. Divergence is shown with a histogram. It took a bit of math to get a readable result.
What does the histogram say?
If the course is consistent with the price movement, then the price is driven by volumes. It is passing through an area of higher liquidity, the market is being manipulated by strong money. Within Wyckoff's theory, these are typically climax an

Introducing FX Zone Custom Time OHLC Candle - Your Effortless Solution for 1-Minute Chart Analysis! Unleash the Power of Precision with Simplicity! Are you tired of complex indicators that clutter your charts? Meet FX Zone Custom Time OHLC Candle, a user-friendly tool designed for traders who value simplicity and precision in their 1-minute chart analysis. Key Features: Easy and Intuitive: Navigate effortlessly with a clean interface, making chart analysis a breeze. Custom Time OHLC

Introducing the Ultimate Custom Time Range Indicator: Unlock Precision in Your Trading Strategies! Versatile Applications: Ideal for kill zones, trading sessions, and time macro analysis, silver bullet timings. You can have as many time ranges as you need to help identify the highest to lowest range within the specified start to end broker time. Note: most brokers operate in GMT +3 - so please convert and use your own broker time.

The Price Spectrum indicator reveals opportunities for detailed market analysis. Advantages: Market Volume Profile Creation : The indicator assists in analyzing the dynamics of trading volumes in the market. This allows traders to identify crucial support and resistance levels, as well as determine market structure. Filtering Insignificant Volumes : Using the indicator helps filter out insignificant volumes, enabling traders to focus on more significant market movements. Flexible Configuration S

Fibonacci Master Pro is an advanced Fibonacci projection indicator designed to optimize your trading strategies. It incorporates the principles of Fibonacci technical analysis, providing precise projections and entry and exit opportunities in the market.
Fibonacci Master Pro draws upward and downward Fibonnaci Projections based on the maximum and minimum value of the candle you specify.
Key Features :
**Accurate Projections:** Using sophisticated algorithms, Fibonacci Master Pro calc
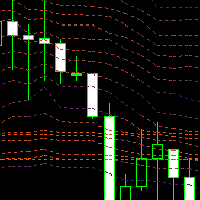
Market Profile, Volume Profile? Extra paid in TradingView, displayed for the last moment in time or discreetly, e.g. after 24 hours. Counting super-accurate values from a histogram...?
None of these ways suited me. I was looking for an expression of the dynamics of the market, its liquidity, I just wanted to clearly see where the money was flowing. I thought I would calculate the volume weighted price percentiles for a certain period.
To make the calculation more accurate, I calculate from a l

Hello, In this indicator, I started with a simple moving average crossover algorithm. However, in order ot get more succesfull results, I created different scenarios by basin the intersections and aptimized values of the moving averages on opening, closing, high and low values. I am presenting you with the most stable version of the moving averages that you have probably seen in any environment. We added a bit of volume into it. In my opinion, adding the Bollinger Band indicator from the ready-

An extended version of the indicator for visualizing the time ranges of key trading sessions: Asian, European and American. The main advantage of this indicator is the automatic construction of a price profile for a trading session. The indicator has the functionality to set the start and end time of each trading session, as well as automatically determine the time zone of the trading server. The indicators include the ability to work with minimal CPU usage and save RAM. In addition, the option

Description: Unlock the power of precise trading with our Dynamic Support and Resistance Indicator for MetaTrader 5. Designed for both novice and experienced traders, this sophisticated tool offers an unparalleled edge in identifying key price levels in the market. Key Features: Customizable Lines : Easily set up to 5 support and 5 resistance lines. Customize them according to your trading strategy, whether for short-term scalping or long-term trend following. User-Friendly Inputs : Adjust the p

All about time and price by ICT. This indicator provides a comprehensive view of ICT killzones, Silver Bullet times, and ICT Macros, enhancing your trading experience. In those time windows price either seeks liquidity or imbalances and you often find the most energetic price moves and turning points. Features: Automatic Adaptation: The ICT killzones intelligently adapt to the specific chart you are using. For Forex charts, it follows the ICT Forex times: In EST timezone: Session: Asia: 20h00-0

Cobra Pivot Points は、最適化されたピボット ポイントをプロットするためのインジケーターであり、デモをダウンロードすることで自分でバックテストできます。
1. 2 つの最適なピボット モードを選択します: Cobra ピボットまたは Camrilla ピボット
2. D1 に限定されず、任意の時間枠を使用できます。
3. Shiftパラメータを使用して、前日の高値安値終値を操作できます。 1 = 前のバー、2 = 前のバーなど。これらのパラメーターは、ピボットの研究開発に役立ちます。
4. レベルがタッチされると、アラート、電子メール、またはプッシュ通知が送信されます。 レベルに達すると、ピボット レベルは緩和されたとみなされ、再度警告されなくなります。 再度アラートが必要な場合は、時間枠を変更してアラートをリセットする必要があります。
5. 線の色、線のスタイル、線の幅、文字の色、フォントを完全にカスタマイズします。
コブラピボットは、LZone (スキャルピングに非常に近いレベル)、NZone (市場が統合しているとき)、H
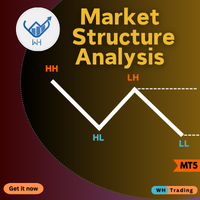
Are you tired of missing crucial market movements? Do you wish for a tool that not only identifies swing points but also provides insights into price action movements?
Look no further – our Market Structure Analysis indicator is here to revolutionize the way you analyze markets on MQL5! MT4 Version : WH Market Structure Analysis MT4 Key Features:
Swing Point Detection: Our indicator excels at identifying significant swing points in the market, helping you understand key turning points with
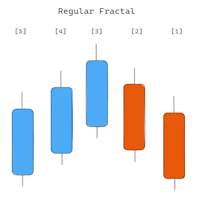
インジケーターは、より高い時間枠からのフラクタルを示します。 「通常フラクタル」と「BWフラクタル」の2種類のフラクタルを表示することができます。 フラクタル「UP」の形成を考えてみましょう。 「通常のフラクタル」は、後続の「高値」価格 (中央のバーの左右) がそれぞれ小さくなる、非常に厳密なフラクタルです。一方、「BW フラクタル」の条件は 1 つだけです。中央のバー (価格が「高い」) が最高でなければなりません。これら 2 つのモードの違いを図 1 に視覚的に示します。 「上位タイムフレーム」パラメータは現在のパラメータより大きくする必要があります。この要件が満たされていない場合、エラーの説明を含むアラートが表示され、インジケーターは機能しません。また、最適化のため、検索は新しいバーに対してのみ実行されます。 また、「履歴の強制ダウンロード」オプションも無視できません。このオプションは週末に効果的です。長い時間枠の履歴を強制的にダウンロードします。

Right hand очень точно воспроизводит колебания цены. Когда рынок растет, кривая Right hand идет вверх. Хотя иногда бывает так, что кривая идет вверх, в то время как цена консолидируется и нет тренда вверх. Аналогично, когда рынок падает, кривая тоже убивает, исключения возникают так же в зоне консолидация рынка. Анализ большого количества графиков Индекса Направленнрго Тренда ( DTI )позволяет выявить его специальные характеристики, полезные при отслеживании тренда. В положительной области т.е

移動平均線の傾斜角度をラベルに表示するだけのシンプルなインジケーターです。ラベルのフォントサイズ、色の調整、移動平均線の設定など全て行えます。また、移動平均線の傾斜角度というものは、MT5のウインドウサイズを変更すると、移動平均線自体の傾斜角度も変更されてしまうことをご了承ください。これは、インジケーターの仕様ではなく、移動平均線の傾斜角度というもの自体の仕様です。
また、MT5には、OnCalculateから値を取得してしまうと、インジケーターを削除する際にオブジェクトが残ってしまうという公式のバグが存在します。その為、当インジケーターでは、OnCalculateから移動平均線の傾斜角度の値を取得し、それを、OnTimer関数で1秒毎に評価し、オブジェクトに傾斜角度を出力しております。なので、傾斜角度の出力レベルはほぼティック毎と変わりませんことをご理解下さい。
また、今後のアップデートで、時間足毎に移動平均線の傾斜角度を評価できるようアップデートして参ります。

The "ZScore Quantum Edge" is based on an advanced algorithm that combines volume analysis and price movement, providing a clear and accurate representation of market trends. Key Features: In-Depth Trend Analysis : The indicator uses a configurable period for trend analysis, allowing traders to adjust the indicator's sensitivity according to their trading strategies. Data Smoothing : With an adjustable range for data smoothing, the "ZScore Quantum Edge" offers a clearer view of the market, minimi

Operating Principle: The "RSDForce" merges trading volume analysis and price movements to provide valuable market insights. Here's how it works: Volume and Price Analysis : The indicator examines the trading volume (quantity of traded assets) and price variations over time. Market Force Calculation : It calculates a value that reflects the market's 'force', indicating whether the price trend is strong and based on substantial trading volume. Simple Visualization : The result is displayed as a li

"Introducing Dynamic Supply and demand Pro – Your Ultimate Supply and Demand Trading Companion! Unleash the power of precision with this advanced indicator designed for traders seeking unparalleled market insights. Dynamic Supply and demand Pro dynamically identifies key reversal zones, showcasing the delicate dance between supply and demand forces.
This cutting-edge tool provides a comprehensive view of the market, highlighting potential turning points with pinpoint accuracy. Witness the ebb
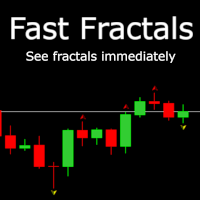
Info: It's like built in Fractals indicator but faster. Usually it shows the signal after 2 bars but FastFractals indicator shows signals immediately and that's is incredible. You can create scalp strategies with it or trade yourself. This indicator uses neural network to analyze price graph and predict. It was trained on 4 hours interval on EURUSD pair, but you can use it with different periods and instruments. There is only one minus in this indicator, it hasn't got 100% accuracy. See pictures

Tatino Super Signals is Non Repaint Indicator for Binary Option trading and Forex trading. Recommendations:
Timeframe: All timeframes. For best results we recommend using it on M1, M5 and M15 timeframes. Currency pairs: All Pairs Account type: All Type Broker time: Any Brokers : Alls Binary Trading : Expired 1 Candle Buffer Buy=1, Sell=0, Entry Next Candle Recommended Forex trading stop loss : 15 pips Recommended Forex tradingTake profit levels : 15 pips
Specifications:
Does not repaint

RFX5 Bull Bear Powers indicator shows the absolute power of bulls and bears controlling the market. Both powers are shown simultaneously with red and green colors for bear and bull powers respectively. When red line goes over the green line it means that bears are controlling the market. When green line goes over the red line it means that bulls are controlling the market. The green/red horizontal symbol line at the bottom of the indicators shows which party has more strength. Time Frame: M3
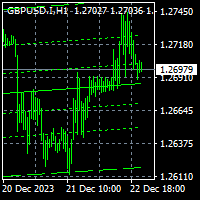
To get access to MT4 version click here . This is the exact conversion from TradingView: "Linear Regression Channel" by "LonesomeTheBlue". This is a repaint indicator. Buffers are not available for processing. You need to parse objects on chart. All input fields are available. You can message in private chat for further changes you need. Thanks for downloading
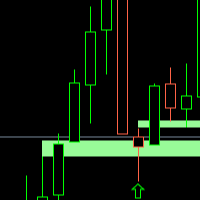
FVG WATCHER is an indicator that helps traders identify fair value gaps in the market. The indicator draws fair value gaps and alerts the user when the fair value gap has been swept. It allows users to specify how it should be swept, what time range to alert, and the size of the fair value gap to alert. It also allows the user to apply a moving average trend filter for better choice of alerts. The indicator also allows push mobile notifications. What makes FVG Watcher special is that it can be

The PUA MultiType Pivot indicator is built on the daily chart of the previous day. The PUA MultiType Pivot indicator is one of the most popular tools in technical analysis, used by traders to identify potential reversal points in financial markets. This indicator constructs three types of Pivot points: Classic, Fibonacci, and Camarilla, each offering its unique approach to market analysis. The advantages of this indicator include: Simplicity and Clarity PUA MultiType Pivot provides clearly defi
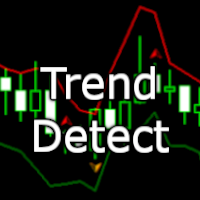
Trend change detector is an indicator for Metatrader 5.It can help you determine the change in a local trend to open a correct position. It has 2 parameters. Period and mistake offset percent. You can change the period parameter to capture little changes in trend. There are two lines: the red one and the green one. You can use them as a local support and resistance level. Arrows show the change in a trend. Up arrow the price will go down and Down arrow the price will go up. Also, by changing m
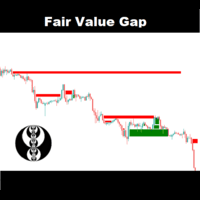
The FairValueGap indicator finds market imbalances which suggest that buying and selling are not equal. Fair value gaps are a very useful concept in price action trading, as they provide a trader with information about where a lot of volatility is in the market which makes having the FairValueGap indicator a must
Check out: Break of structure Features Has a filter for filtering out FVG zones with less volatility Multiple currency pairs supported Very easy to use and very customizable Inpu

Created by imjesstwoone and mickey1984, this trade model attempts to capture the expansion from the 10:00-14:00 EST 4h candle using just 3 simple steps. All of the information presented in this description has been outlined by its creators, all I did was translate it to MQL5. All core settings of the trade model may be edited so that users can test several variations, however this description will cover its default, intended behavior using NQ 5m as an example. Step 1 is to identify our Price Ra

AIサポート耐性 「サポートライン」と「レジスタンスライン」を探るインジケーターです。検索は数値解析とデータ処理のアルゴリズムを使用して実行されます。 利用可能な検索オプションは 3 つあります (「モード #1」、「モード #2」、「モード #3」)。これらの各オプションは、内部アルゴリズムが異なります (現時点では、これらは完全に内部設定であり、ユーザーは使用できません)。これらのオプションは検索の重大度が異なると言えます。 制限事項: 現時点では、インジケーターには特定の最小数のバーが必要です。バーが十分でない場合は、インジケーターを探してください。 リソースの節約: 再計算が頻繁に行われず、コンピューターの計算能力に過負荷がかからないように、インジケーターは 30 バーごとに 1 回検索します。 ライン名: 行名には「sup_」または「res_」が付きます。時間枠と内部行番号もあります。

Liquidity Pro The Liquidity Pro pin points liquidity zones in any financial instrument, including currency pairs, cryptocurrencies, commodities, equities and indices. The Liquidity Pro shows previous and current liquidity zones, down to the present minute, providing essential information about your chosen trading pair, when conducting chart analysis or initiating trades. The Liquidity Pro allows you to observe where price consolidates, retraces, resists, or settles within support areas. It pinp
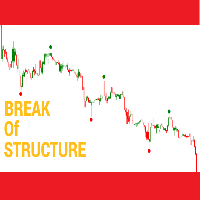
The indicator simplifies the hustle of trying to find market highs and lows. The indicator uses a method called break of structure - a break of structure is simply the process of forming a higher high on an uptrend without first creating a lower low and a lower low on a downtrend without first developing a higher high in other words a break of structure is a change in price behavior and signals a shift in market momentum. That being said the indicator is the ace card every trader should have.

Overview:
The Custom_Timeframe_MAs indicator for MetaTrader 5 lets you study different timeframes using M1 candles. It offers 12 moving average methods for analyzing trends. Why It's Useful: Versatile Timeframes: Even though MetaTrader has fewer timeframes, this indicator expands options by using M1 candles. Various Moving Averages: Choose from 12 moving average types: SMA, EMA, DEMA,TEMA,WMA, VWMA,SMMA, HullMA, LSMA, ALMA, SSMA, TMA, to understand price movements better. For Automated Tradi

El indicador Global Average es una media móvil que difiere significativamente de las medias móviles tradicionales. Su función principal es proporcionar un precio objetivo de take profit que sirve como referencia para la estrategia de regresión a la media. Este manual detallará la estrategia de Venta/Compra basada en este indicador, que implica medir el primer impulso del precio despues de romper la media del indicador, luego avanzar con el nivel de Global Average , y vender/comprar cuando el pre

The BS Vwap 5 Bands indicator is an advanced tool that integrates price and volume data, providing a comprehensive view of market dynamics. Designed with a focus on performance and tested under real trading conditions, this indicator aims to deliver valuable insights to traders. Its innovative approach combines VWAP with five distinct bands, revealing whether the price is aligned with the "fair price" and indicating overbought or oversold conditions. Additionally, the indicator offers visual cus
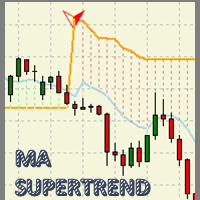
MA Super Trend MT5 An indicator based on the average maximum and minimum of a candle period, and next to the average true range (ATR) result in a powerful visual work tool to optimize the trend zones and potential areas of market entry. With great adaptability in any type of financial asset and with a potential for visual simplification in the graph, which will make the graph a simple work table. An indicator created to measure: - For MT5 desktop platform. - Great for Day trading, Swing Trading

Murrey Math Line X MetaTrader SYSTEM — a pivot line system that will definitely help every trader who knows how to trade with support, resistance, and pivot lines. It displays 8 primary lines (with 5 more additional ones) on the main chart, helping you to find the best points to sell, buy, and exit your positions. You can download this indicator for MT4 and MT5 platform. Input parameters Period (default = 64) — a period in bars or in other upper timeframe periods (set via the UpperTimeFrame

Market Profile MetaTrader System — is a classic Market Profile implementation that can show the price density over time, outlining the most important price levels, value area, and control value of a given trading session. This indicator can be attached to timeframes between M1 and D1 and will show the Market Profile for daily, weekly, monthly, or even intraday sessions. Lower timeframes offer higher precision. Higher timeframes are recommended for better visibility. It is also possible to use a

The new update makes this indicator a complete tool for studying, analyzing and operating probabilistic patterns. It includes: On-chart Multi-asset percentage monitor. Configurable martingales. Twenty-one pre-configured patterns, including Mhi patterns and C3. An advanced pattern editor to store up to 5 custom patterns. Backtest mode to test results with loss reports. Trend filter. Hit operational filter. Martingale Cycles option. Various types of strategies and alerts. Confluence between patter
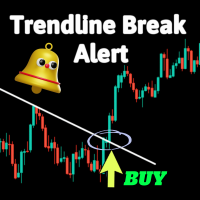
これはトレンドラインのブレイクに関するアラートを提供するシンプルなインジケーターです。
トレードでトレンドラインを使用するのに慣れている場合、役立つことがあります。 調整可能なパラメータには、以下が含まれます:
キャンドル識別子:ブレイク後のどのキャンドルで信号を出すか そして、3種類のアラート: Eメールの送信 聞こえる警告 プッシュ通知
テスト目的のため、トレンドラインの描画をサポートしていないため、MetaTrader 5の戦略テスターの代わりにMetaTrader 4を使用することをお勧めします。
MT4バージョン: https://www.mql5.com/en/market/product/111112?source=Site+Market+My+Products+Page
電話で通知アラートを設定する方法を学ぶために、このビデオをご覧ください:
https://www.youtube.com/watch?v=4oO-3fMQ4QA
インストールガイド:
https://www.mql5.com/en/blogs/post/739828

Gold Levels MTF - this is a fine stock technical indicator. The indicator algorithm analyzes the movement of the asset price, displays price levels of support and resistance from all time frames (TF) using the Murray method based on the Gann theory. The indicator indicates overbought and oversold fields, giving an idea of possible reversal points and at the same time giving some idea of the strength of the current trend.
Description of levels: (Extreme Overshoot) - these levels are the ultimat

The MasterOBV indicator is a powerful technical analysis tool that utilizes volume, positive correlation, and a Moving Average (MA) to enhance trend identification in financial markets. By incorporating assets with positive correlation through the indicator menu, MasterOBV provides a refined approach to assessing the strength and direction of trends. The inclusion of the Moving Average adds additional smoothing to price movements, aiding in a more accurate tracking of the underlying trend over

Exclusive Limited Time Offer! Grab this useful indicator for a lifetime at just $49. Volatility indicator dashboard designed to revolutionize how traders perceive and navigate market volatility. Track volatile for multiple currency pairs one at time for multiple timeframes. Works best with Forex Market, Gold, Silver, Oil. Available in MT4, MT5. Indicator Features: Multi-Symbol, Multi-Timeframe Dashboard: Gain a strategic advantage by simultaneously monitoring volatility across various currenc

The GGP Trendlines with Breaks Alert MT5 Indicator is a technical analysis tool that can assist investors in identifying market trends. The indicator returns pivot point based trendlines with highlighted breakouts. Users can control the steepness of the trendlines as well as their slope calculation method. This indicator is MT5 conversion of the Trendlines with Breaks Indicator by “ LuxAlgo “ in Trading View website and some alert methods are added to provide real-time alerts when a trading sign
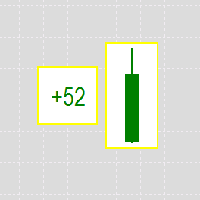
This Indicator shows the trend of movement. If the candle is red, you need to look for Buy signals. If the candle is Red, then look for a Sell signal.
The indicator is especially suitable for scalping.
When trading, take into account risk management.
For trading, I recommend the timeframe M5 M30
Good luck to all ))
If you have any questions, please contact us at +77767238899
Email dilshodaka25@gmail.com

The GGP Chandelier Exit Alert MT5 Indicator is a volatility-based indicator that identifies stop loss exit points for long and short trading positions. Chandelier Exit is based on the Average True Range (ATR) indicator. It is designed to keep traders in the trend until a defined trend reversal happens. Traders use CE to maximize their returns in a trade and make stop loss exit decisions. It is based on the principle that a trend reversal is highly probable when the price of an asset moves agains

GIVE A LOOK TO MY OTHER PRODUCTS ! 100 % PER MONTH PROFIT---- MY NEW SIGNAL HERE -------> https://www.mql5.com/en/signals/2162238?source=Site+Signals+My# Smoothed MA cross alert,is a cool indicator that notificate you directly on your telephone or email when 2 Smoothed Moving average ( you choose the parameters ) crosses. This is very important when you want to know a change of trend and you can't stay in front of your pc! The indicator give you the alert just when the next bar opens ,so give

Introducing our groundbreaking indicator designed to elevate your trading strategy! Unlock the power of precise volume analysis with Buy, Sell, and Neutral indicators. Tailor your approach with customizable levels based on timeframes and moving average methods.
Key Features: Dynamic Volume Insights Instantly identify Buy, Sell, and Neutral volumes for informed trading decisions. Gain clarity on market sentiment like never before. Adaptable Level Configuration Customize and adapt levels to matc

Introducing our cutting-edge product, an innovative MACD Oscillator with a dynamic level enhanced by a decimal point Moving Average (MA) also with the versatility of multiple moving average modes. This advanced trading tool brings precision and flexibility to your technical analysis, offering a seamless experience for traders seeking a competitive edge in the financial markets.
Key Features: Dynamic Level Precision Our MACD Oscillator is equipped with a dynamic level feature, providing traders

Chart Clarity Dashboard
The Chart Clarity Dashboard provides clear insights into price movements for various financial instruments like currency pairs, cryptocurrencies, equities, commodities, and indices. This dashboard displays detailed price information in real-time, making it easier for traders to make decisions quickly. It shows price movements down to the second, giving you essential data before you trade or analyze charts. Chart Clarity Dashboard allows you to monitor price changes acr

Volume Clarity Pro The Volume Clarity Pro provides clarity in the movement of price for any financial instrument, including currency pairs, cryptocurrencies, equities, commodities and indices. The Volume Clarity Pro maps out where price is consolidating, retracing, resisting or settled in areas of support. The Volume Clarity Pro accurately displays the month's price action, offering crucial data about your selected trading pair for chart analysis and trade initiation. The Volume Clarity Pro is

Introducing our revolutionary intra-day trading indicator, meticulously crafted to optimize your trading insights within the 24-hour market cycle. Immerse yourself in historical data with precision using two distinctive modes - "All History" and "Last X Hours."
Key Features: All History Mode Uncover a comprehensive view of the day's dynamics. Instantly analyze the preceding day's high and low, 50% mid-point, and the open versus close price for the current day. Decode critical patterns to infor

Wave Anatomy Visit: http://www.trafethevolumewaves.com for more information Construct your own 5 Waves and analyze the price movements stages: Easy Movement Hard time to move Fast move This indicator is based on Wyckoff’s, David’s Weis and my Speed Index Theory. This indicator will you help analyze what is happening in 5 Price Waves that you can construct yourself. This tool is designed for scalpers and swing traders and will help them to analyze any wave on any timeframe at the same time. Fur

Gobbo è un indicatore professionale che evidenzia il trend del mercato con un aspetto grafico chiaro e comprensibile, è basato sulla Moving Average e può essere impostato su qualsiasi periodo di intervallo, di default impostato sul periodo 14, scegliendo un periodo più alto evidenzierà meno cambi di tendenza per un approccio sul medio o lungo periodo, con un periodo più basso più cambi di tendenza per un approccio sul breve termine L'aggiornamento e l'adattamento al time frame scelto avviene in

"QuantumEdge FairValueGap Pro" - The Ultimate Trading Edge!
Elevate your trading experience with the QuantumEdge FairValueGap Pro, your all-in-one solution for unparalleled market insights and precision trading. This cutting-edge indicator brings quantum-level analysis to your fingertips, empowering you with advanced tools to navigate the financial markets.
Key Features:
1️⃣ FairValue Precision: Gain a quantum-edge perspective on market fairness, with a focus on pinpointing the mos

黄金パターンは、フィボナッチ数列の黄金比に基づいた 3 本のローソク足の構成です。
黄金比は1.618です。 その変動には、0.618、2.618、および 3.618 が含まれます。 このインジケーターでは、2.618 で最高の結果が得られます。
ゴールデン パターンは通常のローソク足とそれに続く大きなローソク足で構成され、終値は最初のローソク足の少なくとも 2.618 倍になります。
強気のゴールデンパターンは強気のローソク足で作られているのに対し、弱気のゴールデンパターンは弱気のローソク足で作られています。
シグナルに加えて、推奨されるエントリーラインが青い線として描かれ、最後の 2 本のローソク足に広がります。
そのパラメータは次のとおりです。
フィボナッチ比率 (0.618、1.618、2.618、3.618 など) 上記のシグナルの Wingdings コード、つまり弱気シグナル (スクリーンショットの Wingdings テーブルを参照) 上の信号の色 (弱気) 以下のシグナルの Wingdings コード、つまり強気シグナ

The Liquidation Estimates (Real-Time) experimental indicator attempts to highlight real-time long and short liquidations on all timeframes. Here with liquidations, we refer to the process of forcibly closing a trader's position in the market.
By analyzing liquidation data, traders can gauge market sentiment, identify potential support and resistance levels, identify potential trend reversals, and make informed decisions about entry and exit points.
USAGE (Img 1) Liquidation refer

Vision è un indicatore professionale che legge i dati storici del periodo impostato e in base a tali elabora una previsione scrivendo l'andamento sul grafico, l'impatto visivo eccellente rende chiaro l'andamento del prossimo trend e mette a fuoco il prezzo d'ingresso il posizionamento di ordini e la distanza per SL e TP, di default è impostato con un rapporto bilanciato 24 a 24 ciò significa che in base alle ultime 24 candele prevederà scrivendo sul grafico l'andamento delle 24 candele successi

Liquidity Finder The Liquidity Finder pin points liquidity zones in any financial instrument, including currency pairs, cryptocurrencies, commodities and indices. The Liquidity finder shows previous and current liquidity zones, down to the present minute, providing essential information about your chosen trading pair, when conducting chart analysis or initiating trades. The Liquidity Finder allows you to observe where price consolidates, retraces, resists, or settles within support areas. It pi

ジュリック・アドバンストMA(JurMA)は、マーク・ジュリックが考案した オリジナルのJMAをベースに開発されたノンリペイントのテクニカル 指標です。
従来の移動平均線に見られるラグを減らし、平滑性を向上させ、ノイズを減らすように設計されています。JurMAは市場のボラティリティに適応し、ユーザーが感度を微調整できるため、金融市場のトレンドや反転を見極めるのに役立ちます。この適応性と効率性により、トレーダーやアナリストの間で人気があります。
他のテクニカル・インディケータの広い文脈では、「感度」とは、価格データの変 化に対してインディケータがどれだけ速く反応するかを意味します。ローソク足の本数ではなく、インジケータが一定期間の値動きをどのように解釈するか(反応性の大小)を意味します。JurMAは、このインジケータの動作、特に「移行プロセスの質」を調整するために、PHASE機能パラメータを提供しています。PHASEは線の "滑らかさ "とは関係なく、平均計算におけるJarikの公式と直接相互作用する方法であることを理解することが重要です(ノイズをフィルタリングするのに適してい

TrendOnCloseは、特定のローソク足サイクル内のトレンドとカウンター トレンドの統計分析に焦点を当てた、バイナリー市場投資家向けの高度 なインディケータです。
各サイクル は、ローソク足の終値によって定義され、次のサイクルが始まるまでの間、トレン ド方向(UP/DOWN - BULL/BEAR)を確立します。統計分析は2つの構成で行われます:
⦁ SUBSEQUENT CANDLEとしての統計目標: アルゴリズムは、サイクル内の後続のローソク足に焦点を当てます。
⦁ INTERCYCLESとしての統計ゴール: アルゴリズムは、各サイクル間のすべてのローソク足を考慮する。 選択された統計目標に基づき、各ローソク足のトレンドがCYCLEローソク足のトレンドと比較され、同一方向の場合はTREND-Percent(TD)とTrend-Occurrences(N-TD)が増加し、トレンドが乖離している場合はCOUNTER-TREND(CTとN-CT)が増加します。さらに、このインジケータは、日足、週足、月足の統計的な合計を提供し、これらの期間中、各サイクル の「トレンド」ま

Простой индикатор тренда в NRTR виде с отрисовкой линий стоплосса и тейпрофита, цвет и направление движения которых определяются действующим трендом. Индикатор имеет возможность подавать алерты, отправлять почтовые сообщения и push-сигналы при смене направления тренда. Следует учесть что значение входного параметра индикатора Deviation of the take profit line in points для каждого финансового актива на каждом таймфрейме необходимо подбирать индивидуально!

HAshi-EはHeiken-Ashiシグナルを分析する強化された方法です。
説明
HAshi-Eは、Heiken-Ashiシグナルを分析するための強化された方法です。HAshi-Eは、Heiken-Ashiシグナルを分析するための強化された方法です。HAshi-Eは、Heiken-Ashiシグナルを分析するための強化された方法です。伝統的なローソク足チャートとは異なり、ヒーケンアシのローソク足は過去のバーの平均値を使って計算されるため、よりスムーズで解釈しやすい視覚的表現が可能です。
その主な利点は、ほとんどの人が本来の読み方をしない理由でもあります。Heiken-Ashiローソク足には平均値に関する情報が含まれており、通常、資産ローソク足の前に配置されているため、色や形に惑わされ、不適切な時間帯や遅い時間帯にエントリーやエグジットを行う人をよく見かける。
HAshi-Eは、伝統的なHeiken-Ashiインジケータの改良版です! HAshi-E(チャート版)の特徴: 同じデータを異なる角度から見る HAshi-Eは、伝統的なHeiken-Ashiローソク足だけでな
" Base Market Signals " A powerful and innovative technical analysis indicator designed to revolutionize your trading experience. Engineered by Southern Star Trading, this indicator is your key to unlocking profitable market insights in the ever-changing world of financial markets.
Key Features:
1. Dynamic Signal Detection: Base Market Signals employs sophisticated algorithms to dynamically identify potential trend reversal points, providing you with timely and accurate signals.
2. Versat

Introducing the Engulfing Goddess Metatrader 5 (MT5) Indicator , a revolutionary tool designed for traders who seek to harness the power of candlestick patterns in their trading strategy. This indicator is built on the principles of engulfing candlestick patterns , a popular method used by successful traders worldwide. Our Engulfing Goddess Indicator stands out with its ability to detect various kinds of engulfing patterns . It employs a range of filters, providing you with a comprehensive anal

Designed by Welles Wilder for daily commodity charts, the ADXW is now used in various markets by technical traders to assess the strength of a trend or even a trend for short- or long-term trades.
The ADXW uses a positive (DI+) and negative (DI-) directional indicator in addition to its trend line (ADX).
According to Wilder, a trend has strength when the ADX signal is above 25; the trend is weak (or the price has no trend) when the ADX is below 20. The absence of a trend does not mean that

オンバランス・ボリューム(OBV)は、出来高と価格を関連付け、値動きを識別するテクニカル指標です。OBVの基本的な考え方は、出来高の変化は一般に価格の変化に先行するというものである。OBVは、価格が高値で引けた期間の出来高を累積し、安値で引けた期間の 出来高を減算する。こ の 結 果 、資 産 の ト レ ン ド の 方 向 を 示 す 数 値 が 得 ら れ る 。
OBVの解釈は簡単です。OBVの上昇は、買い手が市場に参入または留まろうとしていることを示唆し、上昇トレンドのシグナルとなります。一方、OBVが低下している場合は、売り手が優勢であることを示し、下降トレンドの可能性を示唆します。
現在、シグナルに最大3つの移動平均を使用することができ、取引判断プロセスを簡素化することができます。OBVがMAラインと交差していることと、その間の距離を観察するだけです。これがOBV-MAの目的です!
OBV線がMA線と交差し、MA線とOBV線が大きく離れている場合、上昇トレンドまたは下降トレンドの強い兆候を示します。もう一つの良いトレンドシグナルは、すべての線(OBV線とMA線

テクニカル分析の領域では、ParbMAはParabolic SARのトレンドを調査するための非常に直感的なツールとして浮かび上がります。この革新的なアプローチは、カスタマイズ可能なラインを活用し、その色、形状、幅のオプションにおいてその汎用性が際立っています。この柔軟性により、視覚的な分析が向上し、戦略の立案や意思決定に大きく役立ちます。
ParbMA(Parabolic Moving Average)は、J. Welles WilderのParabolic SAR(Stop and Reverse)と移動平均の概念を組み合わせたカスタムの技術指標です。このハイブリッド指標は、これらの手法の利点を捉え、金融市場における価格トレンドと潜在的な反転ポイントを追跡する独自の方法をトレーダーに提供することを目的としています。
ParbMAの主な特徴
カスタマイズ可能な視覚的表現: ParbMAの中心には、ラインを通じてトレンドを表現する能力があります。ユーザーはこのラインを好みに合わせて、様々な色、形状、幅から選択することができます。このカスタマイズのレベルにより、トレンドの表現

Uncover high-probability opportunities in trending markets with the Brilliant Entries Indicator. Its clear visual signals can be followed and incorporated with market structure to provide you with accurate entries. Give it a try and gain an edge in your trading strategy.
It can be used on it's own but i highly recommend to used it as part of a wider strategy to provide you with confluence.
It works on all timeframes but will work very good doing market structure 2 x timeframes higher and t
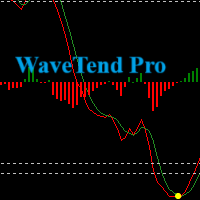
Introducing our Wave Trend Oscillator Indicator , exclusively designed for MetaTrader 5 . This advanced tool is a must-have for traders who seek precision and efficiency in their trading journey. Our oscillator is built on the principles of wave trend analysis , capturing the ebb and flow of market trends with unparalleled accuracy. It helps traders identify potential buying and selling points based on market wave patterns, enabling you to stay ahead of the market. One of the key features of ou
MetaTraderマーケットは、開発者がトレーディングアプリを販売するシンプルで便利なサイトです。
プロダクトを投稿するのをお手伝いし、マーケットのためにプロダクト記載を準備する方法を説明します。マーケットのすべてのアプリは暗号化によって守られ、購入者のコンピュータでしか動作しません。違法なコピーは不可能です。
取引の機会を逃しています。
- 無料取引アプリ
- 8千を超えるシグナルをコピー
- 金融ニュースで金融マーケットを探索
新規登録
ログイン