YouTubeにあるマーケットチュートリアルビデオをご覧ください
ロボットや指標を購入する
仮想ホスティングで
EAを実行
EAを実行
ロボットや指標を購入前にテストする
マーケットで収入を得る
販売のためにプロダクトをプレゼンテーションする方法
MetaTrader 5のための有料のテクニカル指標 - 24

1. Why did I develop this series of indicators
I found that most traders need to use multiple time frame indicators. They usually switch time frame to see indicators. However, once the timeframe is switched, you cannot see the corresponding relationship between the price in the smaller timeframe and the indicator in the larger timeframe . For example: if your price chart is in H1 timeframe, you can see H4, D1 and W1 indicators in H1 timeframe Chart. This is more helpful for you to find t



Just $10 for six months!!! Displays previous weeks Highs & Lows. You can set the number of weeks to display levels for, also the line style, color and width. This is very useful for traders using the BTMM and other methods like ICT. I'll be creating more indicators for MT5 for the BTMM. Send me your suggestions to my Telegram: https://t.me/JDelgadoCR Take a look at my other products at: https://www.mql5.com/en/users/jdelgadocr/seller

Just $10 for six months!!! Displays previous days Highs & Lows. You can set the number of days to display levels for, also the line style, color and width. This is very useful for traders using the BTMM and other methods like ICT. I'll be creating more indicators for MT5 for the BTMM. Send me your suggestions to my Telegram: https://t.me/JDelgadoCR Take a look at my other products at: https://www.mql5.com/en/users/jdelgadocr/seller
Unique trend trading algorithm with advanced filtering and many features which should become a part of your trading arsenal. This indicator can give you also trading advisors (with take profit target), success rate scanner and much more.
Important information
For additional detailed information you can visit the 747Developments website.
Features Easy to use (just drag and drop to the chart) Possible to use with any trading instrument Possible to use on any time-frame Take profit advisors S

This indicator is based on the ICCI.
If a long pattern is detected, the indicator displays a buy arrow.
If a short pattern is detected, the indicator displays a sell arrow. Settings
CCI Period - default set to (14) Features
Works on all currency pairs and timeframes
Draws Arrows on chart Colors
Line Color
Line Width
Line Style
Arrow Color This tool can help you analyse the market and indicates market entry.

Ondas de Divergência. Antes do mercado tomar um sentido e se manter em tendencia, existem sinais que podem ser lidos, nos permitindo assim entender o "lado mas forte", e realizar trades de maior probabilidade de acerto com risco reduzido, esses movimentos são persistentes e contínuos, proporcionando excelente rentabilidade. Ondas de Divergência é um histograma que acumula a divergência de entre preço e volume a cada tick, permitindo assim encontrar pontos de absorção, áreas de acumulo e distrib
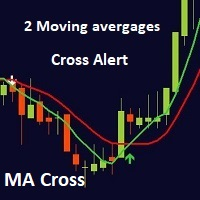
MA cross ALERT MT5 This indicator is a full 2 moving averages cross Alert ( email and push notification "mobile" ), 2 MA with full control of MA method and applied price for each moving average "slow and fast", -simple, exponential, smoothed, linear weighted. - close, open, high, low, median price, typical price, weighted price. you can modify periods as well for both MA. For any suggestions don't hesitate, thanks

The indicator shows: Average ATR over a selected number of periods Passed ATR for the current period (specified for calculating ATR)
Remaining ATR for the current period (specified for calculating ATR) Remaining time before closing the current candle Spread The price of one item per lot The settings indicate: Timeframe for calculating ATR (depends on your trading strategy) Number of periods for calculating ATR The angle of the chart window to display Horizontal Offset Vertical Offset Font size
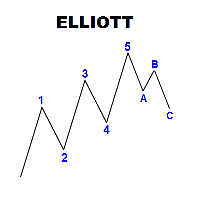
Panel with a set of labels for marking the Elliott wave structure. The panel is called up by the Q key, if you press twice, you can move the panel according to the schedule. The panel consists of seven rows, three colored buttons, each of which creates 5 or 3 labels of wave marking. Correction, consist of 3 tags, or five with a shift, you can break the chain of tags when installed by pressing the Esc key The optimal font for labels is Ewapro, which can be downloaded from a permanent link in the

THE GOAT INDICATOR ON THE MQL5 MARKET! ️ GET THIS INDICATOR AND STOP LOOKING FOR ANOTHER INDICATOR ️ ️ GET IT NOW BEFORE PRICE INCREASE! ️ SPECIAL DISCOUNT FROM 138$ -> NOW ONLY 88$!!! 2020 Breakthrough Indicator! Imagine that indicators can move the price/market! This indicator use for predict price movement! Using special algorithm for predicting the next price movement! This indicator can be used in any timeframes and any symbols! You can use it for binary option signal

Probably almost every trader at least once, but dreamed about non-lagging MAs. I embodied this dream in my indicator. Using this indicator, you can predict future values. But the main application of the indicator is to generate buy and sell signals.
Determining the market trend is an important task for traders. The Trendometer indicator implements an advanced algorithm for visualizing the market trend. The main purpose of the indicator is to assess the market. The indicator is designed to ide
this indicator works on all pairs of Binary.com. we recommend using it on the M5 and M15 timeframe. when a blue arrow appears you must take the purchase and red you sell. you will withdraw your profit at the next resistance or support zone. please use risk management. its very important! without this, you can't make money on long term. if there any question ask it.

The indicator allows you to simplify the interpretation of signals produced by the classical MACD indicator.
It is based on the double-smoothed rate of change (ROC).
Bollinger Bands is made from EMA line.
The indicator is a logical continuation of the series of indicators using this classical and efficient technical indicator.
The strength of the trend is determined by Bands and main line.
If the bands width are smaller than the specified value, judge it as suqueeze and do not recommen
DSeize
DSeize - это индикатор для совершения покупки/продажи в MetaTrader 5. Простой и понятный индикатор, показывающий точки входа в рынок. Прекрасно подходит как для начинающих, так и для профессиональных трейдеров. Рекомендуемый таймфрейм H1. Рекомендуемые валютные пары: Мультивалютный. Работает как на 4-х, так и на 5-и значных котировках. Сигналы индикатора не перерисовываются. Особенности Вход совершается при закрытии часовой свечи и появлении индикатора.
Сигналы не перерисовываются. С
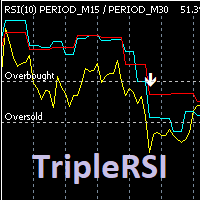
Индикатор отображает на графике данные RSI рабочего и двух старших тайм-фреймов, формирует сигналы выхода из зоны перекупленности / перепроданности кривой среднего временного периода. Опционально используется фильтр по данным старшего тайм-фрейма (расположение медленной линии выше средней для продажи и ниже средней - для покупки). Сигналы "подвального" индикатора дублируются на главном окне, отправляются сообщения во всплывающее окно, на почту и на мобильное устройство. Параметры индикатора: RSI
Pattern Finder 2 is a MULTICURRENCY indicator that scans the entire market seeking for up to 62 candlestick patterns in 15 different pairs/currencies all in one chart. It will help you to make the right decision in the right moment. You can filter the scanning following the trend by a function based on exponential moving average. You can setup parameters by an interface that appears by clicking the arrow that appear on the upperleft part of the window after you place the indicator. Parameters ar

KT Trend Trading Suite is a multi-featured indicator that incorporates a trend following strategy combined with multiple breakout points as the entry signals.
Once a new trend is established, it provides several entry opportunities to ride the established trend successfully. A pullback threshold is used to avoid the less significant entry points.
MT4 Version is available here https://www.mql5.com/en/market/product/46268
Features
It combines several market dynamics into a single equati
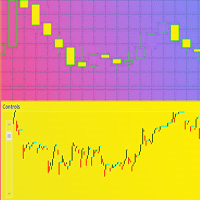
Индикатор для отображения свеч размером меньше одной минуты, вплоть до размера в одну секунду, для детализированного просмотра графика . Имеется ряд необходимых настроек для удобной визуализации. Настройка размера хранения истории ценовых данных транслируемых инструментов. Размер видимых свеч. Настройка отображения неподвижности на курсах графика. Возможность отображения на различных торговых инструментах. Удачной всем торговли.

DYNAMIC SR TREND CHANNEL
Dynamic SR Trend Channel is a simple indicator for trend detection as well as resistance/support levels on the current timeframe. It shows you areas where to expect possible change in trend direction and trend continuation. It works with any trading system (both price action and other trading system that use indicators) and is also very good for renko charting system as well. In an uptrend, the red line (main line) serves as the support and the blue line serves as the

Inspired from, Time is the most important factor in determining market movements and by studying past price records you will be able to prove to yourself history does repeat and by knowing the past you can tell the future. There is a definite relation between price and time. -William Delbert Gann Caution: It's not HolyGrail System, It's a tool to give you insight of current market structure. The decision to trade is made only with combination of economical understanding of underlying instru
Se considera la secuencia de la serie Fibonacci (2,3,5,8,13) que sera multiplicado por un periodo (11 o 33 o 70 etc.), de las 5 lineas se sacara una sola que sera contendrá el máximo y mínimo de las 5, a esta linea se le aplicara un suavizador de 3....y a esta linea suavizada se le volverá a aplicar un suavizador de 3. obteniéndose 2 lineas suavizadas. A simple vista se ve las intersecciones que hacen las lineas que pueden ser usadas para comprar o vender. Cambien se puede usar con apoyo de otro
This indicator improves the "DMI Trend" so that the trend signal reacts faster than before.
---The indicator allows you to simplify the interpretation of signals produced by the classical ADX indicator.
The position of the hight bars of the histogram relative to zero and the histogram coloring indicate the direction of price movement determined by the intersection of DI+ / DI-.
The position of the hight bars of the histogram relative to zero and the color indicate the strength of the pric
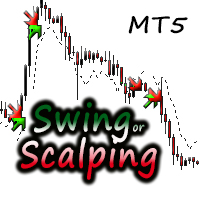
Continuous Coloured dot lines under and above price when conditions are met. Arrows Red and Green for entry Points. User can change the colours of the arrows in the colour section of the indicator. It is consider a great scalping tool on lower time-frames, while higher time frames will have fewer opportunities but trades will possibly last longer. There is an input for Alert on or off. This can be used effectively on M15/M30 Chart until up to H4 chart time. It is best if the user has some

Scaner indicator.
Currency pairs never rise or fall in a straight line. Their rises and falls are alternated by pullbacks and turns. Each growth and each fall is reflected in your emotional state: hope is replaced by fear, and when it passes, hope reappears. The market uses your fear to prevent you from taking a strong position. At such times, you are most vulnerable.
Everything will change if you use the Scaner indicator.
The Scaner indicator was created to neutralize temporary pauses an
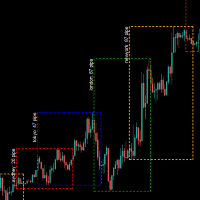
シドニー、東京、ロンドン、ニューヨークを含む外国為替市場時間インジケータ4市場時間各市場でのサーバーの夏時間の切り替えと夏時間の切り替えを考慮
input ENUM_DST_ZONE InpServerDSTChangeRule = DST_ZONE_US; //サーバー側の夏時間切り替えルール
input int InpBackDays = 100; //パフォーマンス上の理由から、最大描画日数
input bool InpShowTextLabel = true; //市場、現在のボラティリティを表示するテキストラベルを表示
input string InpTextColor = clrWhite; //ラベルテキストの色
input int InpTextFontSize = 8; //ラベルのテキストサイズ
input bool InpFillBack = false; //ボックスの背景色が塗りつぶされるかどうか
input bool InpShowStat = false; //各市場の時間変動統計を表示します
input ENUM_LIN
Trend Reversal Indicator This indicator works exceptionally well in the early stages of a trend, detecting its reversal. Trading Recommendations: Signals are generated on the current candle. Entry into a trade is recommended on the next candle. The target profit is set at 20-30 pips. There are three options for setting the stop-loss: Exiting the trade when there is an opposite signal. Placing the stop-loss directly behind the signal. Placing the stop-loss at the nearest high or low. It is adv

reference:
"High Frequency Trading, A Pratical Guide to Algorithmic Strategies and Trading Systems (Aldridge, Irene)"
Characteristics The calculation of VWAP is in accordance with the literature. 4 types of VWAPs, daily, monthly, yearly, moving. Note: Daily is the most popular form, the calculation is performed from the beginning to the end of each trading session (Market benchmark). In the moving, the calculation is carried out from n periods past to the current period, as with the famou

インジケーターは(オプション)を示します:スピアマンの順位相関係数、ピアソンの線形相関係数、ケンドールの順位相関係数、およびフェクナーの符号相関係数。このオシレーターは、価格が買われ過ぎと売られ過ぎのレベルを超えたときに市場が逆転する可能性のあるポイントを示しています。 得られた値をさらにフィルタリングするには、単純、指数、平滑化、線形加重の4つの方法があります。 バーを閉じた後、値は固定され、再描画されません。 Spearman計算を使用すると、既知のSSRCが取得されますが、このインジケーターでは真の係数が計算され、計算結果に平滑化が適用されるため、値の再描画が回避されます。 パラメーター:
Calculation mode/period/price-モード/期間/相関係数を計算するための使用価格 Smoothing period/method-期間/結果値を平滑化する方法
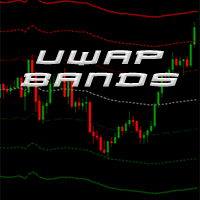
This indicator plots VWAP with 4 Standard Deviation bands. In finance, volume-weighted average price (VWAP) is the ratio of the value traded to total volume traded over a particular time horizon (usually one day). It is a measure of the average price at which a stock is traded over the trading horizon. VWAP is often used as a trading benchmark by investors who aim to be as passive as possible in their execution. Many pension funds, and some mutual funds, fall into this category. The aim of usi
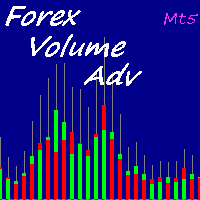
Forex is the most liquid market in the world. For this reason real volumes are not available. Some indicators use the number of ticks, in other cases the broker can supply volumes informations but they will be only data about that broker. Volumes are important becase they will form the price and volatility of the market. Using an algorithm this indicator can give you a very good approximation of the volumes for each candle.
How to read the indicators?
This version provides you many visualiza
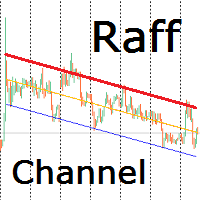
Индикатор строит канал Раффа на основе линейной регрессии. Красная линия тренда может использоваться для принятия решения о покупке или продаже внутрь канала при подходе цены к ней. Настройками можно задать ширину канала по коэффициенту отклонения от базовой линии или по максимальному и минимальному экстремуму. Так же можно включить продолжение канала вправо от текущих цен. Индикатор канала регрессии Раффа – удобный инструмент, значительно облегчающий работу современного трейдера. Он может быть

Bearish/Bullish divergent bar . One of the signals of the "Trade Chaos" system of Bill Williams. (First wiseman)
When bar moving away from the "Alligator" indicator and there is divergence on the Awesome Oscillator indicator, it shows a potential point of movement change.
It is based on the opening/closing of the bar, the position relative to the previous ones, the Alligator and AO.
When trading, the entrance is at the breakthrough of the bar(short trade - low of bar, long trade high of bar)

Forex Driver is a great tool for detecting peaks and valleys on a chart. This indicator uses a modified peak and trough detection algorithm. This algorithm includes the Fractals indicator and the ZigZag indicator.
This tool should be used to analyze peaks and valleys, as well as to detect patterns, or for other purposes. You can use this powerful tool for your own purposes at your own risk.

Benefits: A new and innovative way of looking across multiple timeframes and multiple indicators on any chart. Provides instant multi-timeframe analysis of any market. i.e. forex currency pairs, cryptocurrency pairs, commodities, etc. It offers precise indications across multiple timeframes of volatility as measured by RSI, ADX and STOCH within one chart. Helps you determine high probability trading setups. See example strategy in comments. Can see bullish/bearish volatility building across mult
MetaTraderマーケットが取引戦略とテクニカル指標を販売するための最適な場所である理由をご存じですか?宣伝もソフトウェア保護も必要なく、支払いのトラブルもないことです。これらはすべて、MetaTraderマーケットで提供されます。
取引の機会を逃しています。
- 無料取引アプリ
- 8千を超えるシグナルをコピー
- 金融ニュースで金融マーケットを探索
新規登録
ログイン