YouTubeにあるマーケットチュートリアルビデオをご覧ください
ロボットや指標を購入する
仮想ホスティングで
EAを実行
EAを実行
ロボットや指標を購入前にテストする
マーケットで収入を得る
販売のためにプロダクトをプレゼンテーションする方法
MetaTrader 5のための無料のエキスパートアドバイザーとインディケータ - 12

1. The Expert Advisor built with a basic, simple and stable trading strategy that is highly effective and accurate with a sniper entry system with a good money management.. 2. The expert advisor works best as from 15 minutes time frame and above.... 3. The expert advisor work with all broker and all currency pair and synthetic indices... 4. Use a reasonable lot size and correct settings if you want to get the best of the Expert Advisor.. Note: To enjoy the full working ability of this Expert Adv
FREE

O indicador Supertrendingsignal imprime um sinal na tela indicando início de uma forte tendência. O sinal não mostra o ponto de entrada com melhor risco retorno, apenas faz a indicação de uma forte tendência. Foi idealizado a partir de um conjunto de médias móveis e volume. Parametros: Periodmalongo: Períodos da média longa Periodmamedio: Períodos da segunda media Periodmamedio2: Perídos da terceira media Periodmacurto: Períodos da média curta. PeriodATR: Períodos do indicador ATR para adequar
FREE
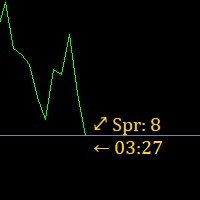
Super simple, convenient, useful tool. Allows displaying the end time of a candle (standard) and expanding the symbol's spread in real time.
The countdown tool is smooth, not jerky or slow like some other tools
Useful tool for professional traders specializing in short-term and long-term trading.
Contact author or user guide: https://www.mql5.com/en/channels/metool_trading
FREE

The big figure is a crucial aspect of forex trading, serving as a reference point for trade execution, risk management, and technical analysis. By understanding the importance of the big figure and incorporating it into their trading strategies, forex traders can improve their decision-making process and increase the likelihood of successful trades. Why is the Big Figure Important? The big figure is important for several reasons: Simplification: Traders often refer to the big figure when discu
FREE

Free version of the TickScalper indicator. The Tick Scalp indicator is a trading assistant for a scalping trader. Works in a separate window. Tracks the momentary activity of the market, shows the graph of the movement of ticks and the strength of bulls or bears. Sometimes it can anticipate the beginning of a strong movement before any other indicators. Helps the trader to make a decision to open the desired order. Designed to work on any instrument. Used timeframes from M1 to M15. Has simple a
FREE

「ChronoTrigger EA」は、緻密な取引戦略と自動化されたリスク管理機能を兼ね備えたエキスパートアドバイザーです。このEAは、RSI指標を活用し市場の買われ過ぎや売られ過ぎのタイミングを見極めることで、エントリーとエグジットの最適ポイントを計算し、投資家が市場の変動に左右されることなく安定した収益を得るための強力なサポートを提供します。 利用者は、ロットサイズやストップロス、テイクプロフィットの設定値を自由に設定し、さらに内部パラメータ(x0からx7)を調整することで、自身のトレーディングスタイルや市場の条件に完璧に合わせたパーソナライズが可能です。このEAは、あらゆる市場環境に柔軟に対応するために3桁または5桁の価格設定に自動調整し、多種多様な通貨ペアに適応します。 以下のような通貨ペアと時間足の組み合わせをおすすめします。 GBPJPY (ポンド円)のH4足 EURJPY (ユーロ円)の H4足 GBPUSD (ポンドドル)の M30足 EURUSD (ユーロドル)の M30足
FREE

Indicator that uses ATR and standard deviation to calculate the current trend. It has the top and bottom line. The top line is shown when it is high, and the bottom line when it is low. The indicator does not draw a trend line or show the trend for the day, or for a certain period. It has the function of indicating the current trend, and may indicate a reversal.
use it with caution and at your own risk.
FREE

キャンドルボットのご紹介 - ローソク足パターンを認識しトレードするための究極の無料ツール!キャンドルボットを使用して、簡単に高値と低値の両方に認識できる牛さんと熊さんのエングルフィング、モーニングスター、イブニングスター、そしてハンマーシグナルを活かし、市場で優位性を得ましょう。特定の期間にわたる始値、高値、安値、終値から導き出されたローソク足パターンは、価格動向の視覚的な表現となり、トレーダーが市場センチメントを分析し、潜在的な逆転や継続を予測するのに役立ちます。 ローソク足パターンの理解: エングルフィングパターン: 二つのローソク足から成り立ち、二つ目のローソクが完全に最初のものを覆います。ベアッシュエングルフィングは下降トレンドの終わりにおいて上昇トレンドの反転の可能性を示し、ブルッシュエングルフィングは上昇トレンドの終わりにおいて下降トレンドの反転の可能性を示唆します。エングルフィングキャンドルの本体が大きいほど、そのシグナルは強力です。 ハンマーパターン: 一本のローソク足で、本体が上部近くに小さく、下部に長い尾を持つハンマーのような形です。ブルッシュハンマーは下降トレン
FREE

Axilgo Pip Piper CoPilot Elevate your trading game with the Axilgo Pip Piper CoPilot, the first in our revolutionary Pip Piper Series. This all-inclusive toolset is meticulously crafted for serious traders, focusing on key areas such as Risk Management, Trade Management, Prop Firm Rule Compliance, and Advanced Account Management . With CoPilot, you’re not just investing in a tool—you’re gaining a strategic partner in the intricate world of trading. Important Notice: To ensure you receive the fu
FREE

OHLC マグネットは、水平線、長方形、価格ラベルに欠落しているマグネットポイントを追加します。 あなたはこのユーティリティが好きなら、とコメントを評価してください。
指示:
前述のオブジェクトの1つを、ピクセルの近接範囲内の目的の始値、高値、安値、または終値にドラッグするだけで、選択した正確な価格ポイントにオブジェクトが自動的にアタッチされます。
パラメーター:
近接 (ピクセル): その特定の価格ポイントに接続するためのユーティリティの始値/高値/安値/終値をマウスカーソルがどの程度閉じるかをピクセル単位で指定します。デフォルトは10です。 価格ラベルを自動調整する: 価格ラベルを左側 (左の価格ラベルの場合) または右 (価格ラベルの場合) に自動的に調整します。既定値は有効です。
FREE
*** ATR ------- Moving Averages ------ RSI ***
MQLuxe C1 is a special MT5 Robot that is a fully automated trading system that doesn't require any special skills from you. Just fire up this EA and rest. You don't need to set up anything, EA will do everything for you. EA is adapted to work on small deposits. This trading strategy that combines ATR (Average True Range), Moving Averages, and RSI (Relative Strength Index) is a popular approach used by traders to identify potential trend c
FREE

Please backtest with the exact balance of your live account before applying to real money. ==> If account balance is too low it may not trade at all!
For MT4 version please contact via private message. martingale version is available here . Strategy description - Detect trend based on EMA18-EMA50-SMA200 alignment in three time frames: M15, H1, H4 - Trade in trend direction and exit when above alignment is broken. - The bot is tuned to trade XAUUSD(Gold). - The bot output is break even in rangi
FREE

The Monthly Weekly Open Line is an indicator that plots: The current month open line that will extend till the last week on the month. Weekly lines that span the look back days period that you have set . Each line will extend from the respective weekly Monday zero GMT till friday of the respective week. Monthly and Weekly open lines can be used to build very powerfull anc consistent trading strategies. They act as natural S/R price barriers.
FREE

This Advanced Pivots Point is a MT5 Indicator and the essence of this technical indicator is to transform the accumulated history data. Pivot Point Indicator provides for an opportunity to detect various peculiarities and patterns in price dynamics which are invisible to the naked eye. Pivot Points Fibonacci retracements Previous day’s open, high, low, and close.
FREE

This EA is named Dinosaur Hunter(DH) because it can capture very large trend, such as 5000-10000 pips. DH trades infrequently as it patiently waits for the right market conditions. DH can load multiple currency pairs on a single chart to increase the number of trades. Live Signal
This is a demo version that only for fixed lot size of 0.01. To obtain the full version, please purchase Dinosaur Hunter Pro . This EA has been tested from 2015 to the present. The test used data from Dukascopy. If
FREE

Pivot Point Supertrend (corresponds to Pivot Point Super Trend indicator from Trading View) Pivot Point Period: Pivot point defined as highest high and highest low... input 2 = defining highest high and highest low with 2 bars on each side which are lower (for highest high) and are higher (for lowest low calculation) ATR Length : the ATR calculation is based on 10 periods ATR Factor: ATR multiplied by 3
FREE

If you are (or were) a fan of the RSI indicator will love Tushar Chande's Dynamic Momentum Index indicator, that simply put is a dynamic variable lenght RSI, so it is more powerful. The DMI indicator internally uses a variable number of bars in its calculations, taking into consideration the volatility levels of the current market you are analyzing. This way, the DMI indicator will use more bars as volatility decreases and less bars when volatility increases, giving you a more powerfull analysis
FREE

This is a non-parametric ZigZag providing 4 different methods of calculation. Upward edge continues on new bars while their `highs` are above highest `low` among previous bars, downward edge continues on next bars while their `lows` are below lowest `high` among previous; Gann swing: upward edge continues while `highs` and `lows` are higher than on the left adjacent bar, downward edge continues while `highs` and `lows` are lower than on the left adjacent bar. Inside bars (with lower `high` and
FREE

Highly configurable Moving average indicator.
Features: Highly customizable alert functions (at levels, crosses, direction changes via email, push, sound, popup) Multi timeframe ability Color customization (at levels, crosses, direction changes) Linear interpolation option Works on strategy tester in multi timeframe mode (at weekend without ticks also) Parameters:
MA Timeframe: You can set the lower/higher timeframes for Ma. MA Bar Shift: Y ou can set the offset of the line drawing. MA Perio
FREE
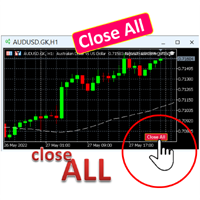
A simple button to completely close all existing open trades (both Buy and Sell) on the current chart .
Warning : Once the button is pressed, all open trades on the current chart will be deleted immediately without any more questions or dialogue.
Use this utility very carefully. We recommend that you do a trial of removing open trades on a demo account first, before trying to use this utility on a real account.
FREE

'Fibonacci Dimension' indicator allows display of preset or user-defined multi-timeframe Fibonacci levels. It automatically takes the previous high and low for two user-defined timeframes and calculates their Fibonacci retracement levels. It also considers the retraced level to draw the expansions on every change of price. A complete visual dimension in multiple timeframes allows deriving profitable strategies for execution. The functionalities included are: Provides an option to consider a pres
FREE
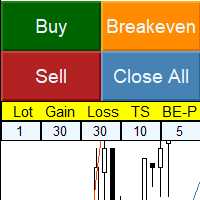
Simple panel with Stop loss (Loss), Stop gain (Gain) , Trailing stop (TS) and Breakeven (BE-P).
Lot is the number of contracts to be traded.
Gain is the number, in points, that the stop gain will be positioned. If you don't want to put stop gain, just put 0 (zero) in place and when you open the order it won't have this stop.
Loss is the number, in points, that the stop loss will be placed. If you don't want to put stop loss, just put 0 (zero) in place and when you open the order it won't
FREE

The indicator displays the size of the spread for the current instrument on the chart. Very flexible in settings. It is possible to set the maximum value of the spread, upon exceeding which, the color of the spread label will change, and a signal will sound (if enabled in the settings). The indicator will be very convenient for people who trade on the news. You will never enter a trade with a large spread, as the indicator will notify you of this both visually and soundly. Input parameters: Aler
FREE

Resistance and Support is an easy to use indicator to apply horizontal lines of resistance and support. There are two windows for adding levels. When you press the button, a line appears on the price chart. It is possible to move this line with the mouse, thereby changing the indicator readings. In the indicator menu there is a choice of possible alerts - no alert, alert on touching the level and an alert for closing the candle after the level.
FREE

Introduction To Time Box Indicator Time Box Indicator is a must have indicator for any trader. It will display daily, weekly and Monthly box according to your preferences. Yet, you can extend any important price levels in your chart automatically. You can use them as the significant support and resistance levels. It is very simple but effective tool for your trading.
Graphic Setting Use White Chart Line Style for Current Open price
Daily Setting Update Timeframe for daily box Number of days
FREE

This indicator automatically draws horizontal lines at 00s, 20s, 50s and 80s levels. If you trade ICT concepts and are an ICT Student, then you know that these levels are used as institutional support/resistance levels and fibonacci retracement anchor points. Features
Draws horizontal lines at 00, 20, 50 and 80 levels above and below current price. Choose the amount of levels to show on chart Customizable line colors Recommended for forex currency pairs. Save time looking for these levels
FREE

The purpose of using Smart money index (SMI) or smart money flow index is to find out investors sentiment. The index was constructed by Don Hays and measures the market action. The indicator is based on intra-day price patterns. The beginning of the trading day is supposed to represent the trading by retail traders. The majority of retail traders overreact at the beginning of the trading day because of the overnight news and economic data. There is also a lot of buying on market orders and shor
FREE

The Daily Highs and Lows Indicator is a versatile tool that combines support and resistance levels with real-time market dynamics. By incorporating previous daily highs and lows, it provides valuable insights into market psychology and identifies potential areas of price reversals or breakouts. With its ability to adapt to changing market conditions and customizable options, traders can stay ahead of trends and make informed decisions. This indicator is suitable for various trading styles and ti
FREE

Introduction
The RSI Plus is an innovative technical analysis tool designed to measure the strength and direction of the market trend. Unlike the traditional RSI indicator, the RSI Plus boasts a distinctive ability to adapt and respond to market volatility, while still minimizing the effects of minor, short-term market fluctuations.
Signal
Buy when the RSI plus has been in the oversold (red) zone some time and it crosses above the 20 level on previous candle close
Sell when the RSI
FREE
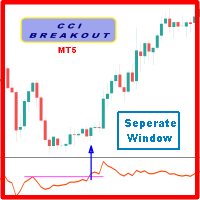
Probability emerges to record higher prices when oscillator breaks out oscillator historical resistance level when exhibit overbought values. Since, oscillator breakout of support and resistance have similar effect as price breaks support and resistance levels, therefore, its highly advised to confirm price breakout with oscillator breakout; certainly, will have the same output in short trades. Concept is based on find swing levels which based on number of bars by each side of peak or trough - a
FREE

Gatotkaca Support Resistance Trendline Indicator is a simple indicator that detects support, resistance and trendlines. It will helps you find breakout momentum based on lines calculated by this indicator. This is conceptually based on fractals, but with customizable periods. Compatible for any timeframes. You can customize how this indicator work by setting up the period input.
FREE
A neural network Expert Advisor based on two moving averages with the training mode. Train the Expert Advisor on selected examples and make a profit in real life. The EA can work on any instrument and in any timeframe.
Trading Algorithm of the EA Two moving averages are analyzed by the neural network core, which produces commands to buy or sell. the values of two moving averages, fast (FMA) and slow (SMA), are provided to the first layer, at the second layer it calculates two neurons responsib
FREE

This indicator displays the remaining time of the current candle, providing a visual representation of the time left until the candle closes and a new one begins, helping traders to make more informed decisions and stay on top of market fluctuations with precise timing, enhancing their overall trading experience and strategy execution, and allowing them to optimize their trades and maximize their profits.
FREE

Introducing Adolla Burst FX for EURUSD H1 chart Adolla Burst FX is a groundbreaking expert advisor designed for trading EURUSD H1 chart on the Meta Trader 5 platform, featuring a sophisticated amalgamation of 50 rigorously validated strategies. Developed over an impressive span of 17 years since 2008, Adolla Burst FX stands out for its precision in market despite not using normal TP or SL methods. Its completely indicator based with an advanced reversal function for effective chart navigation.
FREE

「Envelope of Adaptive Moving Average」インジケーターは、金融市場で賢明な意思決定を支援するツールです。これは、トレードにおけるトレンドの方向やエントリーおよび出口の可能性ポイントを明確に示すために設計されています。
このインジケーターは適応型移動平均に基づいており、市場のボラティリティの変化に自動的に適応します。これにより、穏やかな時期からボラティルな時期まで、さまざまな市場状況で有用です。このインジケーターは適応型移動平均を包む2本のラインを表示します。これらのラインはサポートとレジスタンスの重要なレベルを識別するのに役立ち、資産を買うか売るかの判断をより的確に行うのに役立ちます。
高度なテクニカルツールであるにもかかわらず、理解しやすく使いやすいため、初心者から経験豊富なトレーダーまでに適しています。このインジケーターは市場の変動に適応できる能力を持っており、さまざまな状況で効果的です。市場のトレンドを明確に視覚化し、衝動的な取引を避けるのに役立ちます。このインジケーターはトレーディングツールボックスの中で貴重なツールとなることでしょ
FREE

In the world of finance, correlation is a statistical measure of how two securities move in relation to each other. Correlations are used in advanced portfolio management. This indicator measures how different securities move in relation to a reference one, thus making portfolio management easier. [ Installation Guide | Update Guide | Troubleshooting | FAQ | All Products ] Avoid concurrent trades in highly correlated instruments Find trading opportunities among highly correlated instruments Cor
FREE

Break Even Line by MMD
The Break Even line is a useful indicator for people using strategies that allow simultaneous trades in both directions, such as the MMD methodology. This indicator is useful when playing statistical models and averaging positions in accumulation and distribution zones. The indicator draws levels by summing positions in three groups: positions included in BUY, positions included in SELL and all positions included.
Functionality description:
Show BUY BELine - shows
FREE

MaRSI Scalper & Trader The combination of moving averages and RSI This setting is flexible so it can be set with regards to user test uses 1. For scalping 2. For long time trading
features 1. Sends push notifications 2. Sends alerts on computers 3. Draws Arrows 4. Draws respective indicators (this feature will be edited in the future)
Have feedback https://t.me/Tz_Trade_Logics or just call +255766988200 (telegram/whatsApp) Head to discussion page to leave your comments Improvement are on t
FREE

The 3 Candlestick Engulf indicator is a candlestick pattern indicator that considers the last 3 bearish candles for a Bullish Engulf candlestick pattern signal and last 3 bullish candlesticks followed by a Bearish Engulf candlestick pattern for a bearish signal. Engulfs are also presented in both trending and non-trending situations of the market though recommended to move with signals that are in line with the trend basing on the moving average. The indicator has multiple input features that yo
FREE

Edgeweasel ORB: 典型的なオープニングレンジブレイクアウト(ORB)エキスパートアドバイザーを超えるEA。この多機能なマルチアセットツールは、市場が開く直後に複数の金融商品を同時にスキャンし、取引機会を見つけることに優れています。設定可能なRSIフィルターを使用し、買われ過ぎや売られ過ぎの市場条件を正確にターゲットにし、全体的なパフォーマンスと成功率を大幅に向上させます。 多様なグローバルユーザーベースにサービスを提供するために、このアドバイザーは英語、ロシア語、 中国語 、 スペイン語、ポルトガル語(ブラジル)、ドイツ語*を含む多言語サポートを提供しています。その戦略は実証済みで堅牢であり、グリッドやマーチンゲール戦略への依存を避けています。戦略の設計に沿って、すべてのポジションと未決済の注文は、毎取引日の終わりに体系的にクローズされます。さらに、ランダムな時間設定を含む独特の機能があり、これによりユーザーはバックテストの結果とランダムな条件下で生成された結果を比較することができます。この機能は、正確なエキスパートアドバイザー(EA)の設定の重要性を強調しています。
FREE

Alert Indicator for exponential moving average cross blue arrow for buy alert , fast ema 14 crosses above 50 pink arrow for sell alert , fast ema 14 crosses below 50 Default 14 ema fast & 50 ema slow add these indicators to chart Full Alerts , push, email, phone inputs for moving average lengths and alarm on off settings Please contact for help of an indicator alert suggestion
FREE
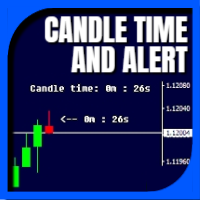
This indicator show the candle remaining time on the chart and/or in the corner of the window. It also display notificaton (popup and push) when a new candle is formed (optional). You configure the timer on candles and at chart corner. I don't need to explain the functions because are very simple. MT4 version: https://www.mql5.com/en/market/product/38677 Any doubt or suggestion please contact us. Enjoy!
This is a free indicator, but it took hours to develop. If you want to pay me a coffee, I
FREE

VolumeFlow is a Volume Accumulation / Distribution tracking indicator. It works in a similar way to OBV, but it is much more refined and includes the options to use: Classical Approach = OBV; Useful Volume Approach; Gail Mercer's approach; Input Parameters: Input Parameters: Approach Type: Explained above; Volume Type: Real or Ticks; Recommendations: Remember: The TOPs or BOTTONS left by the indicator are good Trade Location points. This is because the players who were "stuck" in these regions w
FREE

Apply to the 5 minute timeframe against the major USD forex pairs. AUDUSD EURUSD GBPUSD USDCAD USDCHF USDJPY Highlights the PropSense Book Levels Turn on/off for Sydney, Asia, London and New York Sessions Shows the Tokyo and London Fixes Turn on/off for Tokyo and London Configure how many historical fixes to show Shows the Sessions Turn on/off visible indication for sessions (supports 4 sessions) Visibly shows the sessions (out of the box configuration for Sydney, Tokyo, London and New York) Hig
FREE

The "Simple Trading Controller" for MetaTrader 5 sets a new standard for speed and efficiency in opening and closing market positions. Crafted with a clean and intuitive design, this tool is a response to the specific needs of traders, ensuring a seamless and rapid trading experience. All it provides is: Quick BUY and SELL Buttons Open multiple operations at the same time Set Trade Size Set Stop Loss Take Profit Points Close All Positions Let's go and see the advantages of using "Simple Trading
FREE
The RMI Scalper EA is a fully automated Expert Advisor that trades pullbacks from the major trend using RMI and limited averaging. The EA trades using market orders and uses averaging to safely turn otherwise negative trades positive. This EA works best on USDJPY, EURUSD, GBPUSD, USDCAD, USDCHF, AUDJPY, EURCAD, EURGBP and EURJPY using the M30 timeframe and has the option to trade multiple pairs but only one pair at any one time to increase trade frequency without increasing draw down.
Please no
FREE

アカウントダッシュボードの統計
これは、アカウントの損益を把握するために集中的に表示するのに役立つツールであり、それを追跡することができ、また、得られるリスクを知るためのドローダウン分析も提供します。 アカウントにダウンロードしてアクティブ化した後、EURUSD H1 などの任意のシンボルに添付する必要があります。その後、この瞬間からツールが統計の監視を開始します。
パネルは完全に高度になっており、非表示にしたり、好きな場所に移動したりできます アカウント操作に基づく主な特徴は次のとおりです 毎日の期間(毎日の利益と損失は毎日更新されます) 毎週の期間 (毎週更新される週ごとの利益と損失) 毎月の期間(毎月の損益は毎月更新) 年間期間 (年間の損益は毎年更新) 最大ドローダウン(残高に基づいて最大リスクに達するのを毎秒監視して制御) たとえば、残高が 1000 米ドルで、引き出しが 10% をマークしている場合、ある時点でアカウントの合計リスクが 100 米ドルに達したことを意味します。
FREE

Wyckoff fans, enjoy!
Ideally to be used with the Weis Waves indicator, but it can be easily used alone, the Waves Sizer puts the range (in resulting Price movement) done by the Price on its market swings. You can control how accurate or loose will be the swings. This tool is very helpful for visually know how much the Price has traveled in your Timeframe. This way you can confront this level of effort with the resulting Volume, etc... Weis Waves indicator:
https://www.mql5.com/en/market/pro
FREE

TimeBar TimeBar は、バーが閉じるまでの残り時間、バーが開いてからの経過時間と現在時刻を表示するシンプルな情報インジケーターです。 見やすくするために、グラフの左上隅にコメントの形で表示する方法と、グラフィック オブジェクトの形で表示する 2 種類の表示モードが追加されました。
利点 フォントの選択 フォントサイズ。 どれでも設定できます。 コメントすると小さすぎるので オブジェクトを移動できます。 マウスをダブルクリックして任意の時間を選択し、チャート上の任意の場所に移動すると、通常どおり更新され続けます 視覚的な警告。 現在のバーが閉じるまでの指定秒数を設定でき、その秒数に達すると、設定で指定した警告色に変わります 設定 表示する時間を選択します 各時刻の色 (グラフィック オブジェクトの場合) バーがまもなく閉店することを通知するアラート 取引システムへの追加として TimeBar インジケーターを使用する
市場にある他の製品もお試しください https://www.mql5.com/ru/users/capitalplus/seller
FREE

FRB Trader - Our mission is to provide the best support to customers through conted and tools so that they can achieve the expected results
FRB Support and Resistance
- Indicator places lines on the chart to show Support and Resistance regions. - You can choose the timeframe you want to calculate, as well as the colors of the lines. - Algorithm calculates the points where the strengths of the asset are considered and are extremely important for decision making.
FREE

Complete Trade Manager (MT5)
Manages each open position individually Automate exit strategy (great for prop firm challenges) Use R: R based exit or Fixed Pips exit models Scale out of positions (3 x Targets possible) Breakeven after 1 st 2 nd or 3 rd partial take profit Trail Stop Loss Stop Break Even Fixed Target Exit (Without Partial Profit) Equity Target Based Exit Expect More features in the future Having a plan to exit with trades based on predefined set of rules provides consistency an
FREE
Forex Calculator は、すべてのトレーダーにとってなくてはならないプログラムです。
このスクリプトを使用すると、設定されたピップ単位のストップロスに応じて、預金のリスクの割合を計算できます。
外国為替計算機を使用すると、取引を開始する前にリスクを簡単に計算できます。情報は、取引を開始するために必要なロットを示すポップアップウィンドウとして表示されます。これにより、計算にかかる時間を節約でき、最終的な取引を開始するときに、その開始の結果を確認できます。
キーボードのボタンを押すことでスクリプトをすばやく実行するのに役立つホットキーをスクリプトに添付できます。 Robot Scalper - https://www.mql5.com/en/market/product/77108
スクリプトの利点:
あなたは常にあなたがすべての取引で何を危険にさらしているのかを正確に知っています。 計算機は契約の仕様を考慮に入れます データ入力リスクとピップ単位のストップロスサイズの2列のみ オプション
Risk_in _% -トランザクションで使用するリスクの
FREE

Introduction to Order Risk Management EA ORM EA is specially designed for fast and accurate market order execution to be used with our Price Action and Econometric Trading strategies listed below. ORM EA is fully automatic and ORM EA is also very easy to use. ORM EA is totally free of charge. You can also use this robust order execution feature of this ORM EA for any other your own trading strategy.
Trading Strategy Guide Order Risk Management EA provides the guide for the risk management for
FREE

This indicator is a volume indicator it changes the color of the candles according to a certain number of ticks, and this number of ticks can be informed by the user both the number of ticks and the color of the candles, this indicator works in any graphical time or any asset, provided that the asset has a ticker number to be informed.
This indicator seeks to facilitate user viewing when analyzing candles with a certain number of ticks.
FREE

This MT5 chart trend checker cuts through the noise of market volatility to provide a clearer picture of trends and price movements. It includes the following features that can provide more clarity during market assessments: 1 customizable multi-period moving average Optional Heikin-Ashi candles 3 switchable focus modes Distinct colors for easy analysis
Link to MT4 version: https://www.mql5.com/en/market/product/106708/
This indicator shows your preferred moving average from multiple time fr
FREE

Volume Weighted Average Price (VWAP) is a trading benchmark commonly used by Big Players that gives the average price a Symbol has traded throughout the day. It is based on both Volume and price. This indicator contains Daily VWAP and MIDAS' VWAP, which means you are able to anchor the beggining of MIDAS' calculations and, therefore you will be able to use this methodology to study price versus volume moves after anchor point. You will be able to anchor up to 3 HIGH MIDAS VWAP's and 3 LOW.
Wis
FREE

精密な取引分析を指先で:次世代取引分析ソフトウェア 市場に出回っている一般的な取引分析ソフトウェアは、時間別または週別の損益率統計のみを提供することが多く、より正確な取引分析のニーズを満たしていません。しかし、実際の取引市場では、毎日が独自の状況を呈しています。月曜日は静かで、水曜日は3倍のオーバーナイト金利で活発になり、金曜日は重要なデータ発表で非常に活発になります。明らかに、毎日統計分析を行うことは科学的ではなく、週単位で分析する方が理にかなっています。しかし、週足チャートは各日の統計的な状況のみを示しており、時間ごとの変化を捉えることができません。さらに、特定の銘柄は、ロングポジションとショートポジションで大きな違いを示すため、個別の分析が必要ですが、これは現在の取引分析ソフトウェアには欠けています。
時間単位が粗すぎることに加えて、既存の取引分析ソフトウェアは、戦略のフィルタリングの点でも不足しています。銘柄名のみでフィルタリングを行うことは、1つの銘柄で複数の戦略が同時に実行されている可能性があるため、科学的ではありません。同様に、マジックナンバーのみを頼りにフィルタリ
FREE

IDixie is an indicator which shows open and close values of the American dollar index, DXY or "Dixie". The indicator is calculated from weighted values of 6 major symbols: EURUSD, USDJPY, GBPUSD, USDCAD, USDSEK, and USDCHF. In addition to "Dixie" values, the indicator also shows a moving average. You can set the period of the moving average. When bars of the indicator break through the moving average, this creates good opportunities to enter the market. As a rule, signals from this indicator are
FREE

No Nonsense Forex Methodのトレードパネル チャートをきれいに保ちながら、取引速度を向上させます
特徴: - ポジションサイジング: [Buy/Sell] をクリックすると、このツールはリスクに最も近いロット数 (各取引で使用される残高の割合) で 2 つの取引を開始します。ピップ値の計算は忘れてください!
-SL と TP: 各取引は 1.5*ATR のストップ ロスで開かれ、1*ATR のテイク プロフィットで 2 つの半分のうちの 1 つが開かれます。使用される ATR 値は、現在のローソク足の値であり、日足のローソク足を完了するまでの残り時間が 4 時間未満の場合、そうでない場合は前のローソク足の値になります。
-ストップロスの更新 : ストップロスを損益分岐点に設定するか、NNFX のルールに従ってトレーリング ストップを更新します (価格が 2*ATR に移動した後、ストップ ロスは 1.5*ATR に移動します)。 - ポジションを閉じる: 決済シグナルを受け取ったら 、ワンクリックですべての売買を決済します
その他の考慮事項: -プ
FREE

Copy trades with ease using the MetaTrader5 trade copier - the quickest and easiest way to copy transactions between different MetaTrader 5 accounts! This innovative tool allows you to locally copy trades in any direction and quantity, giving you full control over your investments.
Attention!
You need to download the Trade Copier Slave mq5 file as well to run this EA. Download it from here https://www.mql5.com/en/market/product/96541
Designed to work on both Windows PC and Windows VPS, t
FREE

Relative Volume or RVOL is an indicator that averages the volume of X amount of days, making it easy to compare sessions volumes.
The histogram only has 3 colors:
Green - Above average volume
Yellow - Average volume
Red - Below average volume
The default setting is 20 days, which corresponds more or less to a month of trading.
In this version is possible to choose between tick and real volumes (if you are using a broker which offers future contracts)
With the data obtaine
FREE

Welcome! Check out the video in which I explain the scalping trading bot in-depth! I'll unveil a groundbreaking scalping trading bot tailor-made for small trading accounts. I'll delve into the intricacies of its settings, guiding you on how to apply them to your charts with best practices. Every setting will be meticulously explained, accompanied by comprehensive backtest reports to provide a clear perspective on what this trading bot can achieve for you. And the best part? I'll reveal how y
FREE

Value Chart indicator presents the Price evolution in a new form. This indicator, Price Momentum , was developed taking all the calculations presented in the book " Dynamic Trading Indicators " by Mark W. Helweg and David Stendahl (2002). The technique involves de-trended Prices from a user-defined Period of analysis and the addition of a Volatility index correction. The result is an Oscillator with 3 zones: Fair Price Value, Overbought/Oversold and Extremely Overbought/Oversold zones. Adding th
FREE

Overlay indicator on chart between 2 pairs
The Timeframe Overlay indicator displays the price action of timeframes on a single chart, allowing you to quickly assess different timeframes from a single chart. The advantage is to observe and follow the correlations of price movements in real time to help you find potential trades at a glance.
---- Symbol 1 ----
Symbol = EURUSD
Correlation Inverse = false
Display = true
Ratio
FREE

Are You Better than Monkey? Prove it...
The trade of this EA is based on random output with customizable lot size (use martingale or not), stop-loss, and take-profit levels. Easy to use and Simple Great for benchmarking tests against other EAs or manual trade. Works for ECN/Non-ECN brokers and 2-3-4-5 digit symbols Support us by open My recommended broker. Exness Tickmill robot monkey uses Adx trend filter for fair game no-trade unfavorable market ( you can turn off set adx = 0) . EA starts
FREE

The HammerStar indicator is designed to search for the Hammer and Shooting Star patterns on charts of any currency pairs.
Hammer Downward trend.
The lower shadow is not less than 2 and no more than 3 times larger than the body.
There is no upper shadow, or it is very short (no more than 10% of the candlestick range).
The color of the body in the long game is not important, with the short - white hammer is much stronger than the black one.
Confirmation is suggested.
Shooting Star Uptrend.
FREE

A heatmap is a graphical representation of data in two dimensions, using colors to display different factors. Heatmaps are a helpful visual aid for viewers, enabling the quick dissemination of statistical or data-driven information. The MP Heatmap indicator provides a graphical representation of the relative strengths of major currencies compared to others, organizing data from pairs into color-coded results and producing a clear overview of the entire Forex market. The MP Heatmap indicator dis
FREE
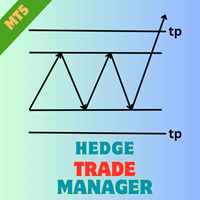
Product Name: Hedge Trade Manager MT5 Description: The "Hedge Trade Manager" EA for MetaTrader 5 is a sophisticated solution designed to adeptly manage trades through a hedge trading strategy. With a range of configurable settings, this EA provides comprehensive control over hedge trades. The documentation below outlines the various inputs and parameters to assist you in customizing the EA to suit your trading preferences. Overall Settings/Input Guide Name Setting Description General Settings Ma
FREE
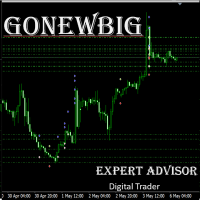
GoNewBig 是根據信號產生器做出交易決定後再根據現有的資金量調整下單的單量 設計目的希望所有參與交易的交易者,都能夠獲取合理的利潤
值得注意的是,過去的歷史回測匯或許會有相當大的利潤發生.但是將來的行情型態是不可知的.所以不要盲目地相信EA會創造出絕對的利潤,但也不要一昧地認為自動交易就是不可取的
特點
自適應的交易信號: 根據市場狀況自動調節信號產生的條件 簡單的設定方式: 只需簡單的設定即可. 單品種交易: 根據信號產生器做EURUSD單品種的交易 無華麗顯示面板: 將算力完全用在交易程序的計算 可以更高效續的執行工作 短期交易策略: 開單頻率及持倉時間一週 安全的風險控制: 在當前行情不例於持倉狀況時安全認損 不會早造成爆倉或是大量虧損
環境
使用時間框 H1 交易品種 EURUSD (品種必須列在報價清單上) 啟動資金使用1500美金即可運行 免費版只能交易EURUSD 正式版可以交易多品種 購買或是測試可以聯繫我取得適當的參數
運行淨值保持在2500美金以上 能更加確保交易帳戶的安全
參數
Magic : 自訂義EA持倉的辨
FREE

TOPOS INDICATOR AND HISTORIC BACKGROUNDS The Indicator of historical tops and backgrounds is based on the monthly chart where sharks hide so it was developed to facilitate the identification of these regions. The available features are the Incoming Triggers alerts and notifications that are sent to the mobile phone. Parameters 1-) Tops and Bottoms: You can change the color of the lines and the period in years and the filter range between the top and bottom and the median and consider
FREE
MetaTraderマーケットは自動売買ロボットとテクニカル指標を販売するための最もいい場所です。
魅力的なデザインと説明を備えたMetaTraderプラットフォーム用アプリを開発するだけでいいのです。マーケットでプロダクトをパブリッシュして何百万ものMetaTraderユーザーに提供する方法をご覧ください。
取引の機会を逃しています。
- 無料取引アプリ
- 8千を超えるシグナルをコピー
- 金融ニュースで金融マーケットを探索
新規登録
ログイン