YouTubeにあるマーケットチュートリアルビデオをご覧ください
ロボットや指標を購入する
仮想ホスティングで
EAを実行
EAを実行
ロボットや指標を購入前にテストする
マーケットで収入を得る
販売のためにプロダクトをプレゼンテーションする方法
MetaTrader 4のためのエキスパートアドバイザーとインディケータ - 35

HERE is a FREE file for use in a LIVE DEMO account.
Telegram Group: Find the link in my profile or contact me
Huge Upgrade in:
Conditions of entry.(The same as before plus some restrictions for even better).
Added Buttons for Pause and Restart EA from chart.
Added input for Pause EA based on number of positions and restart the EA based on candle of 4H chart if it is back on trend!
Gold Stallion uses artificial intelligence to produce as better as it can entries in gold.

The indicator shows the trend of 3 timeframes: higher timeframe; medium timeframe; smaller (current) timeframe, where the indicator is running. The indicator should be launched on a chart with a timeframe smaller than the higher and medium ones. The idea is to use the trend strength when opening positions. Combination of 3 timeframes (smaller, medium, higher) allows the trend to be followed at all levels of the instrument. The higher timeframes are used for calculations. Therefore, sudden change

Inspired from, Time is the most important factor in determining market movements and by studying past price records you will be able to prove to yourself history does repeat and by knowing the past you can tell the future. There is a definite relation between price and time. - William Delbert Gann
CITRA BOT is a Price Action/Price Pattern detection Indicator which uses historical data to validate a current pattern or profile to predict the probability of hitting future resistance or support l

EA Features This Expert Advisor is based on standard indicators. You can custom your best parameter for each indicator with your own settings.
Inputs Trade Settings AutoBuy : Auto Buy Trading AutoSell : Auto Sell Trading CloseAll : Close all open orders (this Symbol only) PauseTrade : EA will not open a new order but still holding all opened positions (Example: Before big news coming) ResetTime : Close all opening orders at time selection ResetHour : Close all opening orders at Hour selection

Exclusive Limited Time Offer! Grab this powerful indicator for a lifetime at just $89. Introducing a cutting-edge, non-repainting indicator designed for peak performance in dynamic markets across various timeframes. Enjoy seamless compatibility with any symbols and receive timely mobile alerts. Indicator Features:
Multiple Timeframe Dashboard Conduct comprehensive multiple timeframe analysis from M1 to Monthly charts simultaneously with our dashboard. Higher timeframe signals can confirm lon

Ultimate Double Top Scanner (Multi Pair And Multi Time Frame) : ---LIMITED TIME OFFER: NEXT 25 CLIENTS ONLY ---46% OFF REGULAR PRICE AND 2 FREE BONUSES ---SEE BELOW FOR FULL DETAILS Any major price level that holds multiple times, is obviously a level that is being defended by
the large institutions. And a strong double top pattern is a clear indication of institutional interest.
Double top patterns are widely used by institutional traders around the world. As they allow you to manage
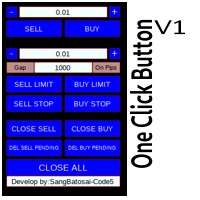
Simple button panel of trade on your chart with OneClick V1 Trial version. This trade panel will make it easier for you.
Equipped with several functions that make it very easy for you. More tools on OneClick VZ version, see here.
This version includes: Open Order Buy Open Order Sell Open Pending Order [Buy Limit - Buy Stop - Sell Limit-Sell Stop] Close ALL orders
Close Order Buy Close Order Sell Delete Pending Order [Buy Limit - Buy Stop - Sell Limit-Sell Stop] ENJOY IT!!! ONE CLICK V1 [TRI
FREE

ダーウィンレポートツールEA
例外的な紹介価格です 35米ドル
DESCRIPTION:
Darwin Reports Tool EA」は、Darwinシリーズの新製品です。
Darwin製品は、その品質と性能の高さから、MQL5でよく知られ、評判が高いです。
今回はExpert Advisorではなく、タスクを自動化するためのユーティリティを提案します。
本来は、自分のパフォーマンスのレポートを作るために
説明:
このユーティリティのおかげで、口座、ストラテジー、あるいは複数の選択可能なEAのパフォーマンスレポートを送信することができます。
電子メール、Telegramなどのネットワークやメッセージング、携帯電話のプッシュメッセージでレポートを送信することができます。
福利厚生:
毎日、毎週、毎月、それぞれのEAからレポートを受け取り、パフォーマンスを調査することができます。
取引口座の正確な統計を取る......。
-- 電子メールで送信
-- テレグラムチャンネルで配信
-- Mt4/5プラットフォ

チャートに表示されるトレンドは、必ずしも利益をもたらすことができるトレンドではありません。2種類のトレンドがあります: 1) 安定しているため、トレーダーに信頼できる利益を提供できる基本的な経済的理由によって引き起こされる真のトレンド; 2) 誤ったトレンドセクション。トレンドのように見え、価格を(主に)一方向にシフトする一連のランダムイベントが原因で発生します。これらの誤った傾向のセクションは短く、いつでも方向を逆にすることができます(そして、原則として、識別後すぐに逆になります); したがって、誤った傾向でお金を稼ぐことは不可能です(偶然ではありません) 視覚的には、真と偽の傾向は最初は区別できません。さらに、ランダムな価格変動またはそれらが生成する誤った傾向は常に真の傾向に重ね合わされ、特に、新しい根本的な経済的原因によって引き起こされる逆転と識別および区別する必要がある真の傾向の後退を引き起こす可能性があります。 カジュアルチャネルインジケーターは、ランダムな価格変動チャネルをプロットすることにより、これ

Robotron M5 is a robot for automatic trading in the Forex market using a scalping strategy on the M5 timeframe. The robot was developed by a team of professional traders and programmers, and its main goal is to carry out transactions by quickly buying and selling currency pairs on short-term trends. Robotron M5 uses various technical indicators and algorithms to analyze the market and determine trade entry and exit points.
Main features of Robotron M5: Automatic trading: The robot can work in

The "Scalper Arrows" indicator is designed for the scalping method of trading within trend directions.
Operating principle of the indicator.
Large arrows indicate the direction of the trend.
Red arrows - for bearish direction, Green arrows for bullish.
Within a bullish or bearish trend, there is an algorithm for generating scalping signals in the form of small arrows.
Also, trend direction lines are drawn in the direction of the trend, and small arrow signals are generated in their direct

ขอบคุณ แรงบันดาลใจ จากโค้ชแพม ที่ทำให้เริ่มทำ Close all ตัวนี้ Close all and update profit Version 3.03 Full version Give you free
For MT5 Click https://www.mql5.com/en/market/product/95989
V3.03 Fix TPSL calculate USDxxx and xxxUSD or XXX/XXX and add Decimal Digi, 0 is default
Program function
Tab 1 Close order function and show break port
1.Can show and hidden all button
2.Update sell and buy total lots easy to manage order
3.Close all order and update all profit
4.Clos
FREE

An expert based on the Accelerator indicator.
Without any additional filters
Interesting and useful result
Can be used in all currency pairs and all time frames
Can be used in all markets
completely free
Fast and simple
With the support of the author
Settings: Signal: These settings are related to the "Accelerator" Indicator. When that indicator reaches this value, the expert trades. Meta Trader Alarm: If you want to receive an alarm through Metatrader after each trade, enable this sett
FREE

What Trades Manager can do for your trades . Collect all order positions into one chart (pict. 1). All orders will be grouped by pair symbol , sum of order positions, lots, running pips, and profit/losses. All orders will be summarized and displayed at the bottom of the panel. You can set target profit, stop loss and placing stop-profit automatically to each order (pict. 4). From one chart, it will be easier to monitor and manage all orders without moving to another chart. The green color is sur

The Key level wedge indicator automatically draws rising wedge pattern and falling wedge pattern for you on the chart. This pattern is really good when used as a confirmation entry at key support & resistance, supply & demand and reversal zones.
Advantages
The Key level wedge block DOES NOT RE-PAINT, giving you confidence when a signal appears and also helps when looking back. The Key level wedge includes an on/off button on the chart to easily keep the charts clean after analysis by jus

This indicator calculates gann support and resistance prices with use gann pyramid formulation and draw them on the chart. And If you want, Indicator can alert you when the current price arrive these pivot levels. Alert Options: Send Mobil Message, Send E-mail, Show Message and Sound Alert Levels: S1, S2, S3, S4, S5, R1, R2, R3, R4, R5 Inputs: GannInputPrice: Input price for gann pyramid formulation. GannInputDigit: How many digit do you want to use for calculation formula. (The number and the
FREE
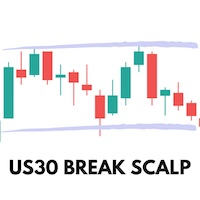
This Expert Advisor trades based on a specific range breakout within a specific hour using scalp techniques. It does not use dangerous techniques like martingale. It only opens a maximum of 3 trades per day (default settings). The default settings are optimized for IcMarkets, FTMO and MFF (set file in the comments) although it can be used with other brokers, you just need to confirm the hours input. Despite this Expert Advisor presents good results in backtesting and for this month (January 2023

The purpose of this new version of the MT4 standard indicator provided in your platform is to display in a sub-window multiple timeframes of the same indicator. See the example shown in the picture below. But the display isn’t like a simple MTF indicator. This is the real display of the indicator on its timeframe. Here's the options available in the FFx indicator: Select the timeframes to be displayed (M1 to Monthly) Define the width (number of bars) for each timeframe box Alert pop up/sound/ema
FREE

インディケータは、前日に基づいて計算されたクラシックピボットレベルをチャートに表示します。 数式を計算する時間から選択できます。 フラットでの反転レベルでの取引。 トレンド市場では、それらをターゲットとして使用します。 取引を成功させるための戦略と組み合わせる 。 レベルはバッファを使用して構築され、利用可能な見積もり履歴全体に表示されます。
入力パラメータ 。
Start Hour - 1日の始まりの時間から。 00-デフォルト 。 Show Mid Pivots - 中間レベルを表示する 。
Visual Button - ボタン表示(有効/無効) 。 Corner - ボタンアンカー角度 。 X indent - ピクセル単位の水平パディング 。 Y indent - ピクセル単位の垂直パディング 。
Label Visual - 表示レベルラベル 。 Label Font Size - フォントサイズ 。 Label Shift Bars - バーの碑文のインデント 。 Label Tooltip - レベルの上のカーソルの下にテキストを表示する
FREE

A trend indicator showing the strength of bulls and bears in a trading range.
Consists of two lines:
The green line is a balanced overbought/oversold condition. The red line is the direction of trading activity. Does not redraw calculations.
Can be used on all Symbols/Instruments/Time Frames.
Easy to use and set up.
How to use the indicator and what it determines.
The basic rule is to follow the direction of the red line:
if it crosses the green line from the bottom up, the market i
FREE
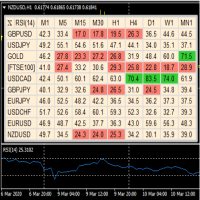
A useful dashboard that shows the RSI values for multiple symbols and Time-frames. It can be easily hidden/displayed with a simple click on the X top left of the dashboard. You can input upper and lower RSI values and the colours can be set to show when above/below these values. The default values are 70 and 30. Symbols and time-frames are input separated by commas. Symbols can also be loaded from the Market Watch window. If there are more than 30 symbols, only the first 30 will be loaded. You
FREE

新しい指標の検索と試行をやめてください! Winshots Massive FX Profitsインジケーターを入手して、群衆から離れてください。
長年の取引経験により、このすべてを1つの指標で構築することができました。
Winshots Massive FX Profitsでプロのように取引しましょう!
この指標は、以下の方法論を使用して、より一貫した収益性の高いトレーダーになるのに役立ちます。
-マーケットボリュームプロファイル -毎日のピボットレベル -価格サイクル分析
ボリュームプロファイルとは何ですか?
ボリュームプロファイルは、多くのトレーダーが見落としている非常に便利な取引ツールです。重要な価格アクションが発生した実際の価格レベルを見つけることができます。サポートレベルとレジスタンスレベルに似ていますが、ロジックが異なります。ボリュームプロファイリングは、機関投資家の取引が行われた実際のレベルのサポートとレジスタンスの概要を示しています。これ以上の推測作業はありません!あなたはすべての重い取引がたくさんのロットとボリュームでいつ行われたか

The new version of the trading panel, which now has the ability to separately close Buy and Sell orders, display targets for all orders on the chart, as well as the ability to use the panel to trade with brokers working on the FIFO rule. Also, the new version adds option buttons for separate management of open orders.
It has a convenient visualized interface and intuitive control without a lot of additional tabs to which traders have to be distracted and switch their attention. Thanks to this
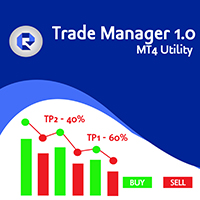
ETM Testing Easy Trade Manager is an advanced trading utility built based on 3 simple & most wanted basic trading functions – Risk Reward Calculation, Smart Partial Closing & Unique Magic Trail Algorithm . Automatic Lot Calculation Trade with % of Balance,Fixed Amount or Fixed lots .
Lot size will be automatically calculated if you use % of Balance or Fixed Amount to trade. 4 Breakeven Options Select from FOUR SMART AUTOMATED BREAKEVEN options suited for novice traders or professionals availab
FREE

Heiken Ashi Button Heiken-Ashi , often spelled Heikin-Ashi, is a Japanese word that means "Average Bar." The Heiken-Ashi approach can be used in conjunction with candlestick charts to spot market trends and forecast future prices. It's useful for making candlestick charts easier to read and analysing patterns. Traders can use Heiken-Ashi charts to determine when to stay in trades while the trend continues and close trades when the trend reverses. The majority of earnings are made when markets a
FREE

This indicator signals about crossing of the main and the signal lines of stochastic (lower stochastic) in the trend direction which is determined by two stochastics of higher time frames (higher stochastics). It is not a secret that stochastic generates accurate signals in a flat market and a lot of false signals in a protracted trend. A combination of two stochastics of higher time frames performs a good filtration of false signals and shows the main tendency. The indicator is recommended for
FREE

Ichimoku Trend Finder is a multi symbol multi timeframe trend dashboard that helps traders to monitor and identify potential market trends from one chart. This panel scans the Ichimoku Kinko Hyo indicator in 28 configurable instruments and 9 timeframes for classic Ichimoku trend signals with a deep scan feature to scan all market watch symbols (up to 1000 instruments!).
Download Demo here (Scans only M1 and M5) Settings description here MT5 version here
After the purchase, don't fo

"Upgrade to the Next Level of Trading with the Vondereich v1.3 Expert Advisor" "Take your trading to the next level with the upgraded version of the Vondereich v1.3 Expert Advisor. This cutting-edge EA features a wealth of advanced features, including: Auto compounding by percentage Customizable trading time frame RSI indicator integration Semi-hedging (Auto) system and more This EA uses a martingale strategy with a customizable pipstep to ensure the safety of your margin. By adjusting the pips
FREE

ATR Volatility plots the ATR-based volatility, and triggers alerts when it crosses user-defined upper and lower thresholds (purple and tan lines, please see screenshots). Circles are painted when ATR volatility crosses either above the upper threshold, or below the lower threshold. This is a small tool custom-built by our group, by specific request of one of our customers. We hope you enjoy! Do you have an indicator you would like to see designed? Feel free to send us a message! Click here for m
FREE

SYMBOL POWER based on inputted 5 time frames and Compared to 20 Other Symbols !! Great Indicator YOU DON'T HAVE TO SHIFT ON ALL TIME FRAMES FOR EACH CURRENCY PAIR TO CONCLUDE ITS TREND AND ITS POWER YOU HAVE IT ALL IN ONE TABLE , 20 CURRENCY PAIR WITH 5 TIME FRAMES ALSO , COMPARE BETWEEN CURRENCIES STRENGTH AND ALERTS THE STRONGER /WEAKER PAIR BASED ON 5 TIMEFRAMES CALCULATIONS ALEERTS enable /disable using 5 time frames M5 M30 H1 H4 and D1 ( latest version You SELECT you own 5 timeframes fr

この無料ツールが気に入ったら、5 つ星の評価を残してください。 どうもありがとう :) 「リスク管理アシスタント」エキスパートアドバイザーコレクションは、さまざまな市場状況にわたるリスクを効果的に管理することで取引戦略を強化するように設計された包括的なツールスイートです。 このコレクションは、平均化、スイッチング、ヘッジのエキスパート アドバイザーという 3 つの主要なコンポーネントで構成されており、それぞれがさまざまな取引シナリオに合わせた明確な利点を提供します。
この EA は、市場の標準的なリスク管理戦略を発展させたものです。
https://www.mql5.com/ja/blogs/post/756961
1.「平均化アシスタント」EA: MT4: https://www.mql5.com/ja/market/product/115468 MT5: https://www.mql5.com/ja/market/product/115469 2.「スイッチングアシスタント」EA: MT4: https://www.mql5.com/ja/market/produc
FREE

FREE

This indicator evaluates the market sentiment using raw price action measurements, and it is an amazing trading confirmation. It can be used to take a trend-trade approach or a contrarian approach using reversal patterns. [ Installation Guide | Update Guide | Troubleshooting | FAQ | All Products ] Find early reversals Confirm short-term trades Detect indecision on the market Take contrarian trades near support and resistance levels Trade inside bars confirmed by overall direction of the market T
FREE

English : A GF_support+MA.mq4 indikátor átfogó eszközként szolgál a kereskedési döntések támogatására a MetaTrader 4 platformon. Fő funkciója, a LookBackPeriod beállítás lehetővé teszi a kereskedők számára, hogy beállítsák a támogatási és ellenállási szintek kiszámításához használt időszak hosszát. Ez a paraméter határozza meg az elemzési periódus hosszát a gyertyákban, ami döntő fontosságú a piaci csúcsok és mélypontok azonosításához, ezáltal pontosan megrajzolja a támasz- és ellenállásvonala
FREE

FTUイディオテック このインジケーターはMT4プラットフォーム用で、単独で使用できますが、他のインジケーターや戦略と組み合わせるのが最適です。 macd、adxなどの様々なインジケーターを組み合わせて矢印を描き、エントリーやトレンド転換を示唆 YouTube で短い紹介ビデオをご覧ください: https://youtu.be/lCRJ3mFNyOQ インジケーターの特徴: 矢印の販売と購入 視覚と音による警告 トレンド継続 / 早期トレンド転換シグナル 新機能: 履歴内のバーの数を制限する バーから矢印までの距離を変更する 使用法: このインジケーターは、ほとんどの資産グループ、外国為替、商品、指数などで使用できます。 すべてのタイムフレーム、再描画なし、高速読み込み 私の FTU Predictor と組み合わせると、確実に優位性が得られます。 いくつかのアドバイス: 資金管理と規律が鍵であり、単一の戦略や指標が成功をもたらすことはありません。損失は発生するものであり、それをどのように回復するかを理解することが重要です。小さな勝ったり負けたりして、市場に恩返しすることがすべての日
FREE

The Automated EA program trades a basket of three currency pairs at the same time on the same account in a Fully Hedged Formation. The strategy is based on three currency pairs being traded concurrently when their prices are out of sync with each other to earn a profit. The program does not rely on latency between multiple accounts. The program is a fully automatic program requiring no user interaction once set up on a chart of choice. The program closes the basket of trades once the Profit Targ
FREE

With this system you can spot high-probability trades in direction of strong trends. You can profit from stop hunt moves initiated by the smart money!
Important Information How you can maximize the potential of the scanner, please read here: www.mql5.com/en/blogs/post/718109 Please read also the blog about the usage of the indicator: Professional Trading With Strong Momentum.
With this system you have 3 reliable edges on your side: A strong trend (=high probability of continuation) A deep pu

Note : The slow loading of the indicator issue has been addressed . This new version loads fast and does not slow the platform.
Version 1.3 : We have updated the indicator to include an historical bar scanning option . So instead of scanning all bars in the history (which can make the indicator slow sometimes ) , you can select the maximum number of bars it can scan which can increase the performance and make the indicator faster.
This indicator scans the 1-3 Trendline pattern . The indic

The Multi-Timeframe High Low Points (MTF High Low Points) indicator is a powerful tool for traders using MetaTrader 4 (MT4) to analyze price movements across different timeframes. This versatile indicator helps traders identify significant support and resistance levels by displaying the highest and lowest price points within a specified number of bars on multiple timeframes simultaneously. Key Features: Multi-Timeframe Analysis: MTF High Low Points allows traders to monitor high and low price le
FREE

As per name Strength, This Indicator is a affordable trading tool because with the help of Popular Developers & Support of M Q L Platform I have programmed this strategy. I tried to input different types and different periods of Calculation regarding Support Resistance, Trends, Trend lines, Currency Strength, Oversold and Overbought Indications for good results. Furthermore, I have also care about Adjustable Settings So Trader can easily get in touch with market in another way also. What
FREE

MeetAlgo Asian Scalper is an Expert Advisor that uses range breakouts strategy to enter trades when the market is the most quiet. It will scalp the market for small price deviations. This EA will need a good broker with small spread to work successfully. It is fully optimized for AUDCAD, EURAUD, GBPAUD, GBPCAD, GBPCHF and GBPUSD . The trades are based on several indicators and it's not a tick scalper EA. It need 1:300 leverage minimum, and a low spread broker. It is recommended to use a low spre

Grid Engulfing MT4 is designed with a engulfing candle for entry points.
Please give me 5 stars reviews, than I will be maintain & update this free EA for longtime or all of time. I am promise.
Recommendations:
Currency pair: ALL PAIR CURRENCIES Timeframe: M5 Minimum deposit currencies : $250 ($500 recommended) Account type: Raw or zero spread accounts IMPORTANT: It is very important to use LOW SPREAD accounts for best results !
setfile : normal mode : https://c.mql5.com/31/1044/grid
FREE

Master Candle (MC) Indicator automatically detects "Master Candles", also known as "Mother Candles", i.e. candle that engulf several candles that follow them. See screenshots. You can choose how many candles Master Candle should engulf. By default it is set to 4. Feel free to change colour and thickness of lines as it suites you.
I find this indicator to be very useful to identify congestions and breakouts, especially on 60 minutes charts. Usually if you see candle closing above or below "Mast
FREE

Daily pivot are relatively important in trading. This indicator have options to select 5 commonly use pivot point calculations. User input Choose Pivot Point Calculation ( Method Classic, Method Camarilla, Method TomDeMark, Method Fibonacci or Method Woodies. ) Choose Applied Timeframe for the calculation (M5, M15, H1, H4, D1, W1 etc) Can be attached to any timeframe Choose color of Pivot point For MT5 version, please refer here: https://www.mql5.com/en/market/product/38816
FREE
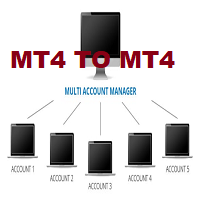
This tool allows you to automatically copy your orders between two or more METATRADER 4 platforms in same computer.
Settle the issuer of orders in Principal and the receiver of orders in Copieur To use it, add the script on both platforms, activate the auto trading button for the order copier. Principal=main Copieur=copy
it is very simple and does not need to add dll or csv . GOOD LUCK
FREE

Trend line Trader Ultimate EA
A "Professional Trading Panel" that every experienced and beginner manual trader needs it.
"Trend Line Trader Ultimate EA" makes it easy to never miss an opportunity of a good point to open positions. Demo version doesn't work due to programmatic limitations. Please watch videos and images for more information.
Key Features of Trend line Trader Ultimate EA:
Fully graphical interface. Extremely precise and reliable. Risk Manager , Lot calculator , Trailing Stop
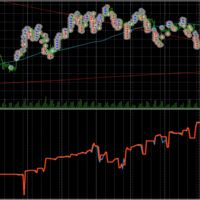
Graph shows your balance and equity in real time similar to the tester graph which is nice to see your real progress vs tester graph. This code was copied from mql5.com, it was free and it works im just putting it here to make it easier for us :-) https://www.mql5.com/en/code/13242
https://www.mql5.com/en/code/8454 .. original code
//+------------------------------------------------------------------+
//| Equity Monitor |
//| Monitori
FREE

Introducing the Super Pivot and Fibo Indicator: Your Ultimate Trading Companion Are you ready to take your trading to the next level? The Super Pivot and Fibo Indicator is here to revolutionize your trading strategy. This powerful tool combines key elements such as pivot points, Fibonacci retracement and extension levels, high-low values, and Camarilla points to provide you with a comprehensive and accurate analysis of the market. Key Features: Pivot Points: Our indicator calculates daily, weekl
FREE

[各指標の偏差MT4]は18個の指標の集合であり、そのうちの1つを任意に選択して計算に参加させることができます。それは各指標の偏差形を計算することができアラームを促すことができます。
パラメータ設定の説明
[指標]は、計算に参加する18の指標のうちの1つを選択することです (このパラメーターは非常に重要です) 。
[period]は各指標に共通の周期です。
[方法]はいくつかの指標のMAモードです。
[Apply_to]はいくつかの指標の適用価格です。
[Fast_EMA] [Slow_EMA] [MACD_SMA] [K_period] [D_period] [Slowing]これらはいくつかの指標に必要なパラメータですが、これらのパラメータを必要とする指標はほとんどありません。
[Forward_disparity]は、Kラインから現在のローまたはハイまでの最小距離です。
[Forward_count]は前方検索の最大数です。
[***表示形式***]下向きは矢印と線のサイズと色を設定することです。
[alert_NO_OFF]:これはア
FREE

The Monday EA trades on Mondays depending on price movement on Fridays. Its aim is to take 10-20 points of profit and leave the market. This strategy works from March 2014. Currency pairs are EUR/USD and GBP/USD. For GBP / USD trading on the CCI indicator is recommended not to use Time frame is daily D1 Settings: Sig_Open1 = true; - if true, the EA trades on Mondays StartTime = "00:00"; time to start trading (applies only to "Sig_Open1")
Sig_Open2 = true; - enable only on EUR/USD (works only on
FREE

We present to you the latest generation of Auto-Trading Robots exclusively for the Gold market (XAUUSD). This is EA Honey Gold with a unique trading strategy that is programmed to simulate Price Action strategies, price models, and Volume models to execute Scalper trades with high probability. The EA has Stop Loss, Take Profit, Trailing parameters available to protect the account and optimize performance. Other parameters help you to fine-tune the system to fit your trading plan. The EA has been

GreenBoxインディケーター とは、 ダウ理論 を用いリアルタイムに 高値・安値を分析 し、 ダウ理論に基づいたトレンドラインを自動描画 したり、 押し安値や戻り高値をブレイク後の到達予測地点をBox形式で自動描画 するインディケーターです。FXやGoldなどの様々な銘柄で機能します。 高値・安値はnBarsパラメーター(初期値=5)で決まりますが、対応する移動平均線(nBarsの4~5倍のSMAやEMA)を同時に表示するとトレンド転換の様子がより分かり易くなります。
(無料のGreenBoxのデモ版をダウンロードして、 いつもトレードで利用している移動平均線 と それに対応するnBars値(=移動平均線÷(4~5))のGreenBox で効果があるか試してみて欲しいです。) nBars=5 -> 20SMA, 21EMA, 25SMA, 25EMA nBars=13 -> 55EMA, 52SMA nBars=34 -> 144EMA, 136SMA
<参考> ver.1.9で大幅に改善した通知機能を活用することで、 音声実況解説(GreenBoxがリアルタイムに各種分析
Highly configurable Williams %R indicator. Features: Highly customizable alert functions (at levels, crosses, direction changes via email, push, sound, popup) Multi timeframe ability Color customization (at levels, crosses, direction changes) Linear interpolation and histogram mode options Works on strategy tester in multi timeframe mode (at weekend without ticks also) Adjustable Levels Parameters:
Williams %R Timeframe: You can set the current or a higher timeframes for Williams %R. William
FREE

Entry Logic The EA (Expert Advisor) will monitor price movements (M5, M15, H1, H4) during the specified input period. If these price movements exceed the input parameters, an entry will be executed. Take Profit (TP) = 50 pips Stop Loss (SL) = 50 pips Maximum Order Quantity = 1 To facilitate profit loss recovery, the robot offers the option to increase the lot size in the next entry (True/False choice).
The best pair GBPUSD / EURUSD
TF M5
Set file (default)
FREE

STOCH AND RSI ALERT https://www.mql5.com/en/users/earobotkk/seller#products (I have created a dashboard from this product, please take a look by clicking here ) (I have also created an EA from this product, NOW user can go automation, click here ) P/S: If you like this indicator, please rate it with 5 stars in the review section, this will increase its popularity so that other users will be benefited from using it. This indicator notifies and draws an arrow on the chart whenever the main sto
FREE

よって上りと下りが表示され、弾倉を開いたり閉じたりすることができます。
パラメータリストの説明:
extern int Price=0;/指標初期計算平均価格
extern int Length=20;/指標計算平均周期は、MAの平均周期に相当する。
extern int Displace=0
extern int Filter=0//フィルターカラム数
extern int Color=1;/上り色
extern int ColorBarBack=0;/下り色
extern double Deviation=0.0;/逸脱
extern int BarsToDraw=2000;/柱の数を計算する
extern book AlertsOn=true;//オープンまたはクローズボックスのヒント
extern int RemindFrequency=60;/フレームの周波数は、デフォルトでは1分間に1回です。
FREE

This is a modified Fractals indicator. It works similar the original Bill Williams' indicator, and is additionally enhanced with the possibility to change the top radius, in contrast to the standard radius of 2 bar. Simply put, the indicator checks the top and if it is the minimum/maximum in this radius, such a top is marked by an arrow. Advantages Adjustable radius. Use for drawing support and resistance levels. Use for drawing trend channels. Use within the classical Bill Williams' strategy or
FREE

RSI Candle Signal Indicator will change bars’ color when set overbought or oversold levels reach.
How to Use RSI Candle Signal Uptrend/Downtrends - RSI may be used to detect trending markets. For example, the RSI may stay above the mid line 50 in an uptrend. Top and Buttoms - RSI may help in identifying the tops around the overbought readings (usually above 70), and the bottoms around the oversold area (usually below 30). Divergence - divergence occurs when RSI directional movement is not c
FREE

または M oving A verage S upportコマンド R esistance バンド 。
MASRバンドインジケーターは、サポートレベルとレジスタンスレベルとして連携する2つのバンドに囲まれた移動平均です。統計的に、MASRバンドには93%の確率で価格キャンドルが含まれています。ステップ単位での計算方法は次のとおりです。 1.最初のステップは、X期間の最高値(HHV)と最低値(LLV)を計算することです。
2. 2番目のステップは、HHVをLLVで割って、それらの間の距離をパーセンテージで取得することです。このステップの結果をMASRフィルターと呼びます。
3. MASRフィルター=合計((HHV / LLV)-1)/バーの数
4.移動平均抵抗のショートカットであるアッパーバンドをMARと呼びます。移動平均サポートのショートカットである低帯域MASと呼びます。バンド間の移動平均は、センターラインと呼ばれます。
5. MAR = MASRセンター+(75%xMASRフィルターxMASRセンター)
6.MASRセンターは移動平均です。

The EA is optimized for the most conservative trading! Aggressive settings Attention!!!!! The EA is configured and does not require optimization, testing and trading strictly on XAUUSD. For a more aggressive trading method after the purchase, please contact your personal messages to get the settings!
Advisor monitoring
HOW TO CHECK: Select timeframe M5. Set your initial deposit at 1000. Use the every tick method Problems with the test? Write me
To open (close, reverse) positions, th
FREE

Advantages: Based on classic indicators - ATR, Moving Average Determines the trend / flat in the market by coloring the histogram with the appropriate color Arrows indicate confirmed signals It is an excellent filter for channel strategies (by extremes)
Settings:
Наименование Описание настройки Period of Flat Detector Number of bars / candles for analysis Period of EMA Period of EMA (Moving Average) Period of ATR Period of ATR (current timeframe) Coefficient of deviation Coefficient of devia
FREE
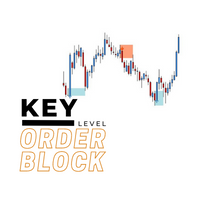
The key level order block indicator automatically draws order-blocks for you on the chart. The indicator compliments any strategy and can also be used as an independent tool. It can work with smart money concepts, harmonic patterns, supply and demand, flag patterns, Quasimodo strategy and many more.
Advantages
The key level order block DOES NOT RE-PAINT, giving you confidence when a signal appears and also helps when looking back. The key level order block includes an on/off button on th
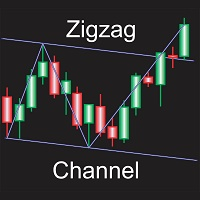
Automatically draws channel base on zigzag, with option to draw zigzag based on candle wicks or close prices. All zigzag parameters can be adjusted in settings, option to display or hide zigzag also available, every other adjustable settings are self explanatory by their name, or at least so I believe. Only download this indicator if you need a program to automatically plot channels for you based on zigzag of any specific settings.
FREE

Draw and Sync Objects Multiple Charts 1. Draw objects by key press. ( You must: 1. Press Function key => 2. Click where you want to draw => 3. Draw it => 4. Press ESC to complete). (If you don't want to draw after pressing function key, you must press ESC to cancel). 2. Developing : Sync selected objects to multiple charts by button. 3. Developing: Hide objects that do not belong to the current symbol (Objects drawn with this indicator will belong to the symbol they are plotted
FREE

Basket trading is very interesting for those who are familiar with it. It is also very profitable if you know your way round BUT can be very destructive to anyone’s account if care is not taken. However, there are Basket traders all around making good incomes with it with ease. What it can do: This utility is created for them to remove the stress of opening trade on each of the currency symbol group. At just a click, it opens the symbol’s entire group of currency pair ORDERS in any of the direct

常に利益を出し続ける5つ星FXトレーダーになりたいですか? 1. 私たちのシンプルな取引 システムの 基本的な説明と 2020年の主要な戦略の更新を 読む 2. 購入時のスクリーンショットを送信して、私たちの独占取引チャットへの個人的な招待状を取得 します。
Lighthouse は、驚くほど精密で信頼性の高いサポート&レジスタンス指標です。
最も重要な取引レベルを表示し、その関連性に応じて描画します。
レベルが明らかに破られると、その役割と色を 変えます。 サポートがレジスタンスになり、その逆も然りです。 主な機能 基調となる時間枠に自動調整 重要な支持線と抵抗線のみを表示 レベルが明らかにブレイクした場合、グラフィカルに即座に反応 薄く描かれたSRレベルより、厚く描かれたSRレベルの方が重要である
一般設定 分析モード: 3つの異なるスキャンモード(日中、中、高時間枠)から選択するか、デフォルトで設定されている自動調整を使用します。
自動モードは、基本となるチャートの時間枠に基づいて、使用する分析モードを調整します。 センシティブモード

This indicator is designed to find the difference in RSI price and indicator. This indicator shows the price and indicator difference on the screen. The user is alerted with the alert sending feature. Our Popular Products Super Oscillator HC Cross Signal Super Cross Trend Strong Trend Super Signal
Parameters divergenceDepth - Depth of 2nd ref. point search RSI_Period - Second calculation period indAppliedPrice - Applied price of indicator indMAMethod - MA calculation method findExtInt
FREE

または「MAC」。 これは、トレンドをキャプチャしてトレードするのに役立つように設計されたインジケーターです。この指標の背後にある考え方は、次のステップで説明できます。
移動の速い平均エンベロープを描画します。 移動の遅い平均エンベロープを描画します。 MACアッパーバンドは、両方のエンベロープの高値の間の最大値です。 MAC下限帯域は、両方のエンベロープの下限間の最小値です。 MACヒストグラムクラウドは、2つのバンド間の距離を埋めて、方向の変化を示します。 青い雲は上昇傾向を示し、赤い雲は下降傾向を示します。 次のブログを読んで、MACバッファーを使用して独自のEAまたはスキャナーを構築する方法を確認してください。
https://www.mql5.com/en/blogs/post/734293
MACの使い方
トレンドの方向性を特定するのに役立つフィルターとしてMACクラウドを使用します。 通常の取引ツールを使用してMACクラウドの方向に取引し、誤ったシグナルを可能な限り排除します。 提案されたエントリ矢印を使用して、開始する強力なトレンドポイントを見つ

ボリュームパーセンテージ折れ線グラフは、 ボリュームデータの洞察を提供するために設計されたインジケーターです。各キャンドルの合計ボリューム情報を取得し、それを全体ボリュームのパーセンテージとして表示します。このインジケーターはこのデータを別のウィンドウにグラフ線として表示するため、ユーザーは買い手と売り手の争いを簡単に視覚化できます。 このインジケーターの重要な機能の 1 つは、ボリュームのパーセンテージをグラフ線として表示できることです。売り手と買い手の間のボリューム分布を表すことにより、市場のダイナミクスに関する貴重な洞察が得られます。トレーダーは、表示されたパーセンテージに基づいて、売買圧力の相対的な強さを迅速に評価できます。 このインジケーターは、そのシンプルさとユーザーフレンドリーな性質で際立っています。最小限のパラメータ設定が必要なため、複雑な調整を行わずに取引戦略に簡単に統合できます。パラメーターに関して、ユーザーはボリューム ラインを描画する希望の期間を指定できるため、関心のある特定の間隔に焦点を当てることができます。 全体として、出来高パーセンテージ折れ線グラフは、ト
FREE
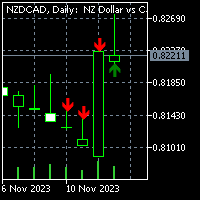
For MT5 version please click here . Introduction Most traders use candle patterns as a confirmation tool before entering a trade. As you know there are lots of candle patterns out there. However I realized most of them can be generalized in simple rules. So I developed my own candle pattern(Although I cannot say for sure this is mine). pattern description The pattern consists of three consecutive candles. This is true for most of the patterns out there (considering there is a confirmation nec
FREE
MetaTraderマーケットはトレーダーのための自動売買ロボットやテクニカル指標を備えており、 ターミナルから直接利用することができます。
MQL5.community支払いシステムはMetaTraderサービス上のトランザクションのためにMQL5.comサイトに登録したすべてのユーザーに利用可能です。WebMoney、PayPal または銀行カードを使っての入金や出金が可能です。
取引の機会を逃しています。
- 無料取引アプリ
- 8千を超えるシグナルをコピー
- 金融ニュースで金融マーケットを探索
新規登録
ログイン