YouTubeにあるマーケットチュートリアルビデオをご覧ください
ロボットや指標を購入する
仮想ホスティングで
EAを実行
EAを実行
ロボットや指標を購入前にテストする
マーケットで収入を得る
販売のためにプロダクトをプレゼンテーションする方法
MetaTrader 4のための新しいエキスパートアドバイザーとインディケータ - 269

Now there is no need to check volatility on third-party websites in order to determine the average movement rage of a certain currency pair. The Truly Volatility indicator is designed for determining volatility for the specified period and is displayed in a separate window as a histogram and line. If attached to a chart with the Н1 timeframe, the indicator displays the average price movement for each hour (from 0 to 23) based on the history data. On the D1 timeframe it displays the average movem
FREE

This indicator is an interpretation of the values of the classic indicator - RSI. A filter is used to smooth the sharp fluctuations of the indicator values, eliminating the weak changes and focusing the trader's attention on strong fluctuations of values. The indicator is not redrawn on completed bars. For greater efficiency of this indicator, it should be used in conjunction with the indicators that identify the trend direction, as well as support/resistance levels. Signals: Histogram crossing
FREE

The Relative Momentum Index (RMI) was developed by Roger Altman, and introduced in his Feb 1993 article in Technical Analysis of Stocks & Commodities magazine. As its name suggests, Relative Momentum Index adds a momentum component to the traditional RSI, designed to increase reliability by decreasing spurious oscillations between defined overbought and oversold levels. This Relative Momentum Index indicator has 2 components. A change in RMI line color provides a warning signal for an upward or

EMA Separation Coefficient reflects the separation between short-term and long-term exponential moving average trend resistance, as well as the direction of the current movement. Pay attention to potential crossover points when the coefficient approaches zero, this may indicate an upcoming breakout or reversal. Wait for confirmation of the trend before entering the trade, and exit when the coefficient forms a max (for calls) or a min (for puts). This is a small tool to help visualize the differe
FREE

EMA Separation plots 2 exponential moving averages, and a fill between them. The fill is colored differently according to an uptrend (short period EMA above long period EMA), or a downtrend (short period EMA below long period EMA). This is a small tool to help visualize the difference between long and short period averages. We hope you enjoy! EMA Separation can also be paired with our free EMA Separation Coefficient
Parameters Short period (Default=10): # bars used to calculate short period EM
FREE
SRB Grid is a grid trading Expert Advisor, which uses standard indicators Stochastic, Rsi, BBands for entries. Set_Name - the name of the set file TypeTrades - Expert Advisor operation mode MaxSpread - maximum allowable spread value MinLeverage - minimum leverage filter MagicNumber - unique ID for the EA's orders Slippage - slippage in points AutoMMBalance - automated money management. Example : BaseLotSize = 0.01, and AutoMMBalance = 1000, with a deposit of 5000$ the lot of the first order will
FREE
Expert Advisor for trading the GBP/USD on the M5 timeframe. It is based on the strategy of "waiting out", the market entry (and exit) points are determined on the basis of correlation of a number of indicators. The trading volume for opening a position depends on results of previous trades. It is possible to limit the amount of risk (AutoMM parameter). It is also possible to set the maximum spread, above which the EA will automatically pause trading (MaxSpread parameter).
Settings TakeprofitS

Professional and highly customizable utility for automated trading. It can become an indispensable to any trader regardless of the skills. It will help to save the time that would be required for daily routine activities and it will allow to develop custom strategies. The utility can also work manually opened orders and orders opened by any other EAs. This can be applied to attempt to recover the losing trades or even save the trader form losing the deposit. The utility allows to automate the tr

Four-layer Neural Network Expert Advisor based on perceptrons that analyze the opening, closing of candles, the maximum and minimum price for a given period of history. The moving average serves as an additional filter. Several parameters are used in optimization of the perceptron, weight coefficient " x1 – x4 ", optimize from 5 to 100 with step 5 and " y1 – y4 " bar coordinate, optimize from 2 to 50 with step 2. Optimize on "every tick" on a history of 2–3 months. The feature of the EA is that

Simple and powerful CSM (Currency Strength Meter) Currency strength meter is the indicator you need to identify the current actual trend based on a unique calculation, which is generally used as another fundamental analysis for those who are not capable of reading the fundamental clearly. Currency strength meter will read the current strength of related currency pair (Forex) where generally consist of AUD, NZD, CAD, CHF, JPY, EUR, GBP, and USD for the main major currency.
Feature Easy reading
The trading system is based on scanning for entries of large limit buyers or sellers. When the price fluctuates in a narrow range for a long time, it can be assumed that there are limit orders of major participants placed at that location. The feature of the EA is that it has the ability to change the strategy of closing and maintaining orders right from the built-in panel on the chart. For example, if placing pending orders is enabled, then all trailing functions will work as a whole based on t

The Expert Advisor with strategy based on the Bollinger Bands indicator. When the price is above or below the Bollinger Bands and the channel expands by the specified range, a trade is opened. For example, if the Ask price is less than the lower band of the indicator and the difference between the upper and lower bands of the indicator exceeds the distance of Delta, the EA will open a buy. For sell trades it is the opposite: if the Bid price is greater than the upper band of the indicator and th

The Expert Advisor with strategy based on the Moving Average indicator. When the Bid price is above or below the MA indicator by the specified range, a trade is opened For example, if the Bid price is less than MA and the difference between the price and the indicator line is equal to or greater than the Deviation distance, the EA will open a buy trade. For sell trades it is the opposite: if the Bid price is greater than MA and the difference between the price and the indicator line is equal to

"The Squeeze indicator attempts to identify periods of consolidation in a market. In general the market is either in a period of quiet consolidation or vertical price discovery. By identifying these calm periods, we have a better opportunity of getting into trades with the potential for larger moves. Once a market enters into a "squeeze," we watch the overall market momentum to help forecast the market direction and await a release of market energy." The StdATR Squeeze Channel combines standard

The system is based on four indicators, namely Moving Average, Bollinger Bands, Stochastic and MACD histogram. Sell signal: the candle opening price is above the middle band of Bollinger Bands, the candle opening price is above the MA, the current price is lower than the MA, the main line of the Stochastic is lower than the signal line, the MACD histogram is lower than the previous value. Buy signal is the opposite. The feature of the EA is that it has the ability to change the strategy of closi
Модифицируйте тейк профит и стоп лосс сети ордеров с помощью мыши. Перетащите скрипт на график левой кнопкой мыши и отпустите. Скрипт выставляет всем рыночным и отложенным ордерам раздельно, единый стоп лосс и единый тейк профит, используя величину цены в точке окончания перетаскивания.
Входные параметры Buy or sell - Ордера какого типа подлежат модификации. Возможны два варианта: All BUY - все ордера на покупку All SELL - все ордера на продажу По умолчанию значение этого параметра All BUY. Wh

MT4にも標準で搭載されているZigZagインジケーターの頂点を更新(ブレイクアウト)した場合に、ブレイクアウトした方向に仕掛ける順張り型のEAです。 勝率は高くありませんが、小さい損切りで耐えながら急に大きく動く相場がくるのを待って、動いた時に一気に利益を上げる「損小利大」のEAになります。 対象通貨ペアはEURUSDで時間軸はM15とH1です。(M30でも稼働しますがパフォーマンスはかなり落ちます) 無料の試用版 を用意いたしましたので、まずは 無料版 をご利用になって「良い」と思っていただけましたらご購入くださいませ。 なお、私のブログ「FX研究日記」ではZigzagBreakoutEAを詳細に説明しておりますので、そちらもご覧ください。 当ブログ人気記事「zigzagブレイクアウト」のEA販売開始です! ※実は私のブログからの方が安く買えます。(ソースコード販売もあります) [パラメーター] Magic :マジックナンバーです。同一口座上に他のEAと重複しないように設定してください。 EAComment :口座履歴等に表示できるコメントです。分かりやすい文字列に変更できま

The Margin Level Notifier is a simple but a very useful and reliable Indicator which notifies you in case of a small Margin Level to avoid a sudden margin call and a risky high draw down. The Indicator does not trade, it is intended to monitors your account. Does the margin level of your drop under a preset minimal level, the Indicator sends immediately notifications per email, per push on your smartphone and per popup with audio alarm in your MetaTrader. The Indicator can be attached to any cha

At the very least, this indicator is able to entertain you. It builds a moving line based on interpolation by a polynomial of 1-4 powers and/or a function consisting of a sum of 1-5 sine curves. Various combinations are possible, for example, a sum of three sine curves about a second order parabola. The resulting line can be extrapolated by any of the specified functions and for various distances both as a single point at each indicator step (unchangeable line), and as a specified (re-painted) f

This is a professional Expert Advisor with the highly customizable algorithmic trading panel. The entry strategy is based on a breakthrough of a price channel that tracks a symbol volatility within a specified time interval. When touching or crossing the channel line, a deal towards the price movement is opened. The channel has two parameters – indentation of the price and modification time. After a specified time, the channel is reconstructed based on new prices. The EA is able to change the cl

The indicator displays trend in the form of histogram. It is a non-repainting indicator. The indicator notifies currency trend by means of a pop-up window, sound, email and push notifications. This is a multiple time frame indicator.
Parameters Time Frame - Chart Time Frame - select time session; zero is the current timeframe (Chart Time Frame cannot be lower than the current time interval). Notification - select a notification, Alert On Crossing Zero Level, Message Alert, Sound Alert, Email A
The Crossover Alert System is a highly configurable MT4 indicator which incorporates a fully automated alert system for potential trading signals generated by Stochastic Crossovers. The system has the following features: 'Touch' alert option - where the stochastics momentarily touch above or below the trader defined trigger thresholds 'Printed' alert option - where the stochastics have acually formed a crossover in the last chart period. Email alert option Configurable High and Low Trigger Zones

インジケーターは現在のシンボルの利益(損失)を表示します。 線を自由にドラッグ&ドロップして現在の損益を表示できます。
パラメーター
Calculation in money or in points — 損益をポイントまたは金額で計算します。 Add pending orders to calculate — 計算では未決注文を考慮します。 Magic Number (0 - all orders on symbol) — 特定の注文を評価する必要がある場合のマジック ナンバー。 Offset for first drawing (points from the average price) — 最初の開始時の平均価格からのラインのオフセット。 Decimal places for calculating the Sum — 合計を表示するための小数点以下の桁数。 Decimal places for calculating the Percentage — パーセンテージを表示するための小数点以下の桁数。
Tuning チューニング Color of the
FREE

Trade Copier Agent は、複数の MetaTrader(4/5) アカウント/端末間で取引をコピーするように設計されています。 このツールを使用すると、プロバイダー (ソース) または受信者 (宛先) として機能できます。すべての取引アクションは、遅延なくプロバイダーからレシーバーにコピーされます。 このツールを使用すると、0.5 秒未満の超高速のコピー速度で、同じコンピューター上の複数の MetaTrader ターミナル間で取引をコピーできます。 Trade Copier Agent インストール & 入力ガイド コピーを開始する前、または注文がないうちに、プロバイダー アカウントで設定を適用してください。
注文中の変更は、受取人のアカウントに影響します。 例: プロバイダー アカウントが買い注文を適用し、その後、受信者アカウントのすべての買い注文を無効にすると、決済されます。
EA追加URL( http://autofxhub.com )MT4端末(スクリーンショット参照) に関する通知を受け取りたい場合 。 MT5 バージョン https://w

どんなツール(シンボル)でも、グラフのどんな期間でも、買いと売りのフィボナッチレベルの自動的な作成とフォローアップ。 FiboPlus は、次のものを表示している: アップかダウン方向、 ありそうな 値動きのフィボナッチレベル。 エントリーポイントは「アップ矢印」、「ダウン矢印」アイコンで示され、情報はボタンにて再度表示されている。(SELL, BUY) 0から100までのレベルで限られた直角的エリア。トレードは、一つのレベルから他のレベルへ(トレンドなし)。
特長 値動きの予測、市場エントリーポイント、オーダーのための stop loss とtake profit。 作成済みのトレードシステム。 管理ボタンは、フィボナッチオプションの度リラかを選択できるようにする。 買いか売りのオプションを非表示にする。 グラフの他の期間を参照する。 「+」と「―」ボタンは、レベルの自動的再計算しながらグラフを大きく・小さくする。 何のフィボナッチレベルでも。 何の色でも表示。 ボタンをグラフの便利な場所に移動。
パラメーター Language (Russian, English, Deu

The indicator draws lines based on the price Highs and Lows, as well as slant trend lines. Break through the trend line, High or Low usually indicates trend change (or continuation). Once the price moves through a line, and the candlestick closes, the indicator draws an appropriate arrow (also, you can enable alerts). This indicator is easy to use, but nevertheless, there are many trading strategies, which are based on a breakthrough of the trend lines. The number of candlesticks used to determi
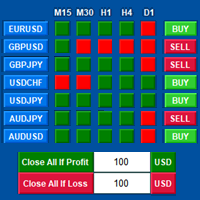
Tools designed for multi-currency trading.
You can customize which currency you want to trade, analyze up to 10 currencies by yourself. Note: This is demo version that you can test for free (Maximum Lot Size = 0.01) Full version can be found here: https://www.mql5.com/en/market/product/17793
Analysis method. (Refer to screenshot 1) Ultimate dashboard analyzes trend strength from six major time frames: M5, M15, M30, H1, H4, D1 Show the result in graphic format. You can identify which currenci
FREE
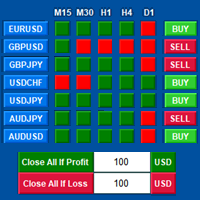
Tools designed for multi-currency trading.
You can customize which currency you want to trade, analyze up to 10 currencies by yourself. Note: Demo version for testing can be found here: https://www.mql5.com/en/market/product/17796
Analysis method. (Refer to screenshot 1) Ultimate dashboard analyzes trend strength from six major time frames: M5, M15, M30, H1, H4, D1 Show the result in graphic format. You can identify which currencies have the best strength, trend.
One click trading panel. (

"The Squeeze indicator attempts to identify periods of consolidation in a market. In general the market is either in a period of quiet consolidation or vertical price discovery. By identifying these calm periods, we have a better opportunity of getting into trades with the potential for larger moves. Once a market enters into a "squeeze," we watch the overall market momentum to help forecast the market direction and await a release of market energy." Modified TTM Squeeze Indicator is a modifica

The Meat EA is a fully automatic, 24-hour trading system. It trades based on analysis of market movement on the basis of a built-in indicator and the Moving Average trend indicator. The system is optimized for working with the EURUSD currency pair on the M30 timeframe. It is recommended to use an ECN/STP broker with low spread, low commission and fast execution. Signal monitoring Working currency pair/timeframe: EURUSD M30.
Advantages never trades against the market; the higher the risk, the h

The News Filter based EA Controller (NFC) is a very convenient utility to control the live trading status of your Expert Advisors during important news events. The NFC was programmed to prevent all Expert Advisors of live trading during significant news events. The NFC is resource-efficient and uses the Forex Factory Calendar. It is not necessary to set offset hours dependent on your broker, it will be done by the NFC. The NFC was successfully used and tested under MetaTrader 4 on a personal com
FREE

The News Filter based EA Controller (NFC) is a very convenient utility to control the live trading status of your Expert Advisors during important news events. The NFC was programmed to prevent all Expert Advisors of live trading during significant news events. The NFC is resource-efficient and uses the Forex Factory Calendar. It is not necessary to set offset hours dependent on your broker, it will be done by the NFC. The NFC was successfully used and tested under MetaTrader 4 on a personal com

現在31%オフ!
初心者やエキスパートトレーダーに最適なソリューション!
このインジケータは、独自の機能と秘密の数式を組み込んだ、ユニークで高品質かつ手頃な価格のトレーディングツールです。たった1枚のチャートで28の通貨ペアのアラートを表示します。新しいトレンドやスキャルピングチャンスの引き金となるポイントを正確に把握することができるので、あなたのトレードがどのように改善されるか想像してみてください!
新しい基本的なアルゴリズムに基づいて構築されているため、潜在的な取引の特定と確認がより簡単になります。これは、通貨の強さや弱さが加速しているかどうかをグラフィカルに表示し、その加速のスピードを測定するためです。加速すると物事は明らかに速く進みますが、これはFX市場でも同じです。つまり、反対方向に加速している通貨をペアにすれば、利益を生む可能性のある取引を特定することができるのです。
通貨の勢いを示す縦の線と矢印は、あなたの取引の指針となるでしょう。 ダイナミックマーケットフィボナッチ23レベルはアラートトリガーとして使用され、市場の動きに適応します。もしインパルスが黄色

This indicator is a conventional analytical tool for tick volumes changes. It calculates tick volumes for buys and sells separately, and their delta on every bar, and displays volumes by price clusters (cells) within a specified bar (usually the latest one). The algorithm used internally is the same as in the indicator VolumeDelta , but results are shown as cumulative volume delta bars (candlesticks). Analogous indicator for MetaTrader 5 exists - VolumeDeltaBars . This is a limited substitution

Dax Scalping Bracket is a new generation Expert Advisor Panel. This a very professional tool for SCALPING. The usability makes this tool an excellent ally for FAST operations of SCALPING on Index instruments and Forex market. The main feature of this EA is the ability to open multiple operations with a single click. Each position is autonomous and you can set different take profit and stop loss for each position. Special functionalities: STOP MOVE to manage your stop chasing the price BREAK EVEN

Operation Principles The Expert Advisor trades EURUSD and GBPUSD on all timeframes. The robot calculates price movement rate (points per seconds) and defines a trend direction using two closest bars. If the price movement rate reaches the specified value, a market order with the specified TakeProfit, StopLoss and lot volume are opened in the direction of a trend. The configurable TrailingStop is activated after the price reaches the profitable area. The EA opens a single order. No next order is

"Battles between bulls and bears continue to influence price development long after the combat has ended, leaving behind a messy field that observant technicians can use to manage risk and find opportunities. Apply "trend mirror" analysis to examine these volatile areas, looking for past action to impact the current trend when price turns and crosses those boundaries." - Investopedia.com RSI Mirrors and Reflections is a robust technique using multiple RSI periods, mirrors and reflections based o

"Wouldn't we all love to reliably know when a stock is starting to trend, and when it is in flat territory? An indicator that would somehow tell you to ignore the head fakes and shakeouts, and focus only on the move that counts?" The Choppiness Index is a non-directional indicator designed to determine if the market is choppy (trading sideways) or not choppy (trading within a trend in either direction). It is an oscillating indicator between -50 (very trendy) and +50 (very choppy). There are man

Fano Factor is a measure of the dispersion of the probability distribution of Fano noise, named after Ugo Fano, an Italian-American Physicist. Fans has applications in Particle Detection and Neuroscience for describing variability in complex multivariate data. In trading, we have discovered Fano can be used as a 'signal to noise' ratio, and can indicate the strength of price movements (i.e., price movement is greater than predicted by purely statistical measures). Like standard deviation, Fano F

1.毎月、毎週、および毎日のピボットは、各期間の開始データと終了データを使用して計算されます。
2.これにより、グラフ上に簡単な線が表示され、要点がどこにあるかを識別し、計算の誤差を減らすことができます。
3.インジケータは、ピボットの計算方法がわからなくても、楽器の主なピボットをすばやく定義するのに役立ちます。
あなたはより良い価格の位置を理解することができるようにあなたはまた、毎週と毎日のピボットを比較することができます。
5この指標は、あなたがより効果的に抵抗や支持に近いところで取引するのを助けます。
1. Maitsuki, maishū, oyobi mainichi no pibotto wa, kaku kikan no kaishi dēta to shūryō dēta o shiyō shite keisan sa remasu. 2. Kore ni yori, gurafu-jō ni kantan'na-sen ga hyōji sa re, yōten ga doko ni aru ka o shikibetsu shi, keisan
FREE

The present Expert Advisor is based on the "Ilan 1.6 Dynamic" EA which is widely used by the large number of traders and thus deserves increased attention from professional developers producing lots of advisor’s modifications. There are many variations of this advisor, each having its own pros and cons, but all these modifications are united by a common position averaging algorithm that is used to close a series of unidirectional orders at the total Take Profit level. I have created a modificati

The Rapid Tester indicator is a very simple tester for the Rapid binary options trading system and Rapid Expert . Its objective is constructing a balance line on history data and calculation of statistics during CALL and PUT deals performed by the Rapid trading system for any of the six financial instruments: EURUSD, EURCHF, GBPUSD, GBPJPY, USDJPY or XAGUSD. The tester requires at least 100 5-minute bars in the history of a trading instrument. However, in order to obtain reliable statistics, you
FREE

The indicator displays renko bars on a chart and uses them to create ZigZag indicator - trend lines connecting local price movement Highs and Lows. The indicator, in turn, is used to create AB=CD displaying potential price reversal points. Renko is a non-trivial price display method. Instead of displaying each bar within a time interval, only the bars where the price moved a certain number of points are shown. Renko bars do not depend on a time interval, therefore the indicator works on any time

The indicator calculates and displays renko bars using MA and PSAR data as well as provides buy/sell signals. Renko is a non-trivial price display method. Instead of displaying each bar within a time interval, only the bars where the price moved a certain number of points are shown. Renko bars do not depend on a time interval, therefore the indicator works on any timeframe without losing its efficiency. Buy signal forms when PSAR readings are moving down, MA is moving up, the price is closing ab
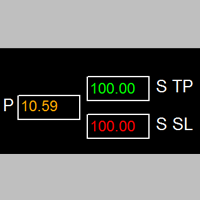
如果产品有任何问题或者您需要在此产品上添加功能,请联系我 Contact/message me if you encounter any issue using the product or need extra feature to add on the base version.
Session TakeProfit StopLoss is basically helping to set the take profit and stop loss in dollar for the total open orders (session). Once the total profit is greater than session_tp or less than session_sl, the EA will help to close all open orders acting similarly to a take profit/stop loss for a single order.
Inputs session_tp: session take profit s
FREE

Commodity Channel Index Message is an indicator for the MetaTrader 4 trading platform. Unlike the original indicator, this three in one version has a system of alerts that inform on market situation changes. It consists of the following signals: when the Main line crosses the levels of extreme zones and 50% level; when the Main line crosses the Trend line in the indicator window; Divergence on the last bar. Values of the middle and extreme levels and divergence zones are customizable.
Paramete

SH Trend Flow indicator is calculated based on advanced algorithm of several indicators. The algorithm provides highly reliable entry points, and its simple settings allow using it for any symbol and trading style. Signals are generated at the closing of a bar and are not repaint.
Parameters iPeriod - Period of the indicator xSmooth - Lower this value will smooth the indicator PopUpAlert - true/false to show pop up alert EmailAlert - true/false to send email notification
How to use this indi

This EA is tested on pairs: EURUSD, GBPUSD, USDCHF, USDJPY. Set different magic number for each pair. This EA uses RSI indicator to find signals. First order is opened when signal occurs. Next orders are opened when signal occurs and minimum distance from last trade is reached (pipstep). Buy and sell trades are closed separately or all together when overall profit is reached. Use on 15M timeframe.
Settings Lots - (default 0,1) - volume of the opened position MoneyManagement - risk of actual A

現在26%オフ
初心者やエキスパートトレーダーに最適なソリューション!
このインジケーターは、独自の機能と新しい計算式を取り入れた、ユニークで高品質、かつ手頃な価格のトレーディングツールです。たった1枚のチャートで28の為替ペアの通貨強度を読み取ることができます。新しいトレンドやスキャルピングチャンスの引き金となるポイントを正確に特定することができるので、あなたのトレードがどのように改善されるか想像してみてください。
ユーザーマニュアルはこちら https://www.mql5.com/en/blogs/post/697384
これが最初の1本、オリジナルだ! 価値のないクローンを買わないでください。
特別な サブウィンドウの矢印で強い通貨の勢いを表示 GAPがあなたのトレードを導く! 基準通貨や気配値が売られすぎ・買われすぎのゾーン(外相フィボナッチレベル)にあるとき、個別チャートのメインウィンドウに警告表示。 通貨がレンジの外側から反落した場合、プルバック/リバーサルのアラート。 クロスパターンの特別なアラート
複数の時間枠を選択可能で、トレンドを素早く

After a thorough work and search for the optimal values of each of the Expert Advisor's parameters, the most stable settings of the algorithms have been selected, which do not require over large history periods. The robot uses a universal trading strategy, allowing the use of the currency pairs EURUSD, GBPUSD, USDCHF, USDJPY and other pairs with low spread. The EA trades on a 5-minute timeframe , it uses levels defined automatically on the bases of multiple parallel price movement calculation me
Autolock Expert Advisor is based on the mathematical system with no indicators. The first order direction is specified in the settings, then the algorithm sets to work. The main operation principle - no averaging till the opposite order is closed by trailing. The EA uses averaging with martingale, trailing and stop orders. The product can be used as an assistant - select NOTRADE as the frist order type and magic = 0.
Settings
First order type – first order type. martingale mode – martingale t

Technical Dashboard is a great tool for quickest possible analysis of multiple currency pairs in terms of coherent conditions of 4 different indicators at the same time. The number of displayed symbols is 30 and the name of each symbol can be edited in the parameters, so we are able to analyze not only predetermined currency pairs, but also other ones, commodities, equities, indices, currency pairs with prefixes and suffixes etc. This analyzer is perfect for alert notifications through the MetaT

Operation principles The EA works on any timeframe. Currency pairs: EURUSD and GBPUSD. When launching the EA, the open time of two mending orders is set. This time corresponds with critical news releases (or it can be any time according to trader's needs). Before a news release time, for example 5 seconds prior to the release (customizable), the EA opens two pending BUYSTOP and SELLSTOP orders at a user-defined distance with specified stop loss and take profit values. If the price starts moving
Introduction Super Prediction System is the only indicator that does not show delayed trading signals, but shows them ahead of time! It gives you an opportunity to have the trading signals right in your MT4 sooner than other traders. This indicator does not repaint and never changes signals in the history! For all you can see in the history, the indicator will show exactly the same in real time. The indicator does not wait on the reaction of a new candle, but shows the signal (arrow) immediately

Relative Strength Index with advanced functionality recalculates (converts) the averaging period in accordance with the value of parameter Time Frame for lower chart time intervals (Multi-TimeFrame (MTF)). Unlike the standard indicator, RSI converter includes an alert system that notifies about changes in market situation, it consists of the following signals: Main line crosses levels of extreme zones (30%, 70%) and the level of 50%; The main line crosses one or two trendlines in the indicator w
The Rapid indicator is a ready binary options trading system . The system is designed for trading on a five-minute interval with the 15-minute expiration and with the payout at least 85%, it is designed for traders using web terminals and MetaTrader 4 platform. Available financial instruments: EURUSD, EURCHF, GBPUSD, GBPJPY, USDJPY and XAGUSD. This is a counter-trend system, i.e. it waits for the price reversal of a traded asset. The indicator signals are not redrawn, they appear after the close
トレンドウェーブは高度な取引ツールです。サポートとレジスタンスに基づくトレンドとカウンタートレードの指標。
トレンドウェーブはいつでも活発な取引ができるように設計されています トレンドウェーブは遅れていません 新しいキャンドルの冒頭に表示が表示されます
トレンドウェーブは インジケーターのウィンドウには、全体的な傾向を把握するためのSとRの実際の数が表示されます 白い線は瞬間的な傾向を示しています。 メインチャートウィンドウには、最後の有効なSとRを示す色付きの矢印が表示されます。これは、傾向を確認するのにも役立ちます。
トレンドウェーブは機能します 任意の時間枠 どんな楽器でも 任意のブローカーと
トレンドウェーブの機能 アクティブなR/Sのヒストグラム表現 平均R/Sライン 色付きの矢印の付いたR/S ヒストグラムの反転表示
トレンドウェーブの使い方 セットアップはとても簡単です...
チャートに載せる 入力を調整する 反転が表示されるまでトレンドを追跡します(白い線がメイントレンドの端を離れています)
知っておくと良い 色付きの矢

CAP Prime Scalper EA is a Forex scalping EA that uses a smart system to detect key breakout signals then cuts the profit of the move as much as possible while minimizing the loss. The robot automatically analyzes the market volumes and volatility and follows strong supply and demand movements. It smoothly sets breakeven levels and features the built-in smart mechanism for partial closure of profitable trades. It also has option to stop trading before important news releases to avoid slippage and
Convenient tool for measuring the number of points between the prices directly on the chart. Displays in the measurement between points in percentage, points (financial) and time (bars ). Compatible with all graphical timeframes. When fixed on the chart is displayed in all timeframes. Press Ctrl, click the first point, move the mouse and will now display the measurement. Click again and fix. Very fast tool that does not occupy much space. Input Parameters Line Color Line Style Text Color Text S
FREE

Trend Hunter is the indicator for filtering sideway and confirm trend to help your system trading. Indicator can use every currency pairs, every timeframe, and every broker. You can see trend and side way when color to change in candlestick.
Features Candlestick when the color changes to green: Uptrend. Candlestick when the color changes to red: Downtrend. Candlestick when the color changes to Yellow: Sideway.

The indicator displays crossing zero level by Moving Average of Oscillator (OsMA) in the form of arrows. The this is a multi-timeframe indicator, and it displays signals from other timeframes. The indicator notifies about a signal by means of a pop-up Alert window, or sending notification to e-mail.
Parameters Time-frame - select timeframe to show indicator signals. Fast EMA Period - fast EMA. This is an exponential moving average from a price with a short period. Slow EMA Period - slow EMA. T
FREE
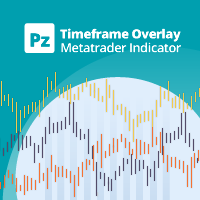
This indicator displays the price action of several timeframes on the same chart allowing you to evaluate different timeframes at a glance from the same chart, without the need of switching between timeframes. The overlay can be displayed totally or partially on the chart, making it easy to separate price action from the trading chart from the reference timeframes. [ Installation Guide | Update Guide | Troubleshooting | FAQ | All Products ] Stop browsing through timeframes! Plot up to four timef
FREE
WalkForwardOptimizer library allows you to perform rolling and cluster walk-forward optimization of expert advisers (EA) in MetaTrader 4.
To use the library include its header file WalkForwardOptimizer.mqh into your EA source code, add call provided functions as appropriate.
Once the library is embedded into EA, you may start optimization according to the procedure described in the User guide . When it's finished, intermediate results are saved into a csv-file and some special global variabl
WalkForwardReporter is a script creating HTML reports from walk-forward optimization results generated by WalkForwardOptimizer (WFO) library. It allows you to easily view and analyze your expert adviser (EA) performance and robustness in unknown trading conditions of future. You may find more details about walk-forward optimization in Wikipedia . Once you have performed optimization using WFO, the library generates a CSV-file and special global variables with resulting data. Copy the CSV-file fr
FREE

The indicator is designed for scalping fans, it gives signals of an average of ten pips. The indicator is based on mathematical calculation, it determines the average range of the price channel, which is generally formed at the time of accumulation of positions. Once the price moves beyond its borders, a signal is generated in the form of an arrow. The indicator has a minimum of settings: the period for which you need to calculate, and the frequency of signals (the signal frequency is determined

The Expert Advisor uses an advanced adaptive trading strategy with a neural network based on a position averaging. The strategy for opening the first trades is based on the price rate of change. The neural network is based on a single indicator - the weighted average percentage of the Open price, the High price, the Low price and the Close price. To filter trade opening in the order network, perceptrons are used. A common trailing stop of open positions by money in a deposit currency or profit %

チャートオーバーレイ インジケーターは、同じチャートで複数の商品の価格アクションを表示し、通貨ペアが互いにどのように変動するかを評価できます。 [ インストールガイド | 更新ガイド | トラブルシューティング | よくある質問 | すべての製品 ]
買われ過ぎまたは売られ過ぎの通貨ペアを簡単に見つける 同じチャートに最大6つの通貨ペアを重ねてプロット 必要に応じて反転記号を表示する チャートのサイズ、ズーム、時間枠に適応 自動価格レベル計算 カスタマイズ可能な価格レベル密度 カスタマイズ可能な色とサイズ
通貨ペアの反転とは何ですか? 通貨ペアの反転とは、取引の主要通貨を反転させた2つの通貨間の為替レートを表示することです。たとえば、EURUSD、GBPUSD、およびUSDJPYを同じオーバーレイチャートにプロットする場合、価格が逆レートを反映するためにUSDJPYを反転することは理にかなっています:JPYUSD。これにより、JPYUSDの価格は、オーバーレイチャートの他の2つのシンボルと正の相関関係で移動し、チャートの学習が容易になります。
インジケーターのテスト
FREE

The Tradonator nextGen! trades not primarily on indicators or prices, but at the beginning of every new candle (controlled by Timeframe). determines the trading direction due to the integrated indicator, which can measure trend and volatility. creates a Sell- and a Buypool and manages them isolated. calculates with every trade for each of the pools a previously defined profit target and closes the pool only with a total profit once this goal has been achieved. basically works with any currency
Introduction To Turning Point Indicator The trajectories of Financial Market movement are very much like the polynomial curvatures with the presence of random fluctuations. It is quite common to read that scientist can decompose the financial data into many different cyclic components. If or any if the financial market possess at least one cycle, then the turning point must be present for that financial market data. With this assumption, most of financial market data should possesses the multipl

The Profit Loss Control Panel is a tool designed to control loss and profit in trading. It allows to close deals if profit and/or loss of positions opened on the account reaches a certain limit.
Limit types Percentage of balance Number of points Deposit currency Thus covering the most popular list of reasons to close the deal. The panel allows to combine limits of various types, for example, limit loss as a percentage of the deposit and limit profit in deposit currency. Limits as a percentage
MetaTraderマーケットはトレーダーのための自動売買ロボットやテクニカル指標を備えており、 ターミナルから直接利用することができます。
MQL5.community支払いシステムはMetaTraderサービス上のトランザクションのためにMQL5.comサイトに登録したすべてのユーザーに利用可能です。WebMoney、PayPal または銀行カードを使っての入金や出金が可能です。
取引の機会を逃しています。
- 無料取引アプリ
- 8千を超えるシグナルをコピー
- 金融ニュースで金融マーケットを探索
新規登録
ログイン