YouTubeにあるマーケットチュートリアルビデオをご覧ください
ロボットや指標を購入する
仮想ホスティングで
EAを実行
EAを実行
ロボットや指標を購入前にテストする
マーケットで収入を得る
販売のためにプロダクトをプレゼンテーションする方法
MetaTrader 4のための無料のエキスパートアドバイザーとインディケータ - 47

This indicator displays the moment when the DeMarker oscillator crosses its smoothed value. If the DeMarker oscillator crosses its smoothed value, it is a signal of a trend change. The signal is given after the end of the formation of the candle. The signal is confirmed when the price crosses the high/low of the bar on which the signal was given. The indicator does not redraw.
Custom Parameters: DeM_Period (>1) - DeMarker indicator period; MA_Period - period for smoothing DeMarker indicator va
FREE
Fastest way to change the period. Suitable for traders who use many charts and timeframes. Size, shape and color can be customized.
Inputs Parameters Corner — Choose corner placement Standart is "Right lower chart corner" Color — Background color of the button ColorText — Text color of the button ColorOn — Background color of the button for the current period ColorOnText — Text color of the button for the current period Font — Arial, Verdana... FontSize — Size of the font in pixels DistanceX —
FREE

AR Canada is a fully automated trading robot optimized for USDCAD H1. This free version trades only a fixed lot with minimum volumes. No hedging, no martingale, no grid, no arbitrage, etc. The EA applies the trading algorithm based on crossing the moving averages. Take Profit and Stop Loss values are fixed and have a ratio of 1:4. Positions are closed by the EA when Take Profit or Stop Loss level is reached.
Parameters MagicNumber = 3 - unique EA magic number.
FREE
Multi operations script to operate manually. It is not a toy!
Warning: This script needs one to two months of utilization to achieve a proficient usage level and knowing all functions and market situations where it can be used.
THIS IS A TOOL FOR PROFESSIONALS & EXPERIENCED TRADERS!
You can save thousands of configurations to make thousands operations beyond your imagination .
Steps buy to protect steps sell, chains of take profits and stop losses, protected, martingale, progressive, in
FREE

This EA automatically closes all Open Trades and Pending Orders at your specified Date & Time. There is no option in Meta Trader to automatically close all Open Trades and Pending Orders at your specified Date & Time. Here comes this EA “Time Based AutoCloser” using which you just provide your desired Closing Date & Time and on reaching it, all open trades and pending orders will be automatically closed. Input of EA
Your Desired Closing Date & Time (for example 2023.01.31 12:30) (Please note
FREE

The main purpose of this expert advisor is to protect your hardly gained profits. Once the market goes in your favor, with amount of specified pips [configured via EA inputs], the EA will do the following: Move the Stop-loss of the profitable positions to Breakeven. Lock in some profits, i.e put the SL above/below your entry with specified pips Will close part of position, % of lots, once the EA was triggered. By default, the "Move to Breakeven EA" will modify all opened positions on the termi
FREE

The indicator generates signals for opening positions. The principle of operation is to compare the current average price with a range of average prices over a longer period. The signals are confirmed when the price exceeds the High/Low of the bar where the indicator generated the signal. Maintenance of an open position is carried out on a smaller TF. Indicator signals to open an opposite position on a smaller TF are a signal to close the deal. This indicator does not repaint or not recalculat
FREE

Stochastic Full View show all 29 major and minor pairs Stochastic indicator live value,traders can view all 29 pairs Stochastic indicator live value with all 9 timeframes just attached it on ANY ONE Chart, traders can see all the 9 timeframe overbought signal and oversell signal just on ONE Chart Stochastic Full View show the overbought value and oversell value with highlight background color and font color,you can attach this utility on any pair and any timeframe, traders can
FREE
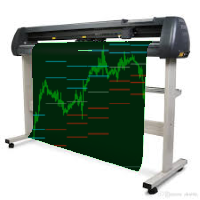
This indicator is a tool to show history orders on chart. Indicator show open time and price, close time and price and profit in pips on chart. It can to help the trader to see all history orders which are opened either manually or by an automated system.
You can to use indicator on any symbol and any time frame.
You can to get the source code from here .
Parameters
Delete Objects If Terminated Indicator - Delete objects of chart if terminate indicator. Size Fonts Of Info On Chart - Size
FREE

Indicator Profitability Check Introduction: IPC means "Indicator Profitability Check". Some features will be locked in free version. Also you cannot check result more than 1 month. For paid version, please visit: https://www.mql5.com/en/market/product/45247 Here Indicator Profitability Check is a custom script which will check the profitability of a buy-sell arrow based custom indicator’s signal profitability. So traders who are very confusing for a buy-sell arrow based custom signal indicato
FREE

The most different product of the site: This tool is an auxiliary tool aimed at managing your trades and psychological discussions. As you probably know, more than 70% of the reason for the success of big traders is psychological issues. Only 30% is related to your strategy. So it is better to strengthen this big part with a tool. With a free tool, I allow you to become a better trader This tool consists of several rules. In version 1.0, we have 7 rules. In later versions, we will add more ru
FREE

バイナリアナライザは、バイナリコードに基づく既成の計算に基づいて、独自の指標と取引戦略を作成する絶好の機会です。 アナライザーは、小数点以下5桁の「0.00001」のすべての通貨ペアで動作しますEUR / USD、GBP / USD ITD 推奨セッションM1 カタログに含まれています。 インジケーター-「バイナリ参照」 強気と弱気の市場感情を測定する4つの指標 // ------------------------------------------------ ------------------- // インジケータ「バイナリ参照」 アルゴリズムはローソク足で式を計算し、結果を2つの配列にマージします。 式は、1つのセッション内の価格へのリンクの数を計算します。 配列には、バイナリコードが可能な限り参照する価格が含まれています 配列は、インデックス.binで/ Filesフォルダーに保存されます。 // ---配列PIPS_COL_Price [99999,6]には、次のインジケーターが含まれています--- // PIPS_COL_Price [x、0]-バイナリコードによって
FREE
The presented indicator is a joint application of the FATL digital filter and the Ehlers filter (J. F. Ehlers). This indicator gives reliable signals with a small delay, which makes trading based on it very effective. After receiving the signal, you should wait for its confirmation - overcoming the high/low of the bar on which the signal was given by the price.
It is recommended to pay attention to divergence or convergence signals (discrepancy in the ratio of new highs or lows on the oscillat
FREE
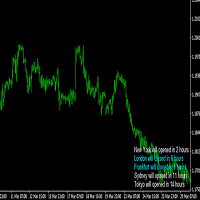
Forex can be traded 24 hours a day on weekdays. The reason is that Forex is an investment product that targets foreign currency trading.
Some foreign exchange market is always moving due to the time difference. New York, London, Tokyo, Hong Kong, Singapore, etc.
Therefore, it is possible to trade almost 24 hours a day.
Financial institutions are closed on Saturdays and Sundays on weekends, so Forex trading is not possible, but in reality, the exchange rate is moving slightly.
The reason is
FREE

The London Stock Exchange Session's Hours
This indicator facilitates observing the currency pair's quotations during subsequent parts of the stock exchange session live. Before the session starts, a rectangle is drawn on the chart but not filled in with color. It means the extent of the session duration. Before the first bar enters the rectangle of the session, a sound signal or pop-up window will notify us that the session will just start. When the price graph crosses the edge of the session
FREE
The indicator marks control points on the price chart, overcoming which by the price is a signal to open a deal. At the points marked by the indicator, the maximum or minimum price values go beyond the price channel built on the basis of price values for a longer period. After overcoming such points, the price is likely to continue moving in the same direction. The indicator does not redraw and, despite its simplicity, can be quite an effective trading tool.
Adjustable parameters: i_Period
FREE
This indicator displays RVI indicator signals. The main point of Relative Vigor Index Technical Indicator (RVI) is that on the bull market the closing price is, as a rule, higher, than the opening price. It is the other way round on the bear market. So the idea behind Relative Vigor Index is that the vigor, or energy, of the move is thus established by where the prices end up at the close. To normalize the index to the daily trading range, divide the change of price by the maximum range of price
FREE
DF Osc AM - this is an indicator that marks the moments when the price direction changes. The indicator uses adaptive digital filters for analysis. Digital filters are (simplified) a way to smooth data. Unlike traditional moving averages, a digital filter will be more effective in most cases. The indicator does not redraw, the signal is generated after the candle is completed. It is optimal to use the indicator signals as signals to open a trade when the price overcomes the maximum or minimum o
FREE

The indicator allows you to trade binary options. The recommended time frame is М1 and the expiration time is 1 minute. The indicator suitable for auto and manual trading. A possible signal is specified as a arrows above/under a candle. You should wait until the candle closes! Arrows are not re-painted Trade sessions: LONDON and NEWYORK section Currency pairs: GRB/USD Working time frame: M1 Expiration time: 1 minute. The indicator also shows good results when using the martingale strategy - "Mar
FREE

Strategy creation : Create lines of stop loss, entry and take profit. Live parameters such as lot size, gap in pip from SL to TP, Risk/Reward ratio are update whenever lines of SL and Entry move. This function allows traders to clarify their strategy before making any orders. Risk management - The risk calculation function calculates the volume for a new order taking into account the set risk and the distance from the Stoptloss to Entry Line. In addition, maximum risk (%), RR value are
FREE

Narcis Trader is an expert designed for managing trades and facilitating trading. Attention, the application does not work in the strategy tester. Download Real
Its features include: Determining the trade volume based on the selected trader's risk. Setting specific and fixed stop-loss and take-profit levels. Defining the take-profit level based on the specified risk-to-reward ratio (r/r). Entering trades using static and dynamic lines based on the predetermined risk. Position closure managemen
FREE
This Expert Advisor is a tool to be used for closing all open positions by ticket in profit. Does not open positions, can only close positions. You can select the type of profits (pips or currency) and type of tickets (buy or sell) to manage it, and specific ID (magic number).
You can to get source code from here .
Parameters ManageBuySellOrders - Way to manage opened orders, as different basket buy from sell, or same basket buy and sell. CloseBuyOrders - Close all buy positions if target ac
FREE
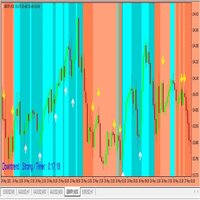
You have to wait the background colors, if the background's RED, you have to wait the yellow arrows to take selling orders. If the background's BLUE, you have to wait the white arrows to take buying orders. When the arrows show out, please wait for the close candles, otherwise it repaints. Please you watch the background colors, if the background's Lighter Red, that means big downtrend signals, if it's Darker Red, you have to be carefull. Because the downtrend can change to uptrend suddenly. if
FREE

Features It is a demo version of All inOne indicator It works only on EURUSD, but the full version works on all currency pairs. All in One indicator is a simple indicator, it makes you know about 8 indicators in all timeframes simultaneously at a single glance. Stochastic RSI Moving Average (MA) Parabolic SAR ADX MACD CCI Last Candle (Candle) In all timeframes (M1, M5, M15, M30, H1, H4, D1, MN) at the same time.
Parameters Stochastic: PercentK : Period of the %K line. PercentD : Period of the
FREE
The presented indicator marks signals on the price chart with arrows in accordance with the data of the FATL Momentum AM indicator. The indicator gives a signal and sends a notification to the mobile terminal and email. The FATL Momentum AM indicator is the difference between the current price and the price some number of periods ago. The difference from the classic indicator Momentum is the preliminary smoothing of prices by an adaptive digital filter - FATL. Confirmation of the indicator signa
FREE

Arlene Sessions Background is an indicator that draws colored vertical background on the chart depending on your session. You can see the version 1 here: https://www.mql5.com/en/market/product/68822 You can see more of my publications here: https://www.mql5.com/en/users/joaquinmetayer/seller If you only want to paint a session on your chart, you must set the color "none" to deactivate it.
FREE

The scripts adds order tracing icons in the chart window. Trace orders are similar to the standard terminal tracing. Icons are added for both closed orders and current (market) orders. The Days of history to check parameter means the depth of the order history to be traced (number of days). If the parameter value = 0, all orders in the available history will be traced.
FREE

FXO BROKER SPREAD INFORMATION
Floating spreads are harmful for your trading strategy, even with Raw spread account. it makes a lot difference.
Floating spread goes too high when it's news time or daily or weekend rollovers.
this can affect trades's Expert Advisors, Pending orders and Stop losses.
Therefore this tool is created to find right information about spread while rollovers.
How to use :
download/paste the program file to Expert Advisor folder,
Open a chart of any i
FREE

This Expert Advisor constantly monitors the balance and P / L of your trading account to avoid costly withdrawals and / or taking profits. When a certain drawdown or profit target is reached, the EA will warn, close all trades. Very simple setting, set the Take profit and the stop loss (in money) and the expert will start to monitor the orders that are manual or from another expert, and once the profit or stop loss point has been set, the expert will close all the positions with the classic "Bas
FREE

Add indicator "Symbol Name Drawer " on chart. Indicator creates text object with name of current symbol.
You can change symbols on chart and indicator automatically changes text.
Free to use. Simple tool.
If you have any suggestion you can write me about it in comments. I try to improve this tool in future versions. Thanks for using my indicator. If you want to order something special in mql4 or mql5 message.
FREE

This EA will make all the history trades appear on the chart,,
will make it easy to track each trade in history separately , it will show each trade open price + time and closing price + time
simply download the EA to your MT4 platform, then apply it on any chart that belongs to any trades in mt4 history,
for example, if you have traded on GBPUSD in the history, open GBPUSD chart and apply the EA on it, it will automatically print all info on the chart about the trades ,,
EA works
FREE

Slow T3 MA Trend indicator derived from T3 moving averages. This indicator is part of the T3 Cloud MA indicator and is posted here on its own. Buying/Selling opportunities above/below line. The MA line can also be used as dynamic support/resistance for more aggressive entries. Use default values for best settings. The number of look back bars is user defined. This indicator can be used in combination with other strategies such as price action. Suitable for all time frames.
FREE
RSTL dpl AM - (Referense slow trend line - detrended price line) indicator built on the principle of searching for discrepancies between the current real price and the calculated trend value. RSTL - a digital filter that calculates the reference line, the overcoming of which by the current price is considered a change in the long-term trend. Indicator signals: Small red dot - the price continues to fall; Small blue dot - the price continues to rise; Big red dot - the price starts to fall; Big bl
FREE

This indicator calculate the minimum,maximum,average and relative (to points of the bar) spread in the chart applied period. The indicator must be applied to one or more different period on a Pair and analyze the spread for all the Pairs available by the Broker. The csv output for one minute chart is something like this https://gofile.io/?c=K5JtN9 This video will show how to apply the indicator https://youtu.be/2cOE-pFrud8 Free version works only for GBPNZD
FREE

Pips Keeper is a sophisticated Forex trade manager expert advisor designed to enhance trading efficiency and optimize profit-taking strategies. With its intuitive functionality, this EA empowers traders to automate the process of closing profitable positions at predefined profit thresholds, thereby maximizing returns and minimizing risks.
Key Features:
1. Threshold-based Profit Closure: Pips Keeper enables traders to set customizable profit thresholds, allowing for the automatic closure of
FREE
With this utility, switching the object visibility for individual objects has never been easier. This will help eliminate the clutter that plagues MetaTrader 4 traders when they create objects and then go to a higher timeframe and see that the objects interfere with the visibility of the chart. The demo version of Visibility Switch only works on the EURUSD currency pair. The full version of Visibility Switch can be found here. By default, every new object created has its visibility set to the cu
FREE

This Expert Advisor alerts users when the price crosses the chart lines. Horizontal and trend lines can be processed. Number of lines is not limited. Parameters prefix of signal line – prefix for the names of the objects (lines) processed by the indicator. If left empty, all horizontal and trend lines are processed. price Mode – bid or ask. timeout – crossing alert timeout. number of repeats – number of crossing alert repeats. number of comment lines – self-explanatory.
FREE

This indicator is a perfect tool able to compare which brokers have the lower latency. It shows us immediately which brokers are slower or faster. When you see the dot icon on the line, it means this broker is the faster one and the red line (Broker_A) is the slower one. See the example on the screenshot.
How It Works? This indicator shares the prices information to and from the "shared" common data folder. It compares all the prices. The price is based on average by (Ask + Bid) / 2. There are
FREE

Trades Viewer Free supports EURUSD only. Trades Viewer is a trading helper app for a serious trader. It offers several important data like day range, 22 days average range and predefined PL. It draws trades history and current open positions on a chart. It has a detail panel for viewing a particular trade with just a click on that trade. All these make it very convenient and straightforward to view your entry/exit positions and thus improve your trading system. Features Profit/loss of the curren
FREE

This tool adds alerts to your Fibo Retracement and Fibo Expansion objects on the chart. It also features a handy menu to change Fibo settings easily and quickly! Note: This is a demo version operating only on USDCHF . The full version purchase link: https://www.mql5.com/en/market/product/6760
Features Alert for Fibo Retracement and Fibo Expansion levels. Sound, Mobile and Email alert. Up to 20 Fibo Levels. Continuous sound alert every few seconds till a user clicks on the chart to turn it OFF.
FREE

Note: this product is a free limited version of the full featured product Currency Timeframe Strength Matrix . It only includes AUD, CAD, CHF currencies instead of all 8 currencies. It includes only 5S, 1M, 5M time frames instead of all 8 (5S, 1M, 5M, 15M, 30M, 1H, 4H, 1D).
What is it? The Currency TimeFrame Strength Matrix is a simple and comprehensive Forex map that gives a snapshot of what is happening in the Forex market at the very present time. It illustrates the strength and momentum
FREE
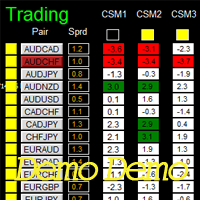
如果产品有任何问题或者您需要在此产品上添加功能,请联系我 Contact/message me if you encounter any issue using the product or need extra feature to add on the base version
Dashboard Super Currency Strength Demo is the demo version of Dashboard Super Currency Strength, which have full functionalities of the paid version, except only 1 currency strength meter with timefrme of M30 and H1 will be used for signal generation (full version has 3 currency strength meters with full timeframe selection). Please re-direct to LINK for
FREE
The technical indicator is a more advanced version of the relative strength index (RSI) that applies moving average convergence-divergence (MACD) principles to a double-smoothed RSI (DS RSI) indicator. The indicator is derived by computing the difference between a double-smoothed RSI and a simple moving average (SMA) of the DS RSI. The indicator's intent is to provide more accurate buy and sell signals than the standard RSI calculation.
The MACD is derived by subtracting the 12-period expone
FREE

The MAtrio indicator displays three moving averages on any timeframe at once with a period of 50-day, 100-day, 200-day. After attaching to the chart, it immediately displays three moving averages with the parameters of simple (SMA) moving average SmoothingType50 , simple (SMA) moving average SmoothingType100 , simple (SMA) moving average SmoothingType200 . Accordingly, with the price type ValuePrices50, ValuePrices100, ValuePrices200 , by default, the price is Close price everywhere. All parame
FREE
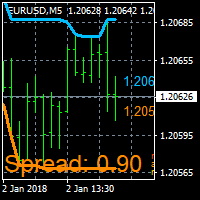
On Screen Display that shows highest highs and lowest lows on chart. Very helpful with manually trading.
DEFAULT SETTINGS (INPUTS) Highest high candle -10 meaning it goes back 10 candles on the timeframe you are on, to get the highest high point of that candle. Lowest low candle - 10 meaning it goes back 10 candles on the timeframe you are on, to get the lowest low point of that candle. Colors- you can change the colors of the lines. IT THEN TRACES THE LINE SO IT MAKES IT EASIER TO SEE WHA
FREE
The indicator displays the signals of the RSX oscillator on the price chart. (To display these signals in a separate window, along with the oscillator, another indicator is used - RSX Osc 4 AM ). It is optimal to use the indicator signals as signals to open a trade when the price overcomes the maximum or minimum of the bar at which the signal was given. An opposite signal cancels the previous signal.
Settings: Data period for indicator calculation - data period for indicator calculation; Dat
FREE

Do you use dynamic ranges (like Bollinger Bands or Envelopes) in your trading? A fixed period is usually used for such calculations. But is such approach relevant to the very nature of the market? In fact, the price chart consists of a series of successive processes - trends and flats. In this case, we can talk about the internal development logic inside a single process only. Therefore, the nature of the market is better described by dynamic ranges designed for the processes occurring "here and
FREE

Ever wondered what is XAU/XAG rate or how Chinese Yuan is traded against Russian Ruble? This indicator gives the answers. It shows a cross rate between current chart symbol and other symbol specified in parameters. Both symbols must have a common currency. For example, in cases of XAUUSD and XAGUSD, or USDRUB and USDCHN, USD is the common currency. The indicator tries to determine the common part from symbols automatically. If it fails, the DefaultBase parameter is used. It is required for non-F
FREE

An EA to export trading history for FXer - Journaling and Analytics. Register Create an API token Put EA on any chart (any TF is fine) Fill in the API token Follow analytics for better trading
!!! Currently in beta-testing !!! At FXer, our mission is clear: to empower traders like you with the tools needed to excel in the ever-changing world of trading. We are committed to providing top-tier, data-driven market analysis and trading intelligence, ensuring you can make well-informed decisions, ma
FREE

Индикатор вычисляет наиболее вероятные уровни возврата цены. Может быть использован для установки уровня тейк профит. Рекомендуемый таймфрейм - любой, при соответствующей настройке. Настройки.
Period - количество свечей для анализа. Accuracy - точность расчёта уровня в пунктах. Width - размер ценовой метки. Отработка уровней как правило не занимает много времени, уровни достаточно точны при касании и процент возврата цены к ним достаточно высок. Но следует учитывать риск продаж на локальных ми
FREE

The chart bucket indicator primarily creates custom candlesticks which comes with adjustable colors, color themes and sizes and even comes with a demo. Also included are trade details relevant to trading and binary options.
If your a binary options trader this may be useful for timing of bars with actual price that you can compare with your binary options broker.
Key Features Custom Candlestick Themes, Custom Colors & Sizes. Ask/Bid Point Difference.
Open/Close Point Difference of current
FREE

Most of brokers make slippage for your orders (stop orders or market orders). When you make limit orders (Buy or Sell), they don't make slippage for you. Because it is for your advantage. This EA will resolve limit slippage problem for you with any brokers. Slippage Problem Example: The price now is 1.31450, you put sell limit at 1.31500. If the price jumps to 1.31550. The Broker will execute your sell limit at 1.31500 NOT 1.31550. If you put buy stop, the Broker will execute it at 1.31550 (or m
FREE

The indicator plots an affine chart for the current instrument by subtracting the trend component from the price. When launched, creates a trend line in the main window. Position this line in the desired direction. The indicator plots an affine chart according to the specified trend.
Input parameters Maximum number of pictured bars - the maximum number of displayed bars. Trend line name - name of the trend line. Trend line color - color of the trend line. Black candle color - color of a bullis
FREE

Overview The script displays information about the trade account: Account - account number and type (Real or Demo); Name - name of the account owner; Company - name of a company that provide the access to trading; Server - trade server name; Connection State - connection state; Trade Allowed - shows whether trading is allowed on the account at the moment; Balance - account balance; Equity - account equity; Credit - amount of credit; Profit - profit size; Free Margin - free margin on the account;
FREE
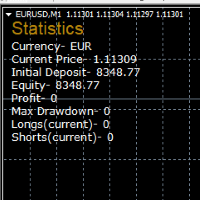
STATISTICS OSD
Statistics OSD (On Screen Display) Is very Helpful and easy to use. Download Today! ENJOY! :) On Screen Display -Currency -Current Price -Initial Deposit -Equity -Profit -Max Drawdown -Longs(Current) -Shorts(Current)
*Very useful in configuring EA's or Strategies, because you can visually see when its having a lot of shorts or longs. Then you can go back and tweak accordingly.
FREE
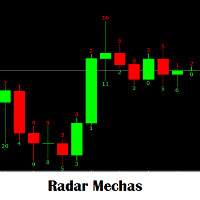
手動入力を行うためのアラートを生成するサイズに応じて、ろうそくから出る芯のサイズを確認するのに役立つインジケーター。 戦略が前のろうそくの芯のサイズまたは同じ現在のろうそくの芯のサイズをもたらすことを最大限に活用してください. 売買に入る。 これは、新しいエントリに対して行われる分析に必要な指標です。 お気に入りのツールになります。 Shudō nyūryoku o okonau tame no arāto o seisei suru saizu ni ōjite, rōsoku kara deru shin no saizu o kakunin suru no ni yakudatsu injikētā. Senryaku ga mae no rōsoku no shin no saizu matawa onaji genzai no rōsoku no shin no saizu o motarasu koto o saidaigen ni katsuyō shite kudasai. Baibai ni hairu. Kore wa, atarashī entori ni ta
FREE

Free Version. This expert advisor is optimized for the USD/JPY forex value,It can be used for any forex currency by setting the values listed below. Its operation is based on a multi time frame moving average strategy, so it can be classified as a trend expert. When the trend has consolidated on one direction the algorithm buys or sells the currency pair. In the event of a trend inversion, there is a fixed stop loss, while the take profit is variable with the trailing stop function. For thi
FREE

スクリプトは、1つのストップロスと5つの異なるテイクプロフィットで5つの注文(購入)を開きます。 そして、4つの指値注文(購入)を行います。 デフォルトでは、次のパラメータが設定されています。 すべての未処理の注文の損失を停止-120ピップ 1注文で利益を得る(ロット0.1)-30ピップ 他の4つの注文(ロット0.04)で利益を取ります-50、90、140、200ピップ。
指値注文のストップロスは、現在の価格(注文時)から135-140ピップスです。 各指値注文の距離は20ピップです。 マイクロマーチンゲールを使用したロットサイズ-0.04、0.05、0.06、0.08。
指値注文の場合、自動削除は2日後に設定されます。 このアドバイザーを使用して、募集中のポジションをサポートできますhttps://www.mql5.com/en/market/product/56277
開始する前に、独自のパラメーターまたはパラメーターを設定するためのウィンドウを使用してスクリプトを注文できます。 個人的には、パラメータ確認ウィンドウなしでスクリプトを実行すると便利だと思います。
FREE
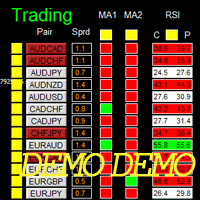
Dashboard Super MA RSI CCI Demo is the demo version of Dashboard Super MA RSI CCI, which have full functionalities of the paid version, except timeframe of MA1, MA2, RSI, and CCI has been fixed to be TF_MA1=M30, TF_MA2=H1, TF_RSI=M30, TF_CCI=M30 (full version has ability to adjust/select full range timeframe for MA1, MA2, RSI, and CCI). To access the full version, please re-direct to this LINK .
Entry Signal Refer to screenshot2 Make sure completing the following action items to make this da
FREE
This is a technical indicator that put on strategy tester the buttons of the expert adviser "Control adora". Usually when applied the controladora to the strategy tester, the buttons do not appear and therefore its functions (like directly buy, sell, close orders or place stop loss indicator) can't be used. But now you can if have the Manual Backtest indicator. If you don't have Control adora, you can get it from here . This indicator get on the chart the buttons that can be of use in strategy t
FREE
Become a constantly profitable 5-star forex trader!
We offer a few indicators to support you understand and analyse the market! With our strategies you will improve your trading system and bacome an expert...
We have indicators for trend direction, market direction and others.. for multi-time frames and that covers all majors or your favorite trading symbols! Some of them offer a customizable calculation parameters... or Graph features!
See how powerful they are! The are also easy-to-use
FREE
This Expert Advisor is used to send messages from the PCT Multi indicator to Telegram.
The EA has 5 settings: - Channel name: The name of the Telegram channel. - Token: Your bot's Token. - Entries: Entry messages will be sent. - Results: Entry results will be sent. - Alerts: Alerts will be sent.
How to set up: In the Tools -> Options menu, in the "Expert Advisors" tab: - Check the "Allow WebRequest for listed URLs:" option. - Click "add new URL" and add " https://api.telegram.org " (without
FREE

The indicator detects market efficiencies and inefficiencies by studying price movements and marks candles where the best efficiencies occurred. The most 'efficient' candles are indicated with a vertical bar histogram. Taller bars represent these candles. The highs and lows of these candles are supply and demand areas, important levels that will be retested in the future. It can be used on all time frames with the same settings.
FREE
The indicator shows the current timeframe and symbol name. It is also possible to turn on the indication of time until the end of the current bar. In the settings, you can specify: - the location of the indicator in relation to the terminal window, top left, top right, bottom left and bottom right - a row of text display arrangements so that the inscriptions do not overlap each other - color - font - font size.
FREE
It is the simplest indicator in existence. It has only one function: report the seconds elapsed since the last minute end in a very convenient way, with a label that can be moved in the chart, so that the trader does not have to take his eye off the forming candle. It is used on M1, but also on larger intervals, for those interested in opening/closing positions at the best time. Sometimes an intense movement in the last 10" of the minute gives indications of future trend, and can be used for sc
FREE
StatBar 1.6 Indicator showing balance, earnings for today, yesterday and the day before yesterday. The indicator also shows: - Server; - GMT; - Server time; - Shoulder; - Spread.
Description of variables: extern int Magic = "-1"; // Magic for statistics -1 = all 0 = manual extern string Symboll = "-1"; // Symbol for statistics -1 = all 0 = current EURUSD = for EURUSD
FREE
Your attention is invited to the indicator Price Action Indicators. It doesn't need settings. And also it is not tied to more than one indicator, which makes it not vulnerable to different accounts or brokers.
Add one setting PERIOD
Regards, Mikhail
Вашему вниманию предлагается индикатор Price Action Indicators. Ему не нужны настройки. А также он не привязан не к одному индикатору, что делает его не уязвимым перед разными счетами или брокерами.
С Уважением Михаил
FREE

***IMPORTANT: This free indicator works with the paid for Strong Weak Forex Expert Advisor. The EA also depends on the following custom indicators: Strong Weak Parabolic Strong Weak Symbols Strong Weak Values Strong Weak Indicator Download them for free in the Market. The EA will not work without it. These are all custom indicators which the Strong Weak Forex Expert Advisor relies on to generate trading signals. If you have any problems with installation send me a message.
FREE

Script for Close all open SELL orders.
Usage:
- Enable Automate Trading
- Attach / Double click the script
ENJOY IT.
//+------------------------------------------------------------------+ //| Close SELL.mq4 | //| Copyright 2015, SangBatosai-Code5 | //| https://www.mql5.com/en/users/mahakaya | //| Credit: | //| SangBatosai
FREE
Script for Delete all Pending Orders.
Usage:
- Enable Automate Trading
- Attach / Double click the script
ENJOY IT.
//+------------------------------------------------------------------+ //| Close ALL Pending.mq4 | //| Copyright 2015, SangBatosai-Code5 | //| https://www.mql5.com/en/users/mahakaya | //| Credit: | //| SangBatosai-
FREE
MetaTraderマーケットは、開発者がトレーディングアプリを販売するシンプルで便利なサイトです。
プロダクトを投稿するのをお手伝いし、マーケットのためにプロダクト記載を準備する方法を説明します。マーケットのすべてのアプリは暗号化によって守られ、購入者のコンピュータでしか動作しません。違法なコピーは不可能です。
取引の機会を逃しています。
- 無料取引アプリ
- 8千を超えるシグナルをコピー
- 金融ニュースで金融マーケットを探索
新規登録
ログイン