Guarda i video tutorial del Market su YouTube
Come acquistare un Robot di Trading o un indicatore
Esegui il tuo EA
hosting virtuale
hosting virtuale
Prova un indicatore/robot di trading prima di acquistarlo
Vuoi guadagnare nel Market?
Come presentare un prodotto per venderlo con successo
Nuovi Expert Advisors e Indicatori per MetaTrader 5 - 122

Make your Take Profit, Stop Loss, and Trailing Stop levels invisible to the broker! Main option: STEALTH MODE Virtual Trailing Stop Virtual Take Profit Virtual Breakeven Virtual Stop Loss Virtual Orders Lifetime WARNING: The Expert Advisor does not place orders by itself. You must open orders yourself (including through the Expert panel) or use a third-party Expert on another chart of the same currency pair. Please specify the Magic number "-1" in the Expert settings for the Expert to process th

Quick Info è un'utilità di informazioni per raccogliere e fornire a un trader varie informazioni utili necessarie nel trading sui mercati finanziari ogni giorno.
Tutte le informazioni necessarie vengono raccolte e raggruppate in una finestra separata. Nella prima scheda troverai le statistiche commerciali per il periodo di tempo selezionato. Per raccogliere statistiche commerciali, è sufficiente selezionare un periodo di tempo dall'elenco o specificare le date di inizio e fine del periodo per

Questo indicatore del cruscotto multi simbolo può inviare un avviso quando viene identificata una forte tendenza. Può farlo costruendo il cruscotto utilizzando i seguenti indicatori/oscillatori (di seguito solo indicati come indicatori): RSI, Stocastico, ADX, CCI, MACD, WPR (Williams Percent Range, chiamato anche Williams %R), ROC (Price Rate of Change) e ultimo oscillatore. Può essere utilizzato con tutte le fasce orarie da M1 a MN (può visualizzare solo 1 fascia oraria alla volta). Ti dà prosp
CAP Breakout EA MT5 is a flexible and powerful metatrader expert advisor that using several breakout strategy and implements many useful features. It using the ZikZak Breakout, Daily candle breakout, London time breakout, Pivot points breakout and several breakout strategy. It offers many customizable trading scenarios and flexible position management settings, plus many useful features like customizable trading sessions, a martingale and inverse martingale mode [ Installation Guide | Updat
FREE

Best price, read GS smart channel ! 1 copy left for $250. Next price --> $350 Traders who purchase GS smart5 receive a personal bonus. After purchase contact me for assistance GS smart5 is 3 in 1 = Superior Grid Expert Advisor + News feed + Trend indicator. Automatically adjusts its parameters to work on any Forex instrument (including cryptocurrencies, indices and CFDs) for USD accounts. To start trading, simply attach the EA to the chart, preferably EURUSD, GBRUSD, NZDUSD, AUDUSD and XAUUSD

VR Assistant Charts is an easy to use trader's assistant for working with graphical objects in the windows of the MetaTrader terminal. The utility allows you to change the color, style, thickness and other properties of trend lines, Fibonacci levels, Gann fans and other graphical objects in the MetaTrader terminal in one click. You can request technical support, settings and demo versions of programs in the author's profile. Everything is controlled with the mouse: Clicking on the trend line wil

The indicator Supply Demand RSJ PRO calculates and plots the "Supply" and "Demand" zones on the graph, identifying the type of Zone (Weak, Strong, Verified, Proven) and in case of retests of the Zone it shows how many times it was retested. "Supply" Zones are the price zones where more supply than demand has occurred, driving prices down. "Demand" Zones are the price zones where more demand than supply has occurred, pushing prices up.
Be sure to try our professional version with configurable f
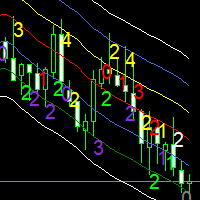
Moving averages are a simple and serious indicator for evaluating the development of a price. But which configuration to choose? 12 periods ? 20 periods? There is not a single moving average setup for all instruments, at all times, for all time periods, simply because not all instruments have the same volatility, they are all very different. They have a signature. The Signature App is a powerful decision support tool. It is based on the use of moving average envelopes. The program calculates th
CAP Breakout EA MT5 Pro is a flexible and powerful metatrader expert advisor that using several breakout strategy and implements many useful features. It using the ZikZak Breakout, Daily candle breakout, London time breakout, Pivot points breakout and several breakout strategy. It offers many customizable trading scenarios and flexible position management settings, plus many useful features like customizable trading sessions, a martingale and inverse martingale mode [ Installation Guide | U
CAP Stochastic EA Pro MT5 trades using the Stochastic Indicator. It offers many customizable Stochastic trading scenarios and flexible position management settings, plus many useful features like customizable trading sessions, a martingale and inverse martingale mode. [ Installation Guide | Update Guide | Submit Your Problem | All Products ]
Before buy Pro version? You can buy alternation pro version, our powerfull EA, CAP Strategy Builder EA . This is strategy builder EA. It produc

https://www.mql4.com The price trend indicator
The price trend indicator accurately shows the changes in market prices , At the same time, this index also shows the future trend of the market price . The indicator does not redraw and does not lag. The recommended time frame is not less than H1 . When the market price is in the light green range, the market is in the rising range, and when the market price is in the light purple range, the market is in the falling range
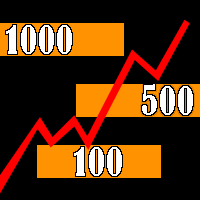
The indicator builds "psychological levels": levels of round numbers and intermediate levels of round numbers.
Round numbers play an important role in forming support and resistance levels. There is a pattern in which the decline or growth of the price can stop at round numbers.
The level whose price ends at 0 is the level of a round number of the first order. Intermediate level, this is the level between two round levels, for example, between 10 and 20 this is level 15.
In the " Num_Zero

This multicurrency Expert Advisor uses 28 currency pairs. For predictions, the advisor uses models trained by the machine learning algorithm in the Python language environment. All signals of this advisor in real time and settings for it can be downloaded from my website forexvisible.com - copy and paste into the browser
The Expert Advisor can work with two time intervals H1 and H2 together or separately parameters in the Use Time Intervals group The profitability of currency pairs can be vie
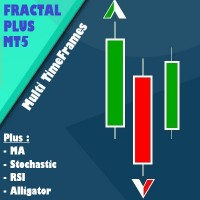
Fractal Plus is a trading tool in the form of an expert advisor. I n it there are 1 indicators that are position execution and 4 indicators that function as filters. You can choose whether each indicator is active or not, it can even be combined according to your trading needs. All filter indicators have multi timeframes options.
Indicators as execution position: 1. Fractal
4 Indicators as Filter: 1. Moving Averages 2. Stochastic Oscillator 3. RSI 4. Alligator
Parameter Information: - Lot

Calculates pivot levels. It paints the histogram depending on the location of prices relative to these levels.
Parameter values: style - select the type of display (Histogram, Line, Arrow) price - price, has little effect on the final look, but this can be customized timeframe - select a timeframe for calculating levels. color over pivot line - color of everything above the pivot level color under pivot line - color of everything below the pivot level pivot line intersection color - the color
FREE

The Checkpoints indicator implements an advanced algorithm for visualizing the market trend. The main application of the indicator is to generate buy and sell signals.
Determining the market trend is an important task for traders. Probably, almost every trader has dreamed of non-lagging MAs at least once. I have embodied this dream in my indicator. With this indicator, you can predict future values.
The indicator is designed to determine either a trend or short-term buy or sell signals. Th

The Interesting Thing indicator visually unloads the price chart and saves analysis time: if there is no signal, there is no deal, if an opposite signal appears, then the current deal should be closed. This is an arrow indicator for determining the trend.
The indicator implements a trend trading strategy, filtering and all the necessary functions built into one tool! The principle of operation of the indicator is to automatically determine the current state of the market when placed on a char

It is a system with many options to help each user find their own settings. There are possibilities to use a filter based on two averages, as well as the choice of whether the system will work at certain hours of the market. The default settings are tested for the eurusd pair. I would recommend that each user do their own testing and find settings that suit their preferences. This is not a ready-made system that you will use without working on it. But it is a good tool to build each user a strat
FREE
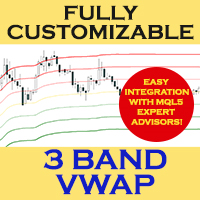
3-BAND VWAP (Volume Weighted Average Price)
Fully customized and EA-friendly VWAP Bands Indicator
MAIN FEATURES:
Choose the period of the VWAP calculation reset (Daily, Weekly or Monthly): For day trading use the Daily VWAP, and for longer term analysis use the Weekly or Monthly calculations.
Fine adjustment of the deviation of the bands: Find the best band’s deviation for the instruments you trade and adjust accordingly.
Customize line colors, style and width according to you

The utility draws reversal levels using the formulas for each of the selected number of candles:
Pivot = (high + close + low) / 3 R1 = ( 2 * Pivot) - low S1 = ( 2 * Pivot) - high R2 = Pivot + (R1 -S1) R3 = high + ( 2 * (Pivot - low)) S2 = Pivot - (R1 - S1) S3 = low - ( 2 * (high - Pivot)) H = high L = low U = if the candle is bullish, then close. Otherwise - open D = if the candle is bullish, then open. Otherwise - close
On any timeframe.
After a new candle closes on the calculated timefr
FREE

The VR Object Delete All script solves the problem of garbage on the chart. it is often necessary to completely clear the chart of everything that is put on it, comments, lines, objects. The script completely deletes everything, even those objects that are not visible. When working, VR Object Delete All writes everything it does in the terminal log, as well as the names of objects to delete. Displays the number of deleted objects as a separate line. in case of any errors, it will display an erro
FREE

Find out in real time which side, buy or sell, is putting the most pressure through a simple and efficient visualization of Depth of Market. The indicator calculates the amount of offers at the specified depths and displays the percentage on each side in relation to the total. PressureBook Indicator is fully customizable, in which you can: Select which symbol you want to track. By default, the selected symbol is the same as the graph in which the indicator was inserted; Define the amount of pri

Capital protector MT5 is an Expert Advisor who works based on the profit and loss of your account. Its functions include: Closing of all orders when a certain profit or loss is reached. Remove any other Expert Advisor installed on a secondary chart when a certain profit or loss is reached. Send a notification to the mobile when a certain loss or profit is reached. To configure the Expert Advisor you will only have to program the loss limit that you are willing to lose or the profit limit that

Description: TrendAccess can optimize your trading time by showing you the trend via two different calculation modes quick and easy.
No more searching for Trends. Just open the chart and look at the trend display.
Features: Shows Uptrend, Downtrend and "No Trend" indicator
Shows the calculated ZigZag Profile
Works on all timeframes Two different calculation Modes (MACD and Candle-based calculation)
Settings: Variable
Standard Value Description
Calculation Mode
Candle based
C

Our Trend entry points should be used as potential market reversal points. The indicator works using the cyclic-wave dependence function. Thus, all entry points will be optimal points at which movement changes.
The simplest use case for the indicator is to open a trade in the direction of an existing trend. The best result is obtained by combining the indicator with fundamental news; it can act as a news filter, that is, show how the market reacts to this or that news.
The default indicator

The expert is based on two moving averages , one of them is used for opening orders and the other one is used for closing , each of them having separate settings . The "Twist" comes from the fact that for closing the orders , the classic condition is not used , if a closing signal appears , the EA has the capability to skip the first or several closing conditions and so the chances for increased profit rises . The expert also has a buit-in recovery mode with a maximum of ten steps , in which , l

The Trend Complete indicator is a signal indicator and has interesting properties. It should be taken into account that this indicator reflects extremes and should be used as an additional one, and another instrument should be used for the entry point. Searches for and displays pivot points on the price chart. Trend indicators are one of the main tools for analyzing trends in the Forex market. The indicator is able to transmit all types of signals to the user: messages, E-mail and Push!
The g

https://www.mql5.com A double moving average indicator This indicator uses the system's own two different time period of moving average indicators to reflect the movement of market prices. It is recommended that you use the default parameter Settings, which you can set according to your own experience to get the best predictive power. I hope it can provide some help for your trading.
FREE

Dragonfly EA is a trend or reversal expert advisor that uses indicators Ichimoku Kinko Hyo , Bollinger Bands , Parabolic SAR , Stochastic Oscillator , Relative Strength Index RSI and On Balance Volume . Dragonfly can be configured to trade on trend or reversal behavior.
Ichimoku Kinko Hyo, Bollinger Bands, Parabolic SAR and Stochastic Oscillator works together to recognize a bull or bear trend, while the indicator RSI filter entry signals according to its configuration and optimization. Dragonf

MEF Algosoftbot
Soft MT5 Single Order Expert Advisors
No Grid Hedging Averaging Martingale Switching
Parameter Input :
1. Broker Option Features for Forex & Synthetic Indices
Broker options MEF Algosoftbot parameter input are adjusted as follows
Brokers that only provide Immediate or Cancel options , choose ICMARKET
Brokers that only provide Fill or Kill options , choose Binary
The broker that provides both options , choose ICMARKET
This Broker Option is to ensure MEF Algosoftbot c
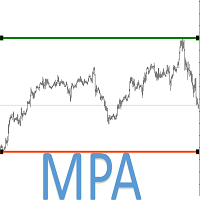
M P A (Multipair Price Action ) It is a multipair system, which uses the value of the support and resistance in the majors to detect the entry points in the EURUSD.
!!!!!IMPORTANT!!!!! THIS EA IS FOR USED IN EURUSD ONLY. !!!!!IMPORTANT!!!!!
This system uses only one operation at a time. It does not use hedging or marging systems, all operations have Stoplost, Take Profit and trailing stop, configurable. The system also allows you to configure the parameters of the value of the pairs in

MACD indicators https://mql5.com This MACD indicator looks slightly different from the MACD indicator found in many other charting software. When the value of the signal line parameter is greater than the value of the MACD parameter, the indicator will give a buy prompt, and when the signal line parameter is less than the value of the MACD parameter, the indicator will give a sell prompt.
FREE
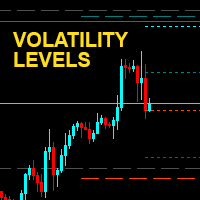
Transfer volatility levels to the chart to understand the nature of the ongoing movements. The levels are calculated based on the volatility recorded in the last few sessions. Easily identify possible targets or swing points for intraday , daily and weekly trading. In addition, the round price levels considered most important are also visible, here the highest trading volumes are usually concentrated. NO REPAINT

MCDX is an indicator based on specific formula to detect Buy and Sell momentum Red Bar means Price go up and Buy momentum. Green Bar means Price go down and Sell momentum" Height of RED bar > 50% means Bull is in control. i.e. RED more than GREEN to go buy. Lower of Green bar < 50% means Bear is in control. i.e. GREEN more than RED to go sell. DARKER RED COLOR - STRONG Up Trend or Strong Bullish Power
LIGHTER RED COLOR - WEAK Up Trend or Weak Bullish Power
LIGHTER GREEN COLOR - STRONG Down

Pivot Point Multi Method MT5 Pivot Point Multi Method MT5 is a fully automatic pivot point indicator and indicate support and resistances (S1,S2,S3,S4,R1,R2,R3,R4) based on four Methods that you can select on of them Pivot point detection and drawing support resistances Methods( Classic ,Camarilla ,Woodie ,Fibonacci)
Pivot Point Multi Method Mt5 is working on all time frames and all currency pairs and gold silver and crypto currencies .
Recommended Setting : Pivot_Method select one of

/ ********** ********** ********** ********** ********** ********** ********** ********** ********** ********** / Big Sales for Easter! Price is reduced > 50 % already! Grasp the chance and Enjoy it! / ********** ********** ********** ********** ********** ********** ********** ********** ********** ********** /
This is a powerful EA that support single order strategy, martingale strategy, multiple timeframes strategy, etc with lots of useful indicators and self define
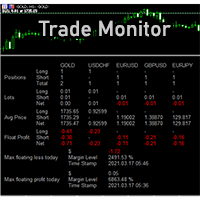
DSProFx Trade Monitor (iExposure) gives you detail information of all trades in your account including total positions, lot size, average price level (Breakeven Level), floating profit, and today's maximum profit/loss. The display is simple. Each data will be separated for every symbol/chart. This indicator will help you monitoring your trades especially if you are working with multiple symbols/charts and open many orders. Just attach DSProFx Trade Monitor in one chart, and it will show all deta
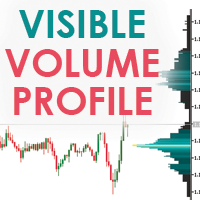
Visible Market Profile graphically represents the amount of trades made on each price level. This indicator in particular, unlike the daily market profile , is calculated on the visible area of the chart.
Visible Market Profile cannot be considered an indicator of operational signals, but it can be a good support for reading the market, in addition to what is already used by every trader in his work process. The Visible Market Profile is able to determine with a good approximation the pric

Description. This EA base on Accelerator oscillator indicator and Parabolic sar indicator. Accelerator oscillator details. set = iAC(_Symbol,_Period); Parabolic sar details. set = iSAR(_Symbol,_Period,0.02,0.2); This is only Buy EA. This EA fixed details in side. Only input is volume. Because i need to keep it simple. Buy order when Accelerator oscillator indicator and Parabolic sar indicator had a signal for buy. Close order when Accelerator oscillator indicator and Parabolic sar indicator had

Dark Absolute Trend is an Indicator for intraday trading. This Indicator is based on Trend Following strategy but use also candlestick patterns and Volatility. We can enter in good price with this Indicator, in order to follow the main trend on the current instrument. It is advised to use low spread ECN brokers. This Indicator does Not repaint and N ot lag . Recommended timeframes are M5, M15 and H1. Recommended working pairs: All. I nstallation and Update Guide - Troubleshooting

Binance è uno scambio di criptovalute di fama mondiale! Al fine di facilitare un'analisi più accurata del mercato delle valute digitali crittografate, il programma può importare automaticamente i dati della linea K di Binance in MT5 per l'analisi.Le funzioni principali sono:
1. Supporta la creazione automatica di coppie di trading spot da parte del dipartimento di sicurezza valutaria e puoi anche impostare separatamente la valuta del profitto e la valuta di base. Se la valuta del profitto Pro

Dark Moon is a fully automatic Expert Advisor for Scalping Trading. This Expert Advisor needs attention, in fact presents highly customizable. Dark Moon is based on Dark Absolute Trend MT5 indicator, these Trades can be manage with some strategies. (Write a review at market to receive 1 paid indicator for free!) The expert advisor is able to get a very high-rate of winning trades. My tests were performed with the real tick date with 99,90% accuracy, actual spread, additional slippage
FREE

The MA Bounce Strategy is a strategy that seeks to long FX pairs on a strong uptrend as they bounce off their MA support and shorting FX pairs on a strong downtrend as they bounce off MA resistance. The best suitable periods of moving averages for that strategy are 18, 30, 50. This indicator helps to identify and find place for potential market entry by MA bounce strategy. More information about MA Bounce Strategy can be read by this link https://www.mql5.com/en/blogs/post/743037 . By defaul

The most crucial price level in any "Volume Profile" is the "Point of Control" . Is the price level with the highest traded volume. And mainly, is the level where the big guys start there their positions, so it's an accumulation/distribution level for smart money.
The idea of the indicator arose after the "MR Volume Profile Rectangles" indicator was made. When creating the "MR Volume Profile Rectangles" indicator, we spent a lot of time comparing the volumes with those from the volume profil

In the "Masters of Risk" trading system, one of the main concepts is related to places where markets change direction. In fact, this is a change in priority and a violation of the trend structure at the extremes of the market, where supposedly there are or would be stop-losses of "smart" participants who are outside the boundaries of the accumulation of volume. For this reason, we call them "Reversal Patterns" - places with a lot of weight for the start of a new and strong trend.
Some of the im

A "Volume Profile" is an advanced charting indicator that displays total volume traded at every price level over a user specified time period. The main components of the volume profile are POC ( Point Of Control - the price level, at which the maximum number of contracts were executed during a selected period), VAH ( Value Area High - the highest price in the Value Area) and VAL ( Value Area Low - the lowest price in the Value Area).
When we settled on the original indicator, we spent a lot o

" A trading range occurs when a financial instrument trades between constant high and low prices over a period of time. The upper part of the trading range of a financial instrument often provides price resistance, while the lower part of the trading range usually offers price support. Traders can enter in the direction of a breakout or breakdown from a trading range... "
This is the "Classical Theory" understanding of ranges. We have a different understanding of the nature of ranges and th
First Scalper is an Expert Advisor based on Scalping, Using the best and safest scalping EA on market. Large number of inputs and settings are tested and optimized and embedded in the program thus inputs are limited and very simple. Using EA doesn't need any professional information or Forex Trading Knowledge.
First Scalper can trade on all symbols and all time frames, using a special and unique strategy developed by the author.
Using EA :
General Options Trade Type : Long/Short/Both S
Automated multicurrency expert advisor working on any type of accounts and with any type of spreads. The Expert Advisor always sets TakeProfit and due to this, even if there are interruptions to the Internet, the orders will be closed on time and at a favorable price. The timeframe on the chart does not matter, you can set any digits. Working timeframe is set directly in the settings of the EA. To protect the deposit and limit possible losses, the EA has two options: the ability to set StopLos

A small utility displays the time in five time zones. You can customize the display of one to five time zones. For each time it is configured: show or not; name; time offset from GMT; color; In general settings, you can change: date / time format ("hh: mi", "hh: mi: ss", "yyyy.mm.dd hh: mi", "yyyy.mm.dd hh: mi: ss") font name; font size; offset from the left edge of the chart; offset from the top edge of the chart;
FREE

Secret Average Trade : this is a revolutionary system unlike any other, the strategy uses algorithms such as grids, averaging, hedging and partially uses martingale algorithms. Trading is carried out on 17 currency pairs simultaneously and uses timeframes: 9. Fully automatic trading with the calculation of entries based on a system of various Trends and also supports reverse trading. Benefits
Partial closure to reduce the load on the deposit. Averaging orders, which are required to close past
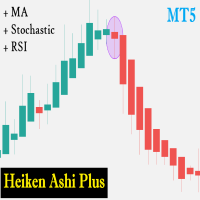
Heiken Ashi Plus is a trading tool in the form of an expert advisor. This EA works based on the change in the color of the Heiken Ashi candle. called a plus because there are additional indicators such as Moving Averages, Stochastic and RSI which you can combine its use with Heiken Ashi candles.
Update V2. = Add Multi TimeFrames Features
Explanation of EA parameters LotMethod : 1 = Fixed Lot, 2 = RiskLot (Freeze of Balance), 3 = Martingale System TrailingStart : Trailing will activated aft

The utility draws pivot levels based on a selection from day week month The previous candlestick of the selected timeframe is taken and the values for the levels are calculated using the following formulas:
Pivot = (high + close + low) / 3 R1 = ( 2 * Pivot) - low S1 = ( 2 * Pivot) - high R2 = Pivot + (R1 -S1) R3 = high + ( 2 * (Pivot - low)) S2 = Pivot - (R1 - S1) S3 = low - ( 2 * (high - Pivot));
The style and thickness for all lines are adjusted.
The colors for the R, Pivot and S line
FREE

Deflection MT5 (MT4 version https://www.mql5.com/ru/market/product/63276 ) - a trend following expert advisor. It is based on strategy of searching entry points in the beginning of a trend. 2 EMA are used for a signal determination. Deflection has an adaptive system of profit and losses targets calculation which is based on current volatility. The control of risks is managed by TP/SL ratio and via setting risk per trade of a balance amount. Stop Loss and Take Profit targets in points are calc

The Relative Strenght Index presented to the world in 1978 by J. Welles Wilder Jr. in his book " New Concepts in Technical Trading Systems " is widely used around the world in several ways, not only with the traditional approach of Overbought and Oversold states, which in several cases and depending on the assets and timeframes it just simply doesn't work anymore . BUT, this indicator has its value when used, for instance, looking for divergences between its measuring system and the Prices appea

This indicator sums up the difference between the sells aggression and the buys aggression that occurred in each Candle, graphically plotting the waves of accumulation of the aggression volumes. Through these waves an exponential average is calculated that indicates the direction of the business flow.
Note: This indicator DOES NOT WORK for Brokers and/or Markets WITHOUT the type of aggression (BUY or SELL). Be sure to try our Professional version with configurable features and alerts: Agr
FREE
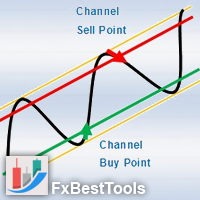
Channels Indicator is an All-In-One Indicator with a powerful calculation engine. The Indicator contains 4 different and usual methods for finding channels on the market. Indicator is powered by a visual interface and with various selections of alerts and notifications.
Testing Indicator : Strategy Tester does not respond to your clicks on panels (This is metatrader tester limitation). Thus input your desired settings on the indicator pre-settings and test.
Using Indicator :
Display
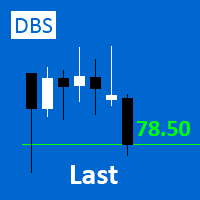
A small utility displays the value of the last price (Last) to the right of the chart. The Last price is the price at which the last deal was executed. Utility is convenient to use for screens with small print, for visual observation of the price level (value) or for people with poor eyesight. You can customize: Growth color Fall color Text font Font size Offset text
FREE

The indicator paints the candlesticks of the chart in colors calculated from the values of the strengths of the bulls and bears.
It works like this:
The values of the two indicators Bears and Bulls are taken, and who is stronger on the candlestick is compared. It's all.
.
FREE
Professional traders know that volume is the fuel for price movement. Large players try to hide their true intentions, but they can be recognized by volume bursts. The standard vertical volume does not show us specific price levels, but the cluster volume and especially its surges provide a very clear picture and specific price levels (areas).
The DBS Cluster Search indicator searches for clusters of the specified size in tick data and highlights them with colored figures on the chart. These

The indicator plots dynamic POC, VAH and VAL levels for a specified period from tick data. POC - Point Of Control, the price at which the maximum volume has accumulated over a certain period of time (POC in the volume profile). VA - Volume Area, the zone of the fair value of the asset. VAH - Volume Area High. VAL - Volume Area Low. The DBS_DynamicLevels indicator plots dynamic levels where the calculation point is the maximum volume level (POC) and zone VAH / VAL. The indicator shows the history

The Better Volume indictator improves the comprehension on volume by coloring the classical histogram bars . The colors point out differents nature of volume .
The Better Volume OnOff allows to open/close the subwindow through a botton or using the keyboard only. There is the possibility to customize 3 symbols and assign them different parameters for each time frame .
The indicator improves the comprehension on volume by coloring the classical histogram bars : CLIMAX UP -
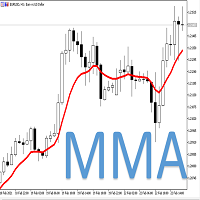
This system use M M A (Multipair Moving Average ) It is a multipair system, which uses the value of the averages in the majors to detect the entry points in the EURUSD.
!!!!!IMPORTANT!!!!! THIS EA IS FOR USED IN EURUSD ONLY. !!!!!IMPORTANT!!!!!
Only one operation at a time. It does not use hedging or marging systems, all operations have Stoplost, Take Profit and trailing stop, configurable. The system also allows you to configure the parameters of the averages that give us the entry and

Индикатор Trading Strategy призван помочь трейдерам в поиске оптимальных входов в сделку и выходов из неё. В его основе лежат показания технических индикаторов (MA, RSI, ATR и др.), а также авторский алгоритм, связывающий их сигналы в единое целое. Индикатор даёт сигналы на покупку и продажу в виде стрелочек: стрелочка вверх — сигнал на покупку, вниз — на продажу. В правом верхнем углу показаны сигналы индикатора на 6 таймфреймах (M1, M5, M15, M30, H1, H4) данной валютной пары. Индикатор свои з

TRADE CLOSER is an Expert Advisor which manage your manual trades. One click and all your manual trades are handled, the Expert Advisor doesn't trade. The Expert Adviser can : CLOSE ALL TRADES CLOSE PROFITABLE TRADES ONLY CLOSE LOSABLE TRADES ONLY CLOSE MOST PROFITABLE LOSABLE TRADES CLOSE PAIR ON PROFIT, you specify the amount and the target pair will close profit CLOSE ACCOUNT ON PROFIT, you specify the amount of all pairs on profit and account will close profit. Close all your trade

White Crow Indicator
by VArmadA A simple yet powerful candle analysis based indicator using the White Soldiers & Crow patterns.
Works with timeframes 1H and higher and tested on all major pairs. Pay attention to the signal: An arrow indicating a long or short entry.
How It Works:
Arrows indicate a ongoing trend. After multiple bullish or bearish candles in a row the chances for another candle towards that trend is higher.
Instructions: - Crow Count: Set the number of candles that n
FREE

This EA will read news from MQL website and create global variable to indicate if there is a news reported within the specified time frame. You can then read these global variable in your EA to filter out trades. Global variable format - News_CHF, News_EUR, News_GBP, News_JPY and News_USD If value is 0 means no news. If value is 1 means there is news reported within the specified time frame.
Please comment to give suggestion to improve it.
FREE

Coiote Book Balance é um indicador que monitora o livro de ofertas e indica de maneira simplificada o níveis de renovação de ordens agrupados no timeframe gáfico, mostrando quanto o maior lado renovou e a diferença dessas renovações. Além disso, é possível visualizar em quais preços estão as maiores ordens da cada lado, o preço teórico dessa liquidez e a quantidade de lotes em tempo real. Para correto funcionamento do indicador é preciso que o livro de ofertas seja aberto antes da inclusão do in

Индикатор RSI MT5 - это индикатор Metatrader 5, и суть этого технического индикатора заключается в преобразовании накопленных исторических данных на основе индикатора RSI. Сигналы показаны разными цветами свечей. Смотрите настройки, тестируёте. Это очень полезный индикатор и он точно должен быть у вас . The RSI in candlelight MT5 indicator is a Metatrader 5 indicator, and the essence of this technical indicator is to transform the accumulated historical data based on the RSI indicator. Signals a

Описание индикатора будет крайне коротким. Индикатор Коридор тренда показывает трейдерам зону в которой находится валюта и даёт понимание по какому тренду движется рынок. Визуально очень хорошо воспринимается. Уровни взяты и просчитаны не просто. Полезный индикатор для арсенала индикаторов трейдера. The description of the indicator will be extremely short. The Trend Corridor indicator shows traders the zone in which the currency is located and gives an understanding of which trend the market is
Il MetaTrader Market è un negozio online unico di robot di trading e indicatori tecnici.
Leggi il promemoria utente di MQL5.community per saperne di più sui servizi unici che offriamo ai trader: copia dei segnali di trading, applicazioni personalizzate sviluppate da freelance, pagamenti automatici tramite il Sistema di Pagamento e il MQL5 Cloud Network.
Ti stai perdendo delle opportunità di trading:
- App di trading gratuite
- Oltre 8.000 segnali per il copy trading
- Notizie economiche per esplorare i mercati finanziari
Registrazione
Accedi
Se non hai un account, registrati
Consenti l'uso dei cookie per accedere al sito MQL5.com.
Abilita le impostazioni necessarie nel browser, altrimenti non sarà possibile accedere.