DrawChartPattern MT4
- Indicateurs
- Kazuya Yamaoka
- Version: 1.1
- Mise à jour: 25 juin 2023
- Activations: 5
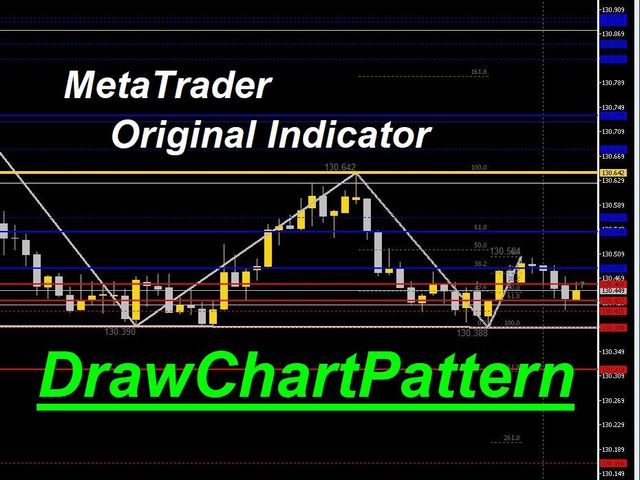
The chart pattern is automatically drawn.
It also automatically tells you the price at which you are most likely to buy or sell according to the pattern.
Therefore, there is no need to memorize patterns or draw lines by yourself.
We are live-streaming the actual operation of the system.
Please check for yourself if it is usable.
Please check it out for yourself.
https://www.youtube.com/@ganesha_forex
We do not guarantee your investment results. Investments should be made at your own risk.
We sharll not be liable for any disadvantage or damage caused by the use of the information provided.