Regardez les tutoriels vidéo de Market sur YouTube
Comment acheter un robot de trading ou un indicateur
Exécutez votre EA sur
hébergement virtuel
hébergement virtuel
Test un indicateur/robot de trading avant d'acheter
Vous voulez gagner de l'argent sur Market ?
Comment présenter un produit pour qu'il se vende bien
Indicateurs techniques pour MetaTrader 4 - 109
Индикатор объёмов отличный помощник в трейдинге. Индикатор не перерисовывается и не меняет значения при переключении таймфреймов. Индикатор объёмов MTF, показывает текущую тенденцию на графиках. Рекомендую торговать в сторону сигналов старших таймфреймов The volume indicator is a great assistant in trading. The indicator does not redraw and does not change values when switching timeframes. MTF volume indicator, shows the current trend on the charts. I recommend trading in the direction of highe

This is a new strategy for SUPPLY DEMAND areas It is based on a calculation using the tick volume to detect the big price action in market for both bear /bull actions this smart volume action candles are used to determine the supply and demand areas prices in between main supply and demand lines indicate sideway market up arrows will be shown when prices moves above the main supply and the secondary supply lines Down arrows will be shown when prices moves below the main demand and the secondary

One of the main definitions for monitoring the currency market is a trend, which is why the Citizen indicator was created in order to display the trend in a visual form. You should use the indicator as an additional indicator, that is, you need to use this indicator for example to perfectly display price movements! Its signals are based on a reliable algorithm. When used simultaneously on multiple timeframes, this indicator truly "makes the trend your friend". With it, you can follow trends on m

The main purpose of the Deathly indicator is to evaluate the market. Red dots indicate that the priority should be to open SELL positions. The blue color indicates that it is time for BUY trades. Using the indicator is very convenient and easy. The indicator is universal. It is applied at any time intervals. You can use the indicator to trade different assets. The tool is perfect for Forex trading. It is actively used for trading in commodity, commodity and stock markets.
The indicator implem

With the help of the Elephant Forex indicator algorithm, you can quickly understand what kind of trend is currently developing in the market. The indicator indicates on the chart the main trend at the current moment in the market. A change in direction, in terms of market fundamentals, means a shift in trading interest towards sellers or buyers.
If you do not take into account speculative throws, which as a result do not affect the overall trend, then the moment of a real “reversal” is always

The advantage of working on the Special Agent signal indicator is that the trader does not need to independently conduct a technical analysis of the chart. Determining the market trend is an important task for traders, and the tool gives ready-made signals in the form of directional arrows. This tool is an arrow (signal).
Special Agent is a trend indicator, a technical analysis tool that helps to determine the exact direction of the trend: either up or down price movement for a trading pair o
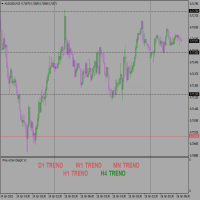
This is a price action traders delight, Too much of Indicators are bad on the chart so also to much of analysis can cause analysis paralysis. No need for Top down analysis, The EA does that for you based on Monthly, Weekly, Daily, And 4hrs trend readings on same window. Supports all time frame trading. Make your trading seem less and takes it to the next level. Its new and first of its kind with 5yrs development process. Just work with the colors ( Green for Bullish Market and Red for Bearish)

The Andhadhun trend step indicator will give you stability if you follow his signals. And you will be able to distinguish between work and the emotional component. It basically uses the process of identifying the rate of change in price growth and allows you to find entry and exit points from the market. Just look at the screenshots and you will determine the principles of working with the indicator yourself.
The indicator analyzes the state of the market, the phase of its movement and largel

A fundamental technical indicator that allows you to assess the current market situation in order to enter the market of the selected currency pair in a trend and with minimal risk.
Many beginners who first enter the market often have better luck than a professional who has spent years learning. The reason for this phenomenon is the unconscious entry of beginners into the trend, when even without any indicators it becomes clear where the market is moving.
The Apartment indicator basically

The Bridge indicator displays potential entry points on the chart as signals (points of absolute trend reversal).
The Bridge forex indicator algorithm was created on the basis of the original indicators for searching for extremes, the indicator is well suited for determining a reversal or a large sharp jerk to one side, thanks to it you will know when this happens, it will notify you with the appearance of a blue dot to buy red to sell. The indicator, according to a certain algorithm, qualifi
ZigZag предназначается для анализа движений цен с заданной амплитудой. Индикатор изображает только самые важные развороты, что значительно облегчает оценку графиков. Стрелки показывают БАР, на котором последний Low/High полностью сформирован. ZigZag is designed to analyze price movements with a given amplitude. The indicator shows only the most important reversals, which greatly facilitates the evaluation of charts. The arrows show the BAR where the last Low/High is fully formed.
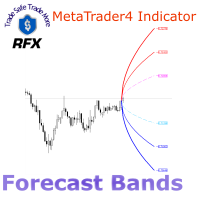
The RFX Forecast Bands indicator calculates the three significant confidence levels, 99%, 95% and 68% of price movement for a configurable number of bars in the future. The essence of calculations is based on statistical analysis of the asset's recent price changes. These levels can be used for many different purposes in trading systems. For example, one can use them for setting the target profit and stop loss levels effectively. The extreme upper and lower bands represent 99% confidence level,

Индикатор Super Ma Arrows состоит из модифицированной средней скользящей и стрелок. Индикатор предназначен для скальпинга. Индикатор Super Ma Arrows не перерисовывает не меняет значения при переключении таймфреймов The Super Ma Arrows indicator consists of a modified moving average and arrows. The indicator is designed for scalping. The Super Ma Arrows indicator does not redraw does not change values when switching timeframes
This indicator helps to trade in the right direction of the market, by knowing the bias of the market. If you are a swing trader this is the best indicator for you. You will just see the bias on the top right of your chart/screen. You can sometime wait for reversals then continue with the trend/bias. Indicator is based on moving averages and showing daily bias of the market. KEEP IN MIND THAT THE BIAS IS STRICTLY SHOWING THE DAILY TIMEFRAME TREND ONLY.
You can check the video attached.

Hello traders nice scalping tool
this indicator design for find best point to enter market in all time frame
indicator no repaint , no redraw , no lagging very accurate indicator just test it in strategy tester and see yourself !
you can use it for any pairs and indices CFD base of this indicator is cci so you can change period of it in input taps of indicator but default is optimized before ! good luck
Níveis de suporte ou resistência formados quando a ação do preço de um mercado reverte e muda de direção, deixando para trás um pico ou vale (ponto de oscilação) no mercado. Os níveis de suporte e resistência podem criar faixas de negociação. O indicador identifica High e Low com base no Período.
Características principais Um conceito chave da análise técnica é que quando um nível de resistência ou suporte é quebrado, seu papel é invertido. Se o preço cair abaixo de um nível de suporte, esse

This indicator simplifies your entry zones by displaying the areas where you can plan your entry that potentially could give you high risk/reward ratios. Other than picking the most optimal entry points, the Hot Zone indicator can act as your typical support/resistance indicator for pullbacks for all timeframes. You can use this indicator as the only trading indicator or use it with another indicator for reentry purposes. Besides, when using Hot Zones, the risk/reward ratio should be well abov
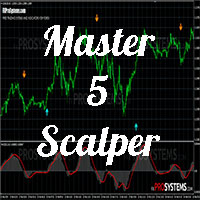
Hi traders, especially scalpers this time I introduce a special indicator for scalpers on a 5 minute time frame
This indicator is expected to be helpful for beginners who are confused about looking for a scalper indicator that is easy to understand
ok go ahead
This indicator only runs on a 5 minute time frame This indicator is also able to provide notifications to traders via mobile by entering MQID on your trading platform This indicator uses the modified stochastic oscillator method in
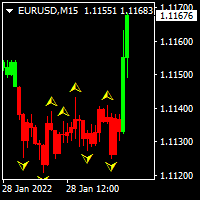
This indicator helps you to build position and profit when market turns in your favor. You will build your full position by trading many small position. If there is green colored candle on the chart, you could add long position. If there is red colored candle on the chart, you could add short position. I personally spread my full size position in to 5-10 small position. I use small target of 2-5 pips on eurusd pair.
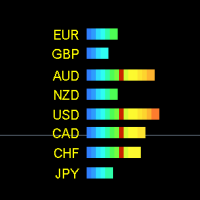
"Forex strength meter full" is a new improved version of the popular indicator. In this version, we have changed the input filters and made the indicator signals faster and more accurate. Now this indicator can be used in trading even more effectively than its basic free version. The new version of the indicator is built on self-learning algorithms and is able to self-analyze its signals in order to exclude false information data flows.
Why should you use this indicator? It shows the directio
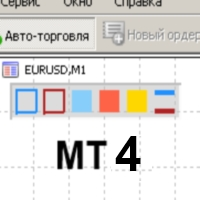
Color Levels - удобный инструмент для тех, кто использует технический анализ с использованием таких инструментов, как Трендовая линия и Прямоугольник. Имеется возможность настройки двух пустых прямоугольников, трех закрашенных и двух трендовых линий. Настройки индикатора крайне просты и делятся на пронумерованные блоки: С цифрами 1 и 2 вначале - настройки пустых прямоугольников (рамок); С цифрами 3, 4 и 5 - настройки закрашенных прямоугольников; С цифрами 6 и 7 - настройки трендовых линий. Объе

Этот индикатор имеет универсальный алгоритм торговли, который основан на импульсе цены . Все максимально упрощено - только сигналы на Buy и Sell . Есть оповещения, чтобы не пропустить открытие позиции.
Не требует оптимизации и дополнительных настроек!
Для любых типов инструментов: валюты, нефть, металлы, криптовалюты. Для любых таймфреймов: от M1 до D1 . Для любых стилей торговли: скальпинг, интрадэй, свинг, долгосрок . Если Вам необходима дополнительная информация или есть вопросы
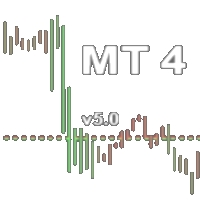
Индикатор закрашивает бары по цвету, выбор цвета ведется из расчета торгового объема валютного инструмента. вертикальную линию есть возможность перемещать для изучения на исторических данных горизонтальные линии отвечают за максимальный и минимальный бар зеленый большой объем красный маленький объем настройки: выбор ширины окраски бара выбор количество баров для расчета
Есть возможность доработать индивидуально: вывод звуковых сигналов вывод сообщения в телеграмм комбинировать с другим индика

The Qv² Halifax - Indicator developed through a complex series of calculations, which aims to easily identify buylng and selling signals.
Buy signal are indicated by up arrows.
Sell signal are indicated by down arrows.
An important detail: In order to make the indicator work, the timeframes M1, M5. M15. M30, H1 D1 must be all updated.
It can be used on all pairs (I use it on Gold).
it is a very good deal in the trending market
To learn more about my work click here

The indicator (Current Strength) is represented in a separate window by Blue and Pink histogram . The parameter NPeriod represents the number of bars on which we calculate the variation of forces, the recommended value is 5. The Blue histogram measures the buyers force , while the Pink histogram measures the sellers force . The change in color signifies the change in strength which leads t he price . Each drop (especially below 52.8) after touching levels 96.3 or 1.236 must be condidered

(Traduction automatique) La plupart des commerçants connaissent le célèbre indicateur japonais Heikin-Ashi , créé dans les années 1700 par Munehisa Homma . On l'écrit parfois Heiken-Ashi , mais sa signification reste la même, à savoir « barre moyenne » en japonais. Il s'agit d'une implémentation de cet indicateur Heikin Ashi très connu, mais avec quelques fonctionnalités supplémentaires. D'une part, il permet à ses valeurs d'être pondérées par le volume , qu'il s'agisse du volume du nombre de ti
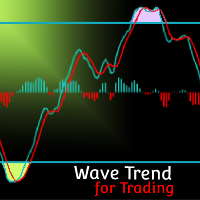
MT5 Version Wave Trend MT4 Wave Trend is an oscillator, which helps identifing in a extremely accurate manner market reversals. The Oscillator being obove the overbought level and a cross down of the fast into the slow MA usually indicates a good SELL signal. If the oscillators is below the oversold level and the fast MA crosses over the slower MA usually highlights a good BUY signal. The Wave Trend indicator can be also used when divergences appear against the price, indicating the current mo
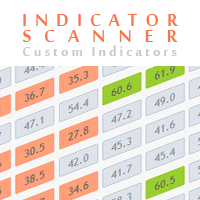
Advanced Indicator Scanner is a multi-symbol multi-timeframe scanner that works with hundreds of custom indicators available across the web including mql5 website market and codebase indicators.
Advanced Indicator Scanner features:
Scans your indicator in 28 customizable instruments and 9 timeframes. Monitors up to 2 lines(buffers) of an indicator. Showing of indicator value on buttons. You can choose between 3 alert modes: Single symbol and timeframe Multiple timeframes of a symbol Multipl

RSI Trend Line is a simple indicator that draws trend lines.
Parameters:
Level Step - the step between the highs and lows.
Period_RSI - standard parameter of the RSI indicator.
Upper Line Color - sets the color of the trend lines for UP.
LowerLine Color - sets the color of the trend lines for Down.
Alerts - the parameter is responsible for On/Off notifications when trend lines intersect with RSI. By default, it is On.
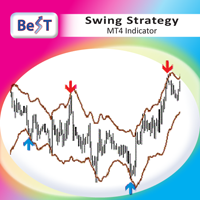
BeST Swing Strategy is a Metatrader indicator based on the corresponding Jim Berg's work about volatility as described in his article "The Truth About Volatility" (TASC 2/2005).The indicator consists of 2 channel lines deriving as (MA +/- times the ATR) and can be used as a standalone trading system.The outlier prices of the Market as of the indicator's values can be used for producing Entry and Exit Signals.
Advantages of the indicator == Uses 2 Swing Strategies (Normal and Reverse)
== Ne
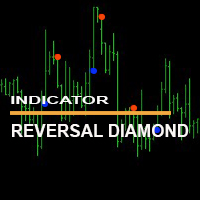
Индикатор " Reversal Diamond Indicator" мощный инструмент для торговли на рынке форекс. " Reversal Diamond Indicator" не перерисовывается и не меняет свои значения при переключении временных периодов. The "Reverse Diamond Indicator" indicator is a powerful tool for trading on the forex market. The "Reverse Diamond Indicator" does not redraw and does not change its values when switching time periods.

Индикатор " Nostradamus ind" мощный инструмент для торговли на рынке форекс. " Nostradamus ind" не перерисовывается и не меняет свои значения при переключении временных периодов. The "Nostradamus ind" indicator is a powerful tool for trading on the forex market. "Nostradamus ind" does not redraw and does not change its values when switching time periods.

Индикатор "Trend direction ind" является трендовым индикатором. Индикатор "Trend direction ind"не запаздывает, выдает сигналы на нулевом баре и не перерисовывает при переключении таимфреймов. С индикатором "Trend direction ind" вы будете с легкостью определять текущую тенденцию. The "Trend direction ind" indicator is a trend indicator. The "Trend direction ind" indicator does not lag, gives signals at the zero bar and does not redraw when switching time frames. With the "Trend direction ind
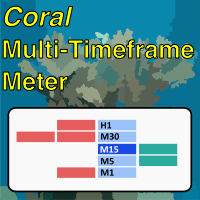
Coral Multi TF Meter allows you to quickly see how price is moving on a single currency pair across multiple timeframes at once. You can select which timeframes to display; the size, position, colors of cells; whether to display values or not; and how often the meter is updated. The calculation is based on ATR distance for each displayed timeframe. Hover over the header cell for the row (with the currency name in it) to see the current ATR value (in pips) for that period. When "Display Values
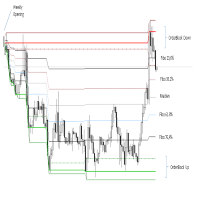
The indicator is activated at the beginning of each week and detects both bullish and bearish ORDERBLOCK potentials. These levels are of high operational probability, being able to use a minimum ratio of 3 to 1 to maximize profits. It is recommended to use pending orders at the OB levels of the chart and place the SL up to a maximum of 20 pips from the entry price.
Submit the indicator to Backtesting to become familiar with its performance and complement it with other trend or oscillation typ

The indicator is triggered at the start of each trading day and detects both bullish and bearish ORDERBLOCK potentials. These levels are of high operational probability, being able to use a minimum ratio of 3 to 1 to maximize profits. It is recommended to use TimeFrame M5 to M30 for a proper display and consider pending orders at the OB levels of the chart and place the SL up to a maximum of 20 pips from the entry price.
Submit the indicator to Backtesting to become familiar with its performa

A machine translation from the English product description was used. We apologize for possible imprecisions. Une traduction automatique de la description du produit en anglais a été utilisée. Nous nous excusons pour les éventuelles imprécisions. Un système de visualisation des modèles d'action des prix des chandeliers préférés. Une fois attaché, l'indicateur marquera automatiquement les modèles suivants sur le graphique : Barre Pinocchio - une barre de petit corps avec un long «nez», motif inve
Индикатор "BO indicator at zero bar" для торговли бинарных опционов. Индикатор выдаёт свои сигналы на нулевом баре не перерисовывает и не меняет свои показатели при переключении временных периодов. Рекомендую использовать индикатор совместно с другим индикатором как фильтр "BO indicator at zero bar" indicator for binary options trading. The indicator gives its signals on the zero bar, does not redraw and does not change its indicators when switching time periods. I recommend using the indicato
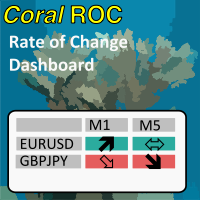
Coral Rate of Change Dashboard displays "rate of change" calculations across multiple symbols and timeframes simultaneously. See at a glance which pairs are moving, and how quickly. Receive alerts when any symbol + timeframe is experiencing very strong movement. You can display data for currency pairs, or for individual currencies (takes the average for each currency across all available pairs). See the CoralDash product description for the core functionality of the dashboard (symbol exposu
Индикатор "Reversal zone" показывает силовые уровни и возможные точки разворота на текущем графике. Индикатор "Reversal zone" поможет трейдеру разобраться с текущей ситуацией The "Reverse zone" indicator shows power levels and possible reversal points on the current chart. The "Reverse zone" indicator will help the trader to deal with the current situation

Индикатор "Trend zone" Помощник трейдеру, показывает на графике текущую тенденцию. Он надеюсь станет незаменимым индикатором в ваше трейдинге. Индикатор не перерисовывается и не меняет свои значения про переключение временных периодов The "Trend zone" indicator is a trader's assistant, shows the current trend on the chart. I hope it will become an indispensable indicator in your trading. The indicator does not redraw and does not change its values about switching time periods
Индикатор "Zigzag levels" основан на индикаторе зигзаг. Индикатор показывает зоны уровней поддержки и сопротивления относительно индикатору зигзаг. Индикатор "Zigzag levels" сделает хорошую службу в вашем трейдинге. Всем больших профитов!!! The Zigzag levels indicator is based on the zigzag indicator. The indicator shows the zones of support and resistance levels relative to the zigzag indicator. The Zigzag levels indicator will do a good service in your trading. Big profits for everyone!!!

The Omega Point indicator uses a complex multilayered system that is used by the top world traders which helps to determine the beginning of trends that are highly likely to last for a long time. The system uses several complex trend calculation modes, due to which the indicator adapts to the specifications of different currency pairs, and is suitable for both conservative and aggressive trading. The indicator makes the necessary calculations and shows important information about how the trade
L'indicateur recherche et affiche automatiquement de grandes ombres sur le graphique en fonction de la volatilité. Les ombres sont en outre filtrées par la taille de l'onde. L'algorithme analyse la répartition de la fractale avec une ombre dans une plage spécifiée et affiche le niveau. Dans les paramètres, vous pouvez activer le tableau de bord multi-devises. Alert est sélectionné entre le graphique actuel ou toute la feuille de tableau de bord. Les signaux sur les grandes ombres et ceux qui on
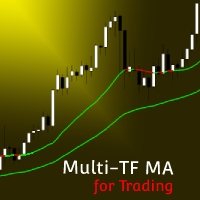
MT5 Version Multi Timeframe MA MT4 Multi Timeframe MA MT4 is an indicator that offers the representation of up to 3 MAs with different Periods and Timeframes. This allows the user to reprensent in one chart and timeframe information coming from other timeframes and get notified as any of the MAs crosses another one. Multi Timeframe MA is the first indicator in the market that offers Multi Timeframe interactions and a high customization level from up to 7 different MA types (SMA, EMA, WMA,
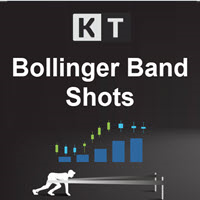
KT Bollinger Shots works using a striking blend of the slingshot pattern and the mean-reversion phenomenon applied to financial markets.
In addition, a mathematical algorithm is used with variable deviation to fine-tune the indicator's signals on a different level.
Winning Trade: After a signal, if price touches the middle band in profit, it is considered a winner. Losing Trade: After a signal, if price touches the opposite band or touches the middle band in loss, it is considered a loser.
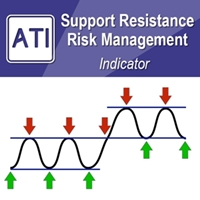
Introduction to Support Resistance Risk Management Support Resistance is the most trusted technical analysis. However, the risk management for the support and resistance is not practiced often. Hence we provide one effective risk managment method for the support and resistance trader. In the book: Scientific Guide To Price Action and Pattern Trading (Wisdom of Trend, Cycle, and Fractal Wave), how to use Support Resistance is described as well as Fibonacci Analysis, Harmonic Pattern, Elliott Wave

The indicator signals the appearance of a possible divergent bar based on the shape of the bar without angulation detection. A bullish divergent bar is a bar that closes in its upper half (the higher the better), has a lower minimum than the previous bar, and drops sharply away from the Alligator indicator. A bearish divergent bar is a bar that closes in its lower half (the lower the better), has a higher high than the previous bar, and moves up sharply from the Alligator.
SETTINGS History - h

The indicator signals the appearance of a possible divergent bar based on the shape of the bar and its standard deviation from the Alligator indicator. A bullish divergent bar is a bar that closes in its upper half (the higher the better), has a lower minimum than the previous bar, and drops sharply away from the Alligator. A bearish divergent bar is a bar that closes in its lower half (the lower the better), has a higher high than the previous bar, and moves up sharply from the Alligator. Stand
PAX BDB Trade Chaos system of Bill Williams (Bearish/Bullish divergent bar)
One of the signals of the "Trade Chaos" system of Bill Williams. (First wiseman) When bar moving away from the "Alligator" indicator and there is divergence on the Awesome Oscillator indicator, it shows a potential point of movement change. It is based on the opening/closing of the bar, the position relative to the previous ones, the Alligator and AO. When trading, the entrance is at the breakthrough of the bar(short

Scalping channel - indicateur de la direction du mouvement des prix. Là où le canal regarde, le prix s'y déplace. Lorsque le canal regarde vers le bas et que le prix est au sommet du canal, nous ouvrons une transaction de vente. Lorsque le canal lève les yeux et que le prix est au bas du canal, nous ouvrons une offre d'achat. Il s'agit d'une stratégie de scalping simple pour les échanges intrajournaliers sur les périodes M1, M5, M15, M30.
Tous ceux qui achètent cet indicateur recevront en ca

L'indicateur en temps réel donne des signaux d'achat et de vente. Lors du choix de la direction selon la tendance principale, environ 75-80% des signaux sont traités en profit. Absolument tous les signaux restent sur le graphique et ne changent pas leur position, de sorte que vous pouvez facilement tester le travail de l'indicateur à la fois sur l'histoire et dans le testeur de stratégie. Les paramètres de l'indicateur sont simples et logiques: le paramètre Velocity est responsable du nombre et

Scalping Snake Pro est un indicateur de scalping unique qui montre au trader les moments d'inversion des prix et ne redessine pas. Cet indicateur, contrairement à beaucoup d'autres sur Internet, ne redessine pas ses valeurs. Il dessine des signaux sur la toute première barre, ce qui vous permet de ne pas être en retard avec l'ouverture des offres. Cet indicateur envoie des notifications au commerçant par téléphone et par e-mail lorsqu'un signal apparaît. Vous obtenez toutes ces fonctionnalités
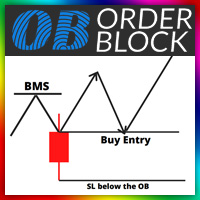
Orde Block Detector: The order block detector can automatically identify the breakthrough of the market structure. After the trend framework breaks through, the order block area can be drawn automatically. In order to draw the OB area more accurately, we also automatically find the candle on the left and right sides of the original candle according to its trading principle, and draw a more accurate ob area through more subtle quantitative rule judgment. Futures : 1. Customize the BMS color, and

Cet indicateur de zone d'offre et de demande dessine les zones sur le graphique et envoie des alertes lorsque le prix a atteint ou cassé une zone. Il est également possible de l'utiliser pour être alerté des doubles hauts/bas réguliers au lieu des zones. Il est possible d'utiliser des filtres RSI, de volume et de divergence pour filtrer uniquement les configurations les plus fortes. Combiné avec vos propres règles et techniques, cet indicateur vous permettra de créer (ou d'améliorer) votre propr
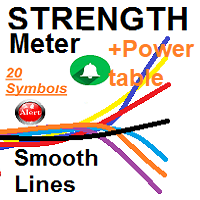
separate indicator window for Currencies Strength smooth lines for up to 20 symbols based on (5) time frames &&& MAIN Window Power TABLE for up to 20 Symbols for (5) timeframes and the Total calculated Symbols strength for each
1- Currencies Strength - It draws smooth lines for up to 20 currencies pairs representing Volatility strength and power calculated by 5 selected time frames not only ***Works on any Time frame but i recommend from M15 M30 H1 .... (lowest frames need higher index of
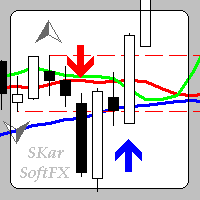
The indicator is designed to detect breakouts of the Bill Williams fractal level on the instrument chart in the MetaTrader 4.
After installing the indicator on the instrument chart, when a breakdown of the Bill Williams fractal level occurs, the signal bar (candle) is marked with a colored pointer (arrow) in the direction of the breakdown.
For greater clarity, you can add a standard indicator "Bill Williams Fractal" to the chart of the instrument.
When adding the indicator to the instrume
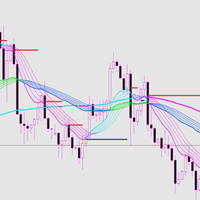
This indicator has good trend malleability and a good trend resistance support line. Index characteristics The color changes, following the trend of different levels. The support and resistance line means that the price follows or reverses.
Basic display A price tag showing historical support and resistance. Shows the approximate recommended range of historical entry positions, as well as take-profit and stop-loss recommendations, and target forecasts. Display the judgment of the current direc

Bollinger Bands Breakout Strategy has an Arrows and Scanner Dashboard indicator set. It is for MT4 (Metatrader 4) platform.
When price breaks out of a Bollinger Outer Band in a powerful way, it becomes a great position for scalping. Because the next few bars will most likely keep going in the same direction. Especially if Middle band is also sloping towards that breakout. It's also great for Binary options when using 2-3 next few bars.
Strategy: BUY Bollinger Bands:
- Price breaks out of
The Market Reversal Catcher indicator looks for market reversal points or major pullback. To do this, it analyzes previous price movements and using a flexible algorithm for estimating the probability of a reversal, also gives recommendations on entry points and sets recommended profit targets for positions opened on a signal.
Market Reversal Cather User Guide - Read
Version for MetaTrader 5 - here The indicator is very easy to use and does not require a lot of information to understand ho
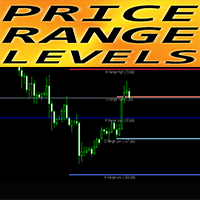
Forex Indicator "Room_UP_DWN_Day_Week_Month" for MT4 Indicator " Room_UP_DWN_Day_Week_Month " is very useful auxiliary indicator It shows you daily, weekly and monthly most probable levels , which can be reached by price (price range levels). Daily range is useful for intraday traders Weekly & Monthly ranges are for Swing and Long term traders Indicator is excellent to plan your Take Profit targets or arrange Stop Losses . // More great Expert Advisors and Indicators are available here: https
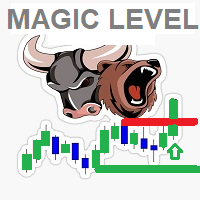
::: THE MAGIC PRICE LEVEL ::: * this smart indicator detects market direction By identifying super candles and Big Price Actions to generate major support/ resistance levels * It detects the major breakout Candles with Candle body size and shows it in a separate window to give a great indication of market power and direction * Support resistance lines are detected by a unique strategy using bars patterns and bars size * the only major magic Price level will be showed on the chart depending o
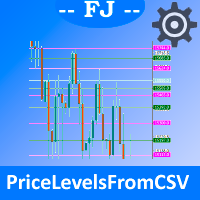
This indicator allows you to load different prices, price lines, from file. You can easily import the same information between all your windows, without the worry of replicating the same information window to window. In addition, up to 6 different groups are allowed to be able to configure their visualization in a different way and the possibility of activating or not visually each group, at your convenience.
Configuration, indicator variables:
-IndicatorON_OFF: Allows you to enable or di

Supply Demand Zones indicator for possible BUY / Sell Zones based on smart volumes indicator two levels of buy/Sell Zones : Main BUY/SELL area SUPPLY area in Red DEMAND area in Green your strategy is to follow generated Arrows : 1- you can Buy when price is Closed above a green BUY area and above high of previous candle 2- you can Sell when price is Closed below a red SELL area and below low of previous candle Also, a separate indicator window for SMART CANDLES used to detect the Big Supp

Fibo Panda is an indicator that can help you predict the end of daily trends. If the daily price has reached the END L4 or END H4, means the Daily volume is enough. If the daily price has reached the Highest or Lowest, means the price has reached the highest or lowest level. Price must touch the End Hi or End Low Level to complete the price movement of each timeframe. A conclusion can be made whether to buy or sell. If the price is in the High Guard and Low Guard areas it means the price is now

BPS BoS - Break of Structure
BoS - Fractal mode , MTF
BoS - Zigzag mode , MTF
Show HH and LL
Alerts - Popup , Push notification and eMail Option to create screenshot on alert Enable / Disable Indicator with a button on chart to select options
Choose corner of button location
It is not a system but a indicator to help identify break of structure points
MT5 version here : https://www.mql5.com/en/market/product/84734?source=Site+Profile+Seller
Other Indicators : https://www.mql5.

TripleStar Trend Indicator, Breakthrough Solution For Trend Trading And Filtering With All Important trend Tool Features Built Inside One Tool! This is a custom MT4 ( Metatrader 4 ) indicator that analyzes the trend and volatility analyzer indicator. In addition, It identifies the beginning and the end of the trend that works for most currency pairs and timeframes. The Trend Monitor indicator is using an optimized formula based on momentum to calculate the trend volatiltiy.
Our indicator
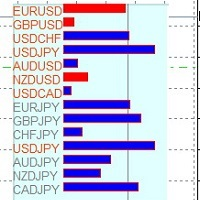
This is an indicator that calculates the correlation between the most important cross with the coefficient of Bravais-Pearson. You can choose the timeframe and the evaluation period. It is a useful tool to anticipate the movements of currencies related. If a currency cross has already anticipated the movement, it can be expected that the correlated currency pairs could also follow the opposite (inverse correlation) or equal (direct correlation) movement. This indicator run with USD, EUR, JPY, CA
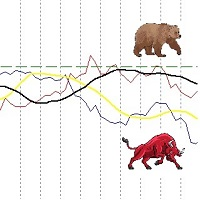
Indicator that measures the strength of major currencies against other currencies. When the strength of one currency exceeds that of the other it is time to open a position in BUY or SELL. It is possible to enable the notifications from the parameters and to insert or not the signals in the graph directly. Very reliable indicator that is based on the whole market of the main currencies and not just on the single currency cross.
"BUYUK SAVDOGAR" TM has developed this strategy to support all who trade binary options. If you trade binary options, try this trading system. Most users report good results. The trading system is based on the best algorithm. The trading system helps to determine the market situation by volume. Loss of interest in one direction or another to the current price affects the further price movement. It is impossible to detect this information with the human eye. The numbers below the candle help us d
Le MetaTrader Market est un magasin unique de robots de trading et d'indicateurs techniques.
Lisez le mémo de l'utilisateur de MQL5.community pour en savoir plus sur les services uniques que nous offrons aux traders : copie des signaux de trading, applications personnalisées développées par des freelancers, paiements automatiques via le système de paiement et le MQL5 Cloud Network.
Vous manquez des opportunités de trading :
- Applications de trading gratuites
- Plus de 8 000 signaux à copier
- Actualités économiques pour explorer les marchés financiers
Inscription
Se connecter
Si vous n'avez pas de compte, veuillez vous inscrire
Autorisez l'utilisation de cookies pour vous connecter au site Web MQL5.com.
Veuillez activer les paramètres nécessaires dans votre navigateur, sinon vous ne pourrez pas vous connecter.