• Información general
  • Comentarios
  • Discusión
  • Novedades

UR FrontEndBackEnd

UR FrontEndBackEnd
 

UR FrontEndBackEnd es mi fórmula favorita para encontrar los niveles más precisos de soporte y resistencia. También los he dividido en diferentes categorías (líneas discontinuas, líneas continuas y áreas) para marcar qué tan fuertes son. Todo se almacena en búferes, por lo que es fácil acceder a ellos e implementarlos dentro de otras herramientas.

Adición: es posible que la herramienta deba ajustarse al activo en el que se aplica: los activos difieren en términos de número de dígitos en el precio que afecta a la herramienta. Los parámetros necesarios para eso se proporcionan en la configuración.


Ventajas de usar UR FrontEndBackEnd:

Solo 2 parámetros para configurar qué tan densos y qué tan lejos deben ser los cálculos
Los soportes y las resistencias se almacenan dentro de los búferes, ascendiendo/descendiendo a partir del precio en el que estamos en el activo dado
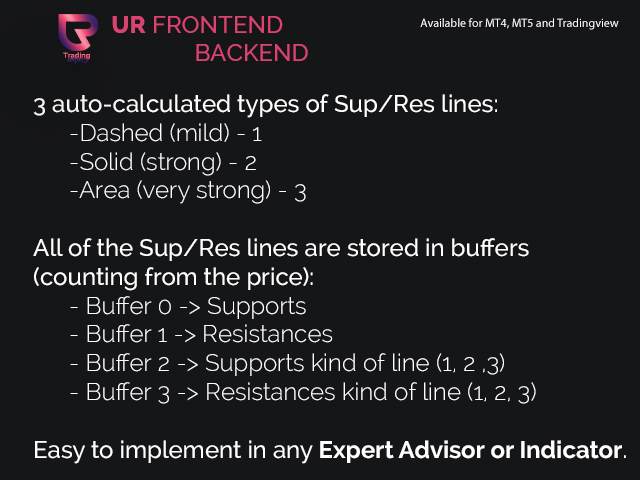
3 tipos de líneas para una rápida retroalimentación visual sobre qué tan fuertes son las líneas de soporte/resistencia -> DASHED, SOLID y AREA
¡Hay un chat especial de Telegram en el que puede mantenerse actualizado con las actualizaciones de herramientas y también enviar una solicitud si siente que falta algo!


¿Por qué UR FrondEndBackEnd?

Es el indicador de soporte/resistencia más fácil de usar y configurar, y también de implementar dentro de otras herramientas, todos los datos son fácilmente legibles y se almacenan dentro de 4 búferes.

¿Cómo usar UR FrondEndBackEnd?

Consulte la descripción a continuación para familiarizarse más con él:
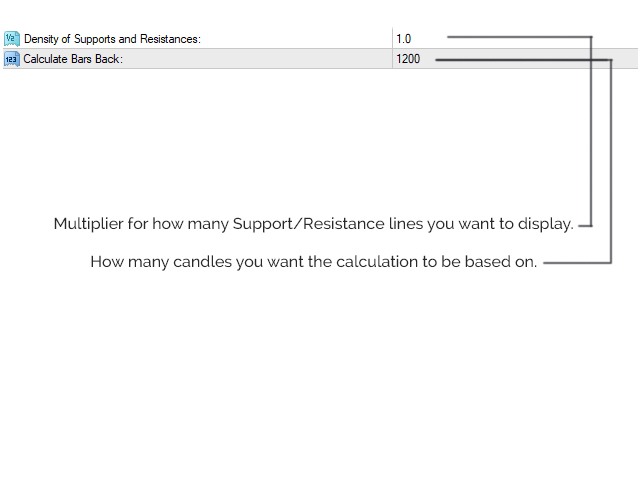

AJUSTES
Densidad: decide sobre cuántas líneas calculará
Barras hacia atrás: qué tan lejos en el gráfico debe ir el indicador y tomar los datos de las velas para hacer los cálculos correspondientes
MOSTRAR

Línea discontinua: soporte/resistencia leve (1)
Línea continua: fuerte soporte/resistencia (2)
Línea de área: soporte/resistencia muy fuerte (3)
Todas las líneas por encima del precio son de color rojo y todas las líneas por debajo del precio son de color azul.


SUMA

Todos los datos se almacenan en 4 búferes:
- Buffer 0 -> Líneas de soporte iniciando el precio a la baja
- Buffer 1 -> Líneas de resistencia iniciando el precio
- Amortiguador 2 - > Fuerza de la línea de soporte (1, 2, 3)
- Buffer 3 -> Fuerza de la línea de resistencia (1, 2, 3)
Productos recomendados
This   Rattling Signal Point   indicator is designed for signal trading. This indicator generates trend signals. It uses many algorithms and indicators to generate this signal. It tries to generate signals from the points with the highest trend potential. This indicator is a complete trading product. This indicator does not need any additional indicators. The indicator is never repainted. The point at which the signal is given does not change. When the signal comes the arrows are put back
Real Magic Trend
Muhammed Emin Ugur
This   Real Magic Trend   indicator is designed for signal trading. This indicator generates trend signals. It uses many algorithms and indicators to generate this signal. It tries to generate signals from the points with the highest trend potential. This indicator is a complete trading product. This indicator does not need any additional indicators. The indicator is never repainted. The point at which the signal is given does not change.      Features and Recommendations Time Frame
The indicator shows you buy/sell signals and does not repaint. It works well with almost all pairs, while the best ones are GBPUSD, XAUUSD and EURUSD. The product works better on H1 and H4. You can change the parameters in the inputs tab to get the best signals and the best trade results on each pair. You can enable/disable alerts when signal appears. The indicator is easy to use. Parameters barstrip & Sensitive: amount of bars to process the highest and lowest prices (relates to the internal
The   True Magic Oscillator   indicator is designed for signal trading. This indicator generates trend signals. It uses many algorithms and indicators to generate this signal. It tries to generate signals from the points with the highest trend potential. This indicator is a complete trading product. This indicator does not need any additional indicators. The indicator is never repainted. The point at which the signal is given does not change.         Features and Recommendations Wor
Signal Tower   indicator is designed for signal trading. This indicator generates trend signals. It uses many algorithms and indicators to generate this signal. It tries to generate a signal from the points with the highest trend potential. This indicator is a complete trading product. This indicator does not need any additional indicators. The indicator certainly does not repaint. The point at which the signal is given does not change. The indicator has a pips counter. You can see how
Real Pro Signal
Muhammed Emin Ugur
Real Pro Signal   indicator is designed for signal trading. This indicator generates trend signals. It uses many algorithms and indicators to generate this signal. It tries to generate a signal from the points with the highest trend potential. This indicator is a complete trading product. This indicator does not need any additional indicators. The indicator certainly does not repaint. The point at which the signal is given does not change.     Features and Suggestions Time Frame: H1 W
VR Cub
Vladimir Pastushak
VR Cub es un indicador para obtener puntos de entrada de alta calidad. El indicador fue desarrollado para facilitar los cálculos matemáticos y simplificar la búsqueda de puntos de entrada a una posición. La estrategia comercial para la cual se diseñó el indicador ha demostrado su eficacia durante muchos años. La simplicidad de la estrategia comercial es su gran ventaja, que permite que incluso los operadores novatos negocien con éxito con ella. VR Cub calcula los puntos de apertura de posiciones
Owl smart levels
Sergey Ermolov
4.63 (54)
Versión MT5  |   FAQ El   Indicador Owl Smart Levels   es un sistema comercial completo dentro de un indicador que incluye herramientas de análisis de mercado tan populares como   los fractales avanzados de Bill Williams , Valable ZigZag que construye   la estructura de onda correcta   del mercado y   los niveles de Fibonacci   que marcan los niveles exactos de entrada. en el mercado y lugares para tomar ganancias. Descripción detallada de la estrategia Instrucciones para trabajar con el indi
Happy Trend Arrow
Muhammed Emin Ugur
This   Happy Trend Arrow   indicator is designed for signal trading. This indicator generates trend signals. It uses many algorithms and indicators to generate this signal. It tries to generate signals from the points with the highest trend potential. This indicator is a complete trading product. This indicator does not need any additional indicators. The indicator is never repainted. The point at which the signal is given does not change.       Features and Recommendations Time Fra
BinaryFiesta
Andrey Spiridonov
The BinaryFiesta indicator has been developed and adapted specifically for trading short-term binary options. The algorithm of the indicator analyzes numerous factors before generating a signal. The indicator is installed in the conventional way. The indicator consists of an information window, which displays the name of the trading instrument, support and resistance levels, and the signal itself ( BUY , SELL or WAIT ). A signal is accompanied by a sound and a pop-up Alert. Advantages of the i
The Th3Eng PipFinite indicator is based on a very excellent analysis of the right trend direction with perfect custom algorithms. It show the true direction and the best point to start trading. With StopLoss point and Three Take Profit points. Also it show the right pivot of the price and small points to order to replace the dynamic support and resistance channel, Which surrounds the price. And Finally it draws a very helpful Box on the left side on the chart includes (take profits and Stop loss
This indicator monitors the market for a flat state and possible breakout. The flat state is detected as a predefined number of consecutive bars during which price fluctuates inside a small range. If one of the next bars closes outside the range, breakout is signaled. The indicator shows 3 lines: blue - upper bound of flat ranges AND consecutive breakout areas; red - lower bound of flat ranges AND consecutive breakout areas; yellow - center of flat ranges (NOT including breakout areas). When a b
Nice Stable Arrow
Muhammed Emin Ugur
Nice Stable Arrow   indicator is designed for signal trading. This indicator generates trend signals. It uses many algorithms and indicators to generate this signal. It tries to generate a signal from the points with the highest trend potential. This indicator is a complete trading product. This indicator does not need any additional indicators. The indicator certainly does not repaint. The point at which the signal is given does not change. Signals are sent at the beginning of new candle
Credible Cross System   indicator is designed for signal trading. This indicator generates trend signals. It uses many algorithms and indicators to generate this signal. It tries to generate a signal from the points with the highest trend potential. The indicator works based on instant price movements. This indicator is a complete trading product. This indicator does not need any additional indicators. The indicator certainly does not repaint. The point at which the signal is given does not
The main idea of this indicator is rates analysis and prediction by Fourier transform. Indicator decomposes exchange rates into main harmonics and calculates their product in future. You may use the indicator as a standalone product, but for better prediction accuracy there is another related indicator - FreqoMaster - which uses FreqoMeterForecast as a backend engine and combines several instances of FreqoMeterForecast for different frequency bands. Parameters: iPeriod - number of bars in the ma
Chart Patterns Detect 15 patterns (Ascending Triangle, Descending Triangle, Rising Wedge, Falling Wedge, Bullish Flag, Bearish Flag, Bullish Rectangle, Bearish Rectangle Symmetrical triangle, Head and Shoulders, Inverted Head and Shoulders, Triple top, Triple Bottom, Double Top, Double Bottom) Use historical data to calculate the probability of each pattern to succeed (possibility to filter notification according to the chance of success) gives graphic indication about the invalidation level and
This indicator is customized for binary option trading like M1 timeframe or turbo option trading. The way a binary option works is from the traders perspective is that you choose whether or not a certain underlying asset (a stock, commodity, currency etc.) is going to go up or down in a certain amount of time. You essentially bet money on this prediction. You are shown how much money up front you will earn if your prediction is correct. If your prediction is wrong, you lose your bet and the mone
Trend PA
Mikhail Nazarenko
5 (3)
The Trend PA indicator uses   Price Action   and its own filtering algorithm to determine the trend. This approach helps to accurately determine entry points and the current trend on any timeframe. The indicator uses its own algorithm for analyzing price changes and Price Action. Which gives you the advantage of recognizing, without delay, a new nascent trend with fewer false positives. Trend filtering conditions can be selected in the settings individually for your trading style. The indicator
Master Scalping M1 es un indicador innovador que utiliza un algoritmo para determinar la tendencia de forma rápida y precisa. El indicador calcula el tiempo de apertura y cierre de posiciones, los algoritmos del indicador le permiten encontrar los momentos ideales para ingresar a una operación (comprar o vender un activo), lo que aumenta el éxito de las transacciones para la mayoría de los comerciantes. Beneficios del indicador: Fácil de usar, no sobrecarga el gráfico con información innecesari
Pro Magic Signal   indicator is designed for signal trading. This indicator generates trend signals.  It uses many algorithms and indicators to generate this signal. It tries to generate a signal from the points with the highest trend potential. This indicator is a complete trading product. This indicator does not need any additional indicators.  The indicator certainly does not repaint. The point at which the signal is given does not change.  Thanks to the alert features you can get the signals
Trend Monitor
Pavel Zamoshnikov
4.2 (5)
The indicator generates early signals basing on ADX reading data combined with elements of price patterns. Works on all symbols and timeframes. The indicator does not redraw its signals. You see the same things on history and in real time. For better visual perception signals are displayed as arrows (in order not to overload the chart). Features Easy to use. Filter configuration only requires selection of sensitivity in the " Sensitivity of the indicator " input. Signals can be filtered usin
ZhiBiCCI MT4
Qiuyang Zheng
5 (1)
Los indicadores [ZhiBiCCI] son ​​adecuados para todos los ciclos de uso y también son adecuados para todas las variedades de mercado. [ZhiBiCCI] La línea verde sólida es una reversión de la divergencia alcista. La línea de puntos verde es una divergencia alcista clásica. [ZhiBiCCI] La línea continua hacia el rojo es una divergencia bajista inversa. La línea roja punteada es una divergencia bajista clásica. [ZhiBiCCI] puede configurarse en los parámetros (Alerta, Enviar correo, Enviar notif
Aspara111
Gesang Pangestu
This indicator allows you to trade binary options and specially programmed to get the momentum to follow the trend that is happening in the live market. This indicator is based on trend strength, price correction and advanced technical analysis,this is 100% NO REPAINT. This indicators specifically for manual trading, I suggest using a platform that uses an expiration time    Timeframe : M1 or M5 Expired Time : 1 Candle Pair   : Any ( even better in the CAD market ) Time Session : Europe and NewY
WanaScalper MT4
Isaac Wanasolo
1 (1)
A scalping indicator based on mathematical patterns, which on average gives signals with relatively small SL, and also occasionally helps to catch big moves in the markets (more information in the video) This indicator has three main types of notifications: The first type warns of a possible/upcoming signal on the next bar The second type indicates the presence of a ready signal to enter the market/open a position The third type is for SL and TP levels - you will be notified every time price r
The indicator detects and displays 3 Drives harmonic pattern (see the screenshot). The pattern is plotted by the extreme values of the ZigZag indicator (included in the resources, no need to install). After detecting the pattern, the indicator notifies of that by a pop-up window, a mobile notification and an email. The indicator highlights the process of the pattern formation and not just the complete pattern. In the former case, it is displayed in the contour triangles. After the pattern is com
Future Candle One Candle is an arrow indicator of candlestick patterns, based on the calculation of historical statistics. It identifies and calculates patterns consisting of one candle. Advantages of the indicator Gives information about the next candle right now; The indicator values are based on statistical data on the history of the current instrument; Forecasts and displays the result of trading based on its signals; The colors of the indicator have been selected for a comfortable operati
Retroceso de Fibonacci & Herramientas de Dibujo de Líneas Extendidas Retroceso de Fibonacci & Herramientas de Dibujo de Líneas Extendidas son aptos para la plataforma MT4 y para operadores que emplean el método de negociación de puntos y la negociación de sección áurea. Ventajas: Sin líneas excusadas ni las excesivamente largas, y es fácil de observar y descubrir oportunidades de negociación. Versión de prueba: https://www.mql5.com/zh/market/product/35884 Funciones principales: 1.
TrendCompass is a powerful indicator for trading in the currency and cryptocurrency markets on the MetaTrader 4 platform. This innovative tool is designed to simplify analysis and decision-making in trading. The indicator combines various technical indicators and algorithms to provide accurate and timely trading signals. Key Features: Multilevel Strategy: TrendCompass is based on a comprehensive strategy that includes analyzing major trends, support and resistance levels, and various technical
The indicator is designed for binary options. It produces a sound alert, after which you should instantly enter the market. The indicator operates based on signals form RSI and CCI, as well as support and resistance levels. When the chart is in overbought and oversold zones, the indicator finds a level in this zone and notifies you using a sound and a message. Indicator Parameters dist - the number of points to generate a signal. Suitable values ​​are from 21 to 50. Filtr_SMA - the filter, use
The new update makes this indicator a complete tool for studying, analyzing and operating probabilistic patterns. It includes: On-chart Multi-asset percentage monitor. Configurable martingales. Twenty-one pre-configured patterns , including Mhi patterns and C3. An advanced pattern editor to store up to 5 custom patterns. Backtest mode to test results with loss reports. Trend filter. Hit operational filter. Martingale Cycles option. Various types of strategies and alerts. Confluence between patte
Los compradores de este producto también adquieren
ACTUALMENTE 26% DE DESCUENTO ¡La mejor solución para cualquier operador novato o experto! Este indicador es una herramienta única, de alta calidad y asequible porque hemos incorporado una serie de características propias y una nueva fórmula. ¡Con sólo UN gráfico puede leer la Fuerza de la Divisa para 28 pares de Divisas! Imagínese cómo mejorará su operativa porque podrá señalar el punto exacto de activación de una nueva tendencia o de una oportunidad de scalping. Manual del usuario: haga
TPSpro RFI Levels
Roman Podpora
4.87 (15)
Reversal First Impulse levels (RFI)    INSTRUCTIONS        RUS       -       ENG              R ecommended to use with an indicator   -   TREND PRO -  Version MT5 A key element in trading is zones or levels from which decisions to buy or sell a trading instrument are made. Despite attempts by major players to conceal their presence in the market, they inevitably leave traces. Our task was to learn how to identify these traces and interpret them correctly. Main functions: Displaying active zones
Atomic Analyst
Issam Kassas
5 (3)
En primer lugar, vale la pena enfatizar que este Indicador de Trading no repinta, no redibuja y no se retrasa, lo que lo hace ideal tanto para el trading manual como para el automatizado. Manual del usuario: configuraciones, entradas y estrategia. El Analista Atómico es un Indicador de Acción del Precio PA que utiliza la fuerza y el impulso del precio para encontrar una mejor ventaja en el mercado. Equipado con filtros avanzados que ayudan a eliminar ruidos y señales falsas, y aumentan el poten
Scalper Inside PRO
Alexey Minkov
4.75 (57)
An exclusive indicator that utilizes an innovative algorithm to swiftly and accurately determine the market trend. The indicator automatically calculates opening, closing, and profit levels, providing detailed trading statistics. With these features, you can choose the most appropriate trading instrument for the current market conditions. Additionally, you can easily integrate your own arrow indicators into Scalper Inside Pro to quickly evaluate their statistics and profitability. Scalper Inside
Advanced Supply Demand
Bernhard Schweigert
4.92 (311)
¡Actualmente con 33% de descuento! ¡La mejor solución para cualquier tráder principiante o experto! Este indicador es una herramienta comercial única, de alta calidad y asequible, porque incorpora una serie de características patentadas y una nueva fórmula. Con esta actualización, podrá mostrar zonas de doble marco temporal. No solo podrá mostrar un marco temporal más alto, sino también mostrar ambos, el marco temporal del gráfico MÁS el marco temporal más alto: MOSTRANDO ZONAS ANIDADAS. A todos
TPSproTREND PrO
Roman Podpora
4.78 (18)
TPSpro TRENDPRO  - is a trend indicator that automatically analyzes the market and provides information about the trend and each of its changes, as well as giving signals for entering trades without redrawing! The indicator uses each candle, analyzing them separately. referring to different impulses - up or down impulse. Exact entry points into transactions for currencies, crypto, metals, stocks, indices!  -  Version MT5               DETAILED DESCRIPTION                R ecommended to use with
¡Descubra el secreto para el comercio de Forex exitoso con nuestro indicador MT4 personalizado! ¿Alguna vez se ha preguntado cómo lograr el éxito en el mercado de Forex, obteniendo ganancias constantemente al tiempo que minimiza el riesgo? ¡Aquí está la respuesta que ha estado buscando! Permítanos presentar nuestro indicador MT4 patentado que revolucionará su enfoque para el comercio. Versatilidad única Nuestro indicador está especialmente diseñado para usuarios que prefieren las formacio
Trend Punch
Mohamed Hassan
5 (4)
Manual guide:   Click here Starting price of  $88  for the first 25 copies only ( 4  left)! -- Next price is  $176 .  This indicator is unstoppable when combined with our other indicator called  Support & Resistance . After purchase, send us a message and you could get  it  for  FREE as a BONUS!  Introducing Trend Punch , the revolutionary forex trend indicator that will transform the way you trade! Trend Punch is uniquely designed to provide precise buy and sell arrows during strong
TrendMaestro
Stefano Frisetti
5 (2)
note: this indicator is for METATRADER4, if you want the version for METATRADER5 this is the link:  https://www.mql5.com/it/market/product/108106 TRENDMAESTRO ver 2.4 TRENDMAESTRO recognizes a new TREND in the bud, he never makes mistakes. The certainty of identifying a new TREND is priceless. DESCRIPTION TRENDMAESTRO identifies a new TREND in the bud, this indicator examines the volatility, volumes and momentum to identify the moment in which there is an explosion of one or more of these data a
Por supuesto, aquí tienes la traducción al español: Presentamos el Indicador de Astronomía para MT4: Tu Compañero Celestial Definitivo en el Trading ¿Estás listo para elevar tu experiencia de trading a alturas celestiales? No busques más allá de nuestro revolucionario Indicador de Astronomía para MT4. Esta innovadora herramienta trasciende los indicadores de trading tradicionales, aprovechando el poder de algoritmos complejos para proporcionarte una visión astronómica sin igual y cálculos de pre
¡Actualmente 20% OFF ! ¡La mejor solución para cualquier novato o trader experto! Este software funciona con 28 pares de divisas. Se basa en 2 de nuestros principales indicadores (Advanced Currency Strength 28 y Advanced Currency Impulse). Proporciona una gran visión general de todo el mercado de divisas. Muestra los valores de Advanced Currency Strength, la velocidad de movimiento de las divisas y las señales para 28 pares de divisas en todos los (9) marcos temporales. Imagine cómo mejorar
FX Volume
Daniel Stein
4.6 (35)
Obtenga su actualización diaria del mercado con detalles y capturas de pantalla a través de nuestro Morning Briefing aquí en mql5 y en Telegram ! FX Volume es el PRIMER y ÚNICO indicador de volumen que proporciona una visión REAL del sentimiento del mercado desde el punto de vista de un bróker. Proporciona una visión impresionante de cómo los participantes institucionales del mercado, como los brokers, están posicionados en el mercado Forex, mucho más rápido que los informes COT. Ver esta info
The indicator of a Professional Trader is an arrow indicator for predicting the direction of price movement. I have been working on this indicator since 2014. You can use this indicator as your main indicator, use its entry signals, and use it as your only indicator to find entry points. About the product: Recommended TF [H4-D1-W1]   . The indicator predicts the direction of the next candle. Fits a variety of tools; Flexibility in settings for different instruments and intervals through the
ACTUALMENTE 31% DE DESCUENTO Este indicador es una herramienta de transacción única, de alta calidad y asequible porque hemos incorporado una serie de características propias y una fórmula secreta. Con solo un gráfico, da Alertas para los 28 pares de divisas. ¡Imagina cómo mejorarás porque puedes identificar el punto de activación exacto de una nueva tendencia u oportunidad de crecimiento! Basado en nuevos algoritmos subyacentes , hace que sea aún más fácil identificar y confirmar operaciones po
Dragon Multi Indicator MT4
Mansour Babasafary
5 (4)
74% discount for the next 10 buyers (original price $605): 1 left Get a 50% bonus by buying (or even renting) any of our products. After buying (or renting), send a message for more information. 3 Indicators in 1 indicator Strategy based on price action Made specifically for the best forex currency pairs Can be used in the best time frame of the market at a very reasonable price This indicator is basically 3 different indicatos . But we have combined these 3 indicators in 1 indicator so th
Introduciendo       Indicador Quantum Trend Sniper   , el innovador indicador MQL5 que está transformando la forma en que identificas y negocias los cambios de tendencia. Desarrollado por un equipo de comerciantes experimentados con experiencia comercial de más de 13 años,       Indicador de francotirador de tendencia cuántica       está diseñado para impulsar su viaje comercial a nuevas alturas con su forma innovadora de identificar cambios de tendencia con una precisión extremadamente alta.
FX Power MT4 NG
Daniel Stein
5 (10)
Obtenga su actualización diaria del mercado con detalles y capturas de pantalla a través de nuestro Morning Briefing aquí en mql5 y en Telegram ! FX Power MT4 NG es la nueva generación de nuestro popular medidor de fuerza de divisas, FX Power. ¿Y qué ofrece este medidor de fuerza de nueva generación? Todo lo que le encantaba del FX Power original PLUS Análisis de fuerza de ORO/XAU Resultados de cálculo aún más precisos Períodos de análisis configurables individualmente Límite de cálculo persona
Shepherd Harmonic Pattern
Abdullah Alrai
4.68 (59)
Este indicador detectará patrones armónicos que se dibujen en el gráfico mediante métodos manuales y automáticos. Puede consultar el manual del usuario en el siguiente enlace: Agregue su opinión y contáctenos para obtenerlo Existe una versión gratuita para probar este producto en mt4. Puede utilizarlo para detectar patrones de Gartley y Nenstar: https://www.mql5.com/en/market/product/30181 Puede comprar la versión completa de MT4 en: https://www.mql5.com/en/market/product/15212 Notas El indicad
TakePropips Donchian Trend Pro
Eric John Pajarillaga Aldana
4.82 (17)
¡TakePropips Donchian Trend Pro   (MT4) es una herramienta poderosa y efectiva que detecta automáticamente la dirección de la tendencia utilizando el Canal Donchian y le proporciona señales comerciales de entrada y salida! Este indicador multifunción incluye un escáner de tendencias, señales comerciales, panel estadístico, filtro, sesiones comerciales y panel de historial de alertas. ¡Está diseñado para proporcionarle señales comerciales y ahorrarle horas analizando los gráficos! Puede descargar
Quantum Breakout Indicator PRO
Bogdan Ion Puscasu
4.96 (26)
Introduciendo       Quantum Breakout PRO   , el innovador indicador MQL5 que está transformando la forma en que comercia con Breakout Zones. Desarrollado por un equipo de operadores experimentados con experiencia comercial de más de 13 años,   Quantum Breakout PRO   está diseñado para impulsar su viaje comercial a nuevas alturas con su innovadora y dinámica estrategia de zona de ruptura. El indicador de ruptura cuántica le dará flechas de señal en las zonas de ruptura con 5 zonas objetivo de
Sacrament
owais_saadeh
4.91 (11)
Sacrament mt4- This is an indicator that includes the best basic forex indicators, without redrawing. Based on this data, a signal for sale or purchase is formed. It does not disappear anywhere after the signal, which gives us the opportunity to see the results on the history. It can be used on any currency pair, crypto metals, stocks It is best used on an hourly chart, but other periods are also acceptable. The best results for the period H1,H4,daily If customers have any questions, I w
Wolfe Wave Scanner
Jalitha K Johny
5 (2)
Wolfe Waves scanner - It scans all the Symbols and identify the movement of price and it gives confidence in trade. It automatically plots  fifth wave breaks out of the channel. According to the theory behind the pattern, a line drawn from the point at the beginning of the first wave and passing through the beginning of the fourth wave predicts a target price for the end of the fifth wave. If a trader properly identifies a Wolfe Wave as it forms, the beginning of the fifth wave represents an op
Cycle Sniper
Elmira Memish
4.39 (36)
NEW YEAR SALE PRICE FOR LIMITED TIME!!! Please contact us after your purchase and we will send you the complimentary indicators to complete the system Cycle Sniper is not a holy grail but when you use it in a system which is explained in the videos, you will feel the difference. If you are not willing to focus on the charts designed with Cycle Sniper and other free tools we provide, we recommend not buying this indicator. We recommend watching the videos about the indiactor and system before pu
There is No use in the Testing Demo. You will understand nothing from running flashing numbers. It is a Dashboard. Just try to understand idea, get it and I will help in everything further. Symbols must be separated by commas (,) and entered into the parameters exactly as displayed by your broker to ensure they are recognized in the dashboard. These symbols will be used for analysis by the indicator. With one click open any pair any timeframe directly from dashboard The MA Speedometer Dashboar
XQ Indicator MetaTrader 4
Marzena Maria Szmit
3 (2)
Step into the realm of Forex trading with confidence and precision using XQ, a cutting-edge Forex indicator designed to elevate your trading game to unprecedented heights. Whether you're a seasoned trader or just stepping into the world of currency exchange,   XQ Forex Indicator   empowers you with the insights and signals needed to make informed trading decisions. The signal conditions are a combination of three indicators, and XQ Forex Indicator only display  medium and long-term trends . The
El sistema PRO Renko es un sistema de trading de alta precisión especialmente diseñado para operar gráficos RENKO. Se trata de un sistema universal que se puede aplicar a diversos instrumentos de negociación. El sistema neutraliza eficazmente el llamado ruido de mercado, lo que le brinda acceso a señales de reversión precisas. El indicador es muy fácil de usar y solo tiene un parámetro responsable de la generación de señales. Puede adaptar fácilmente la herramienta a cualquier instrumento com
Introduction to Fractal Pattern Scanner Fractal Indicator refers to the technical indicator that makes use of the fractal geometry found in the financial market. Fractal Pattern Scanner is the advanced Fractal Indicator that brings the latest trading technology after the extensive research and development work in the fractal geometry in the financial market. The most important feature in Fractal Pattern Scanner is the ability to measure the turning point probability as well as the trend probabi
CyberZingFx Trend Reversal
Afsal Meerankutty
4.26 (19)
Indicator captures the trend reversals with no-repaint Buy and Sell Arrow signals. CyberZingFx Trend Reversal Indicator - your go-to solution for accurate and reliable trend reversal signals. With its  advanced trading strategy , the indicator offers you Buy and Sell Arrow signals that do not repaint, making it a reliable tool for catching Swing Highs and Swing Lows in any market and any time frame. Indicator works on  any market  and  any time frames . __________________________________________
Presentamos ON Trade Waves Patterns Harmonic Elliot Wolfe, un indicador avanzado diseñado para detectar diversas formas de patrones en el mercado mediante métodos tanto manuales como automáticos. A continuación, te explicamos cómo funciona: Patrones Armónicos: Este indicador puede identificar patrones armónicos que aparecen en tu gráfico. Estos patrones son esenciales para los traders que practican la teoría del trading armónico, tal como se popularizó en el libro de Scott Carney "Harmonic Tradi
El Detector de Terremotos del Mercado  Sismógrafo. Description in English : https://www.mql5.com/en/market/product/113869?source=Site+Market+Product+Page#description How to use the Seismograph : https://www.mql5.com/en/market/product/113869#!tab=comments&page=2&comment=52806941 Create an EA : https://www.mql5.com/en/market/product/113869#!tab=comments&page=3&comment=52816509 Cualquiera que sea la forma en que opere, definitivamente desea evitar la entrada en el mercado de baja liqui
Otros productos de este autor
UR Basket MT5
Krzysztof Jan Debski
你的籃子   您能做的最好的事情就是保護您的訂單免於虧損。 您現在可以放心,讓 UR Basket 來處理它。 使用 UR 籃子的優勢: 所有參數都可以在圖表的圖形面板中動態更改 - 您無需重新啟動 EA 即可更改參數或調用您使用的設置! 您可以通過以下方式跟踪您的訂單:   - 幻數   - EA評論   - 以上兩者   -一次完成所有交易 UR Basket 可以通過您的貨幣價值、PIPS 或您的餘額或淨值的百分比來跟踪您的利潤。 圖形面板始終顯示您在這三種方法中的利潤,並刷新您告訴他的頻率。 最大優勢:鎖定利潤,不虧本! 下面詳細介紹它。 有一個特殊的電報聊天,您可以在其中了解最新的工具更新,如果您覺得缺少什麼,也可以發送請求! 為什麼選擇 UR 籃子? 有很多 EA 可以自行交易,或者需要您盡可能多地關注獲利的優秀手動策略,但這些都不是防彈的突然變化或經常發生的“鯨魚攻擊”。 因此,這個籃子讓您可以跟踪所有交易,鎖定您的利潤,這樣您就不會失去您已經建立的東西,並儘快關閉交易並確保您不會陷入負值。 圖表上的設置也由用戶動態更改,因此您無需在每次要更改值
UR TradeManager MT5
Krzysztof Jan Debski
UR_TradeManager para MetaTrader 5 Maximice su potencial de trading con UR_TradeManager, la herramienta definitiva de mejora de trading diseñada específicamente para la plataforma MetaTrader 4. Creada con precisión y funcionalidad en mente, esta herramienta integral es esencial para los traders que buscan elevar sus habilidades de análisis de mercado, ejecución y gestión. Características Clave: Panel de Trading Visual : Gestione sus operaciones directamente desde un panel sofisticado que se integ
UR Control Panel
Krzysztof Jan Debski
5 (2)
Panel de control UR   UR Control Panel es una herramienta que quiero compartir contigo GRATIS. Es un panel interactivo que me ayudó en mis operaciones y mejoró mi exploración del mercado todos los días. ¡Espero que se adapte a tus necesidades también! ¿Cómo usar el panel de control UR? Es un panel doble móvil y redimensionable del cual: - Uno de ellos muestra la fortaleza de la moneda en el marco de tiempo dado - El otro permite opciones para moverse entre símbolos y marcos de tiempo much
FREE
UR Basket
Krzysztof Jan Debski
你的籃子   您能做的最好的事情就是保護您的訂單免於虧損。 您現在可以放心,讓 UR Basket 來處理它。 使用 UR 籃子的優勢: 所有參數都可以在圖表的圖形面板中動態更改 - 您無需重新啟動 EA 即可更改參數或調用您使用的設置! 您可以通過以下方式跟踪您的訂單:   - 幻數   - EA評論   - 以上兩者   -一次完成所有交易 UR Basket 可以通過您的貨幣價值、PIPS 或您的餘額或淨值的百分比來跟踪您的利潤。 圖形面板始終顯示您在這三種方法中的利潤,並刷新您告訴他的頻率。 最大優勢:鎖定利潤,不虧本! 下面詳細介紹它。 有一個特殊的電報聊天,您可以在其中了解最新的工具更新,如果您覺得缺少什麼,也可以發送請求! 為什麼選擇 UR 籃子? 有很多 EA 可以自行交易,或者需要您盡可能多地關注獲利的優秀手動策略,但這些都不是防彈的突然變化或經常發生的“鯨魚攻擊”。 因此,這個籃子讓您可以跟踪所有交易,鎖定您的利潤,這樣您就不會失去您已經建立的東西,並儘快關閉交易並確保您不會陷入負值。 圖表上的設置也由用戶動態更改,因此您無需在每次要更改值
UR DivergenceSpotter
Krzysztof Jan Debski
Observador de divergencia UR   UR DivergenceSpotter es el resultado de muchos años de experiencia y, a veces, las formas más fáciles son las mejores. Hay una buena correlación entre algunos indicadores, pero cuando no coinciden, el precio intenta "reajustarse", y es en ese momento cuando recibimos una señal con UR DivergenceSpotter. Ventajas de usar UR Divergence Spotter: Sin parámetros No se vuelve a pintar después de crear la vela. Señales cuando la señal ya no es válida (lo que signifi
UR VolumeTrend
Krzysztof Jan Debski
Tendencia de volumen UR   UR VolumeTrend es el indicador de volumen más claro que muestra la tendencia actual en términos de volumen. Funciona perfectamente con otros indicadores, como UR TrendExhaustion, para señalar máximos y mínimos locales. Limitado a solo 2 parámetros: cuanto más altos sean los valores, más largas serán las tendencias que mostrará. Los extremos de gradiente muestran posibles agotamientos de volumen para captar una posible reversión. Dos líneas: la tendencia del volumen
UR TrendExhaustion
Krzysztof Jan Debski
Tendencia URAgotamiento   UR TrendExhaustion es la mejor solución para los comerciantes que no quieren lidiar con valores de parámetros ni otras configuraciones: es fácil y visualmente comprensible para todos. Ventajas de usar UR TrendExhaustion: Sin parámetros Tiene 3 líneas que describen mejor lo que está pasando en el gráfico: Línea de agotamiento de tendencia, Línea de dinero de ballena y Línea de dinero minorista. La interfaz muestra el agotamiento de cualquiera de las líneas en ambo
UR HighsAndLows
Krzysztof Jan Debski
Máximos y mínimos de UR   UR Highs&Lows realiza un análisis en profundidad del movimiento de precios y su volatilidad, y crea un canal dentro del cual se mueve el precio. Ese canal se mueve ahora como un oscilador y se superpone con la desviación del precio para señalar posibles agotamientos y posibles reversiones. Ventajas de usar UR Highs&Lows: Sin parámetros Tiene 3 líneas que describen el movimiento del precio: la línea blanca, que es un promedio del precio, y las líneas azules, que s
UR Momenter
Krzysztof Jan Debski
Momentador UR   UR Momenter calcula perfectamente el impulso del precio en correlación con el agotamiento del movimiento del precio representado como un oscilador. Por lo tanto, esto nos da señales muy tempranas de posibles reversiones o retrocesos. Esta fórmula se descubrió en 2018 después del estallido de la burbuja del mercado. Ventajas de usar UR Momenter: Sin parámetros Tiene 2 líneas que describen el movimiento del precio: la línea blanca, que es el impulso del precio en correlación
UR Gamma
Krzysztof Jan Debski
Gama UR (impulsado por cálculos similares que se encuentran en los sistemas de aprendizaje automático) UR Gamma es una herramienta de análisis financiero de vanguardia que ofrece una versión nueva y mejorada del indicador clásico WaveTrend. Al incorporar técnicas avanzadas de procesamiento de señales digitales, UR Gamma aborda algunas de las limitaciones de los algoritmos WaveTrend tradicionales y brinda un enfoque más preciso, sólido y dinámico para identificar y medir tendencias en la acció
UR Bands
Krzysztof Jan Debski
Bandas UR (con una fórmula utilizada en sistemas de aprendizaje automático) UR Bands es un indicador derivado a través de una fórmula que incorpora la volatilidad del mercado y es similar en principio a los utilizados en los sistemas de aprendizaje automático. Esta representación matemática de las condiciones del mercado ofrece un análisis preciso de las tendencias y dinámicas de los precios, teniendo en cuenta la volatilidad inherente de los mercados financieros. Al incorporar la volatilidad
UR Vortex
Krzysztof Jan Debski
UR Vortex The Probabilistic UR Vortex Formula: An Accurate System for Predictive Market Analysis using Volatility and Standard Deviation Calculations. The   UR Vortex   indicator is a technical analysis tool that uses volatility and standard deviation calculations to predict potential tops and bottoms in a market. It measures the strength of a trend by calculating the distance between the current price and a moving average, and then standardizing this distance by dividing it by the average true
UR PulseScalp
Krzysztof Jan Debski
UR PulseScalp  Un indicador comercial calibrado para revendedores que buscan la máxima ventaja en mercados acelerados UR PulseScalp es una solución comercial de vanguardia para revendedores que buscan la máxima ventaja en mercados acelerados. Este indicador innovador se basa en una fórmula calibrada científicamente que combina el poder de la volatilidad, el flujo de dinero y la fuerza relativa para crear una señal altamente precisa y confiable. Ventajas de usar UR PulseScalp : Cómodo Pane
UR TradeManager
Krzysztof Jan Debski
UR_TradeManager para MetaTrader 4 Maximice su potencial de trading con UR_TradeManager, la herramienta definitiva de mejora de trading diseñada específicamente para la plataforma MetaTrader 4. Creada con precisión y funcionalidad en mente, esta herramienta integral es esencial para los traders que buscan elevar sus habilidades de análisis de mercado, ejecución y gestión. Características Clave: Panel de Trading Visual : Gestione sus operaciones directamente desde un panel sofisticado que se integ
Observador de divergencia UR   UR DivergenceSpotter es el resultado de muchos años de experiencia y, a veces, las formas más fáciles son las mejores. Hay una buena correlación entre algunos indicadores, pero cuando no coinciden, el precio intenta "reajustarse", y es en ese momento cuando recibimos una señal con UR DivergenceSpotter. Ventajas de usar UR Divergence Spotter: Sin parámetros No se vuelve a pintar después de crear la vela. Señales cuando la señal ya no es válida (lo que signifi
UR VolumeTrend MT5
Krzysztof Jan Debski
Tendencia de volumen UR   UR VolumeTrend es el indicador de volumen más claro que muestra la tendencia actual en términos de volumen. Funciona perfectamente con otros indicadores, como UR TrendExhaustion, para señalar máximos y mínimos locales. Limitado a solo 2 parámetros: cuanto más altos sean los valores, más largas serán las tendencias que mostrará. Los extremos de gradiente muestran posibles agotamientos de volumen para captar una posible reversión. Dos líneas: la tendencia del volumen
Tendencia URAgotamiento   UR TrendExhaustion es la mejor solución para los comerciantes que no quieren lidiar con valores de parámetros ni otras configuraciones: es fácil y visualmente comprensible para todos. Ventajas de usar UR TrendExhaustion: Sin parámetros Tiene 3 líneas que describen mejor lo que está pasando en el gráfico: Línea de agotamiento de tendencia, Línea de dinero de ballena y Línea de dinero minorista. La interfaz muestra el agotamiento de cualquiera de las líneas en ambo
UR HighsAndLows MT5
Krzysztof Jan Debski
Máximos y mínimos de UR   UR Highs&Lows realiza un análisis en profundidad del movimiento de precios y su volatilidad, y crea un canal dentro del cual se mueve el precio. Ese canal se mueve ahora como un oscilador y se superpone con la desviación del precio para señalar posibles agotamientos y posibles reversiones. Ventajas de usar UR Highs&Lows: Sin parámetros Tiene 3 líneas que describen el movimiento del precio: la línea blanca, que es un promedio del precio, y las líneas azules, que s
UR Momenter MT5
Krzysztof Jan Debski
Momentador UR   UR Momenter calcula perfectamente el impulso del precio en correlación con el agotamiento del movimiento del precio representado como un oscilador. Por lo tanto, esto nos da señales muy tempranas de posibles reversiones o retrocesos. Esta fórmula se descubrió en 2018 después del estallido de la burbuja del mercado. Ventajas de usar UR Momenter: Sin parámetros Tiene 2 líneas que describen el movimiento del precio: la línea blanca, que es el impulso del precio en correlación
UR FrontEndBackEnd   UR FrontEndBackEnd es mi fórmula favorita para encontrar los niveles más precisos de soporte y resistencia. También los he dividido en diferentes categorías (líneas discontinuas, líneas continuas y áreas) para marcar qué tan fuertes son. Todo se almacena en búferes, por lo que es fácil acceder a ellos e implementarlos dentro de otras herramientas. Adición: es posible que la herramienta deba ajustarse al activo en el que se aplica: los activos difieren en términos de núm
UR Gamma MT5
Krzysztof Jan Debski
Gama UR (impulsado por cálculos similares que se encuentran en los sistemas de aprendizaje automático) UR Gamma es una herramienta de análisis financiero de vanguardia que ofrece una versión nueva y mejorada del indicador clásico WaveTrend. Al incorporar técnicas avanzadas de procesamiento de señales digitales, UR Gamma aborda algunas de las limitaciones de los algoritmos WaveTrend tradicionales y brinda un enfoque más preciso, sólido y dinámico para identificar y medir tendencias en la acció
UR Bands MT5
Krzysztof Jan Debski
Bandas UR (con una fórmula utilizada en sistemas de aprendizaje automático) UR Bands es un indicador derivado a través de una fórmula que incorpora la volatilidad del mercado y es similar en principio a los utilizados en los sistemas de aprendizaje automático. Esta representación matemática de las condiciones del mercado ofrece un análisis preciso de las tendencias y dinámicas de los precios, teniendo en cuenta la volatilidad inherente de los mercados financieros. Al incorporar la volatilidad
UR Vortex MT5
Krzysztof Jan Debski
UR Vortex MT5 The Probabilistic UR Vortex Formula: An Accurate System for Predictive Market Analysis using Volatility and Standard Deviation Calculations. The UR Vortex MT5 indicator is a technical analysis tool that uses volatility and standard deviation calculations to predict potential tops and bottoms in a market. It measures the strength of a trend by calculating the distance between the current price and a moving average, and then standardizing this distance by dividing it by the average
UR PulseScalp MT5
Krzysztof Jan Debski
UR PulseScalp MT5 Un indicador comercial calibrado para revendedores que buscan la máxima ventaja en mercados acelerados UR PulseScalp MT5 es una solución comercial de vanguardia para revendedores que buscan la máxima ventaja en mercados acelerados. Este indicador innovador se basa en una fórmula calibrada científicamente que combina el poder de la volatilidad, el flujo de dinero y la fuerza relativa para crear una señal altamente precisa y confiable. Ventajas de usar UR PulseScalp MT5: C
Filtro:
No hay comentarios
Respuesta al comentario
Versión 1.15 2024.05.16
Updated Rectangle's filling
Versión 1.10 2024.05.16
Readjusted Performance and improved the Testing version