UR HighsAndLows MT5
- Indicadores
- Krzysztof Jan Debski
- Versión: 1.10
- Actualizado: 16 mayo 2024
- Activaciones: 5
Máximos y mínimos de UR
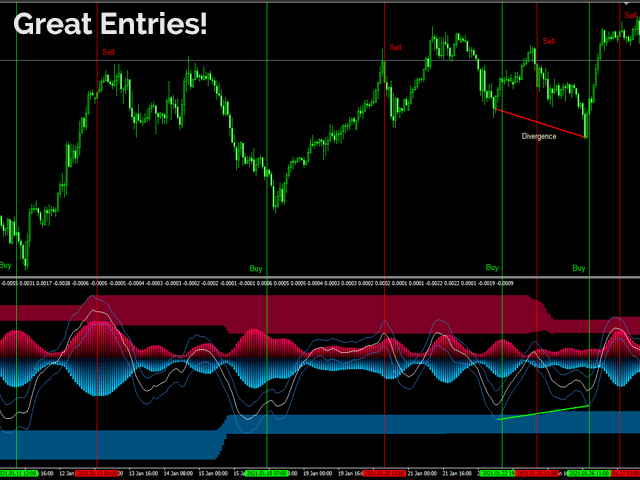
UR Highs&Lows realiza un análisis en profundidad del movimiento de precios y su volatilidad, y crea un canal dentro del cual se mueve el precio. Ese canal se mueve ahora como un oscilador y se superpone con la desviación del precio para señalar posibles agotamientos y posibles reversiones.
Ventajas de usar UR Highs&Lows:
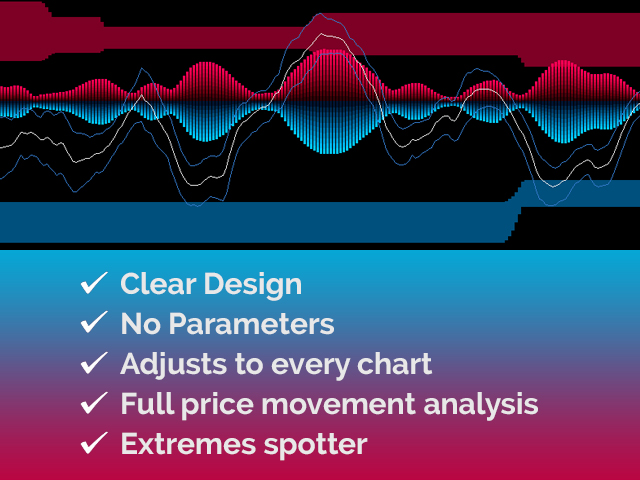
Sin parámetros
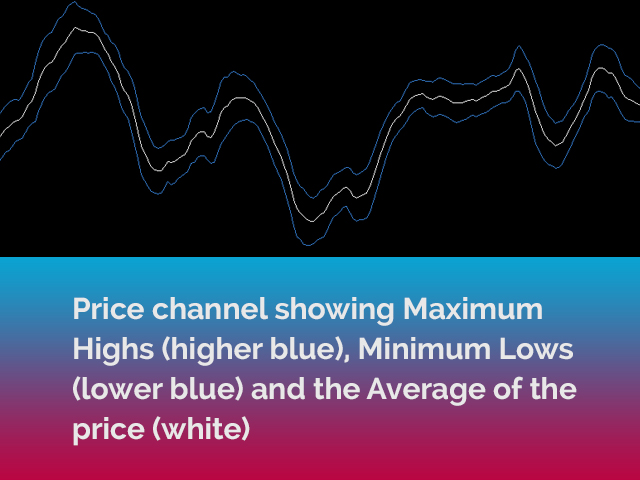
Tiene 3 líneas que describen el movimiento del precio: la línea blanca, que es un promedio del precio, y las líneas azules, que son sus extremos.
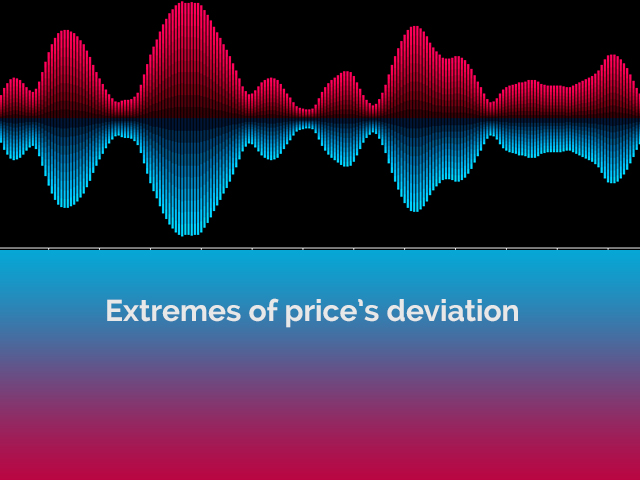
El histograma es una visualización de las desviaciones máximas en el contexto del precio
La interfaz muestra el agotamiento de cualquiera de las líneas en ambos extremos (áreas superior roja y azul inferior)
La mejor ventaja: Fácil y ajustado a todos los activos.
¡Hay un chat especial de Telegram en el que puede mantenerse actualizado con las actualizaciones de herramientas y también enviar una solicitud si siente que falta algo!
¿Por qué UR Highs&Lows?
Este indicador se puede utilizar como indicador independiente, de entrada o de salida. Debido a su dependencia del precio, se puede aplicar a todos los gráficos y su algoritmo de cálculo de desviaciones se basa en varios años de experiencia y observación.
¿Cómo usar UR Highs&Lows?
Consulte la descripción a continuación para familiarizarse más con él:
AJUSTES
Ninguno
MOSTRAR
Price Average Main Line (blanco): El promedio del precio.
Extremos de precios (azul): un canal calculado de extremos de precios.
Histograma: Muestra la desviación de la volatilidad.
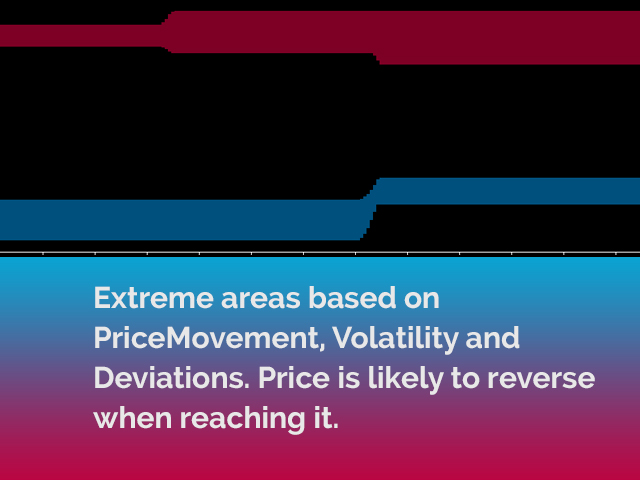
Áreas extremas: áreas donde el precio se agotará y posiblemente se revertirá.
SUMA
Todas mis herramientas funcionan mejor cuando están ensambladas. Lo que significa que la precisión de los puntos de entrada es mucho mejor si se usa con UR DivergenceSpotter, UR VolumeTrend o UR TrendExhaustion.