No Demand or No Supply
- Indicadores
- Hannes Liiker
- Versión: 1.10
- Actualizado: 15 agosto 2021
- Activaciones: 8
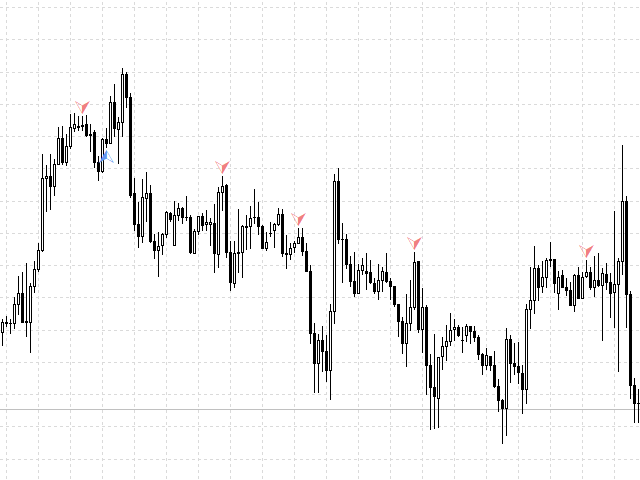
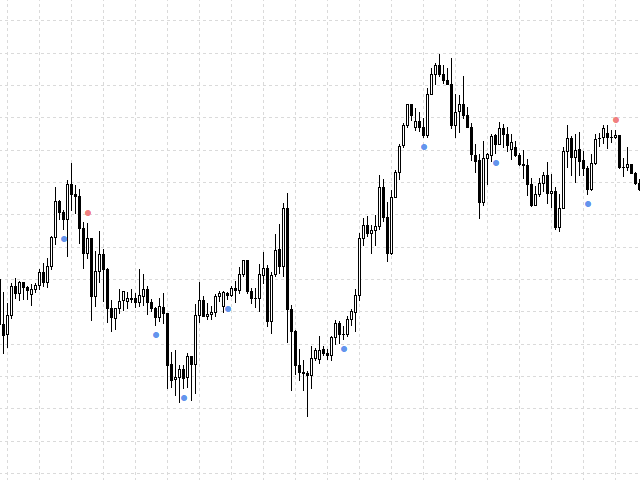
This indicator shows No Demand and No Supply signals for high probability trade entries and exits. Very powerful when combined with specific support and resistance zones to identify turning points in the market.
No Demand– the situation of a deficit of buyers in the up-move. Possible short position.
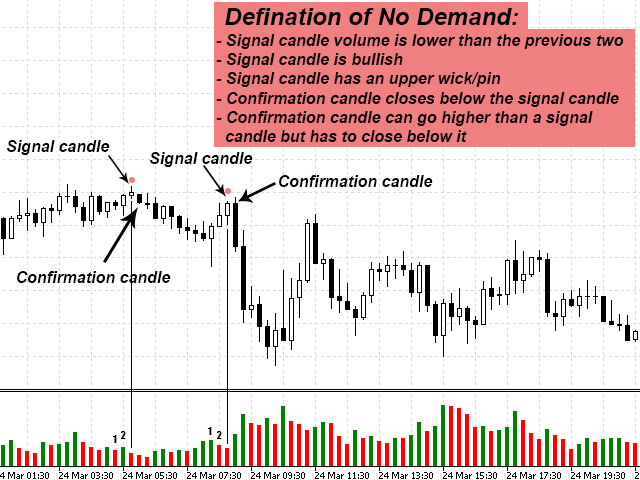
Definition: (look at the below screenshots for illustration)
-
Signal candle volume is lower than the previous two.
-
Signal candle is bullish.
-
Signal candle has an upper wick/pin.
-
Confirmation candle closes below the signal candle.
-
Confirmation candle can go higher than a signal candle but has to close below it.
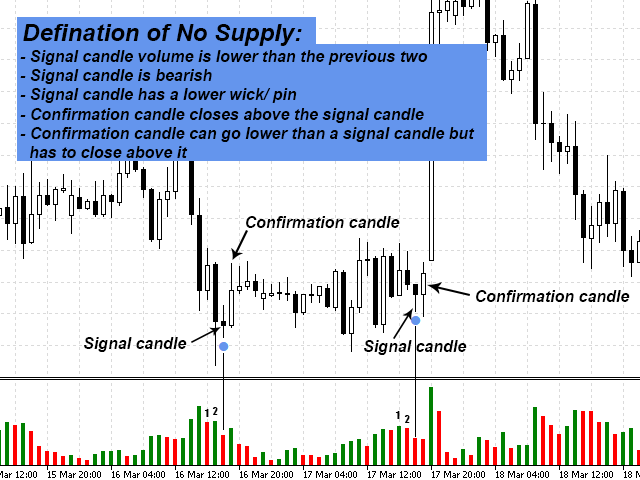
No Supply– the situation of a deficit of sellers in the down-move. Possible long position.
Definition: (look at the below screenshots for illustration)
-
Signal candle volume is lower than the previous two.
-
Signal candle is bearish.
-
Signal candle has a lower wick/ pin.
-
Confirmation candle closes above the signal candle.
-
Confirmation candle can go lower than a signal candle but has to close above it.
Features:
-
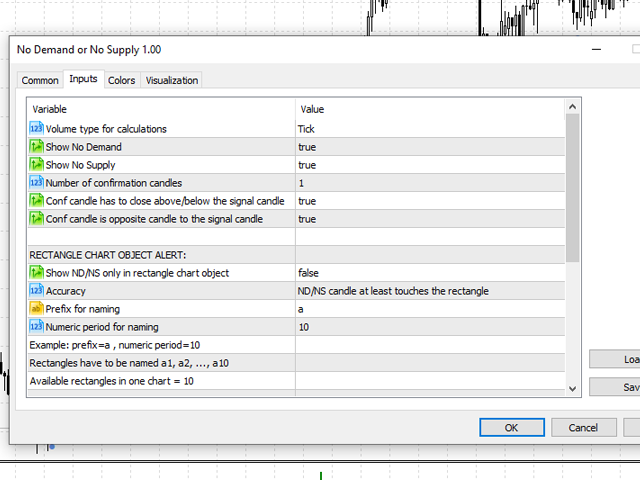
Option to change how many confirmation candles will confirm the signal. Great tool to identify active support and resistance zones from the past.
-
Possibility to change the confirmation candle conditions:
- Confirmation candle has to close above/below the signal candle
- Confirmation candle is opposite candle to the signal candle
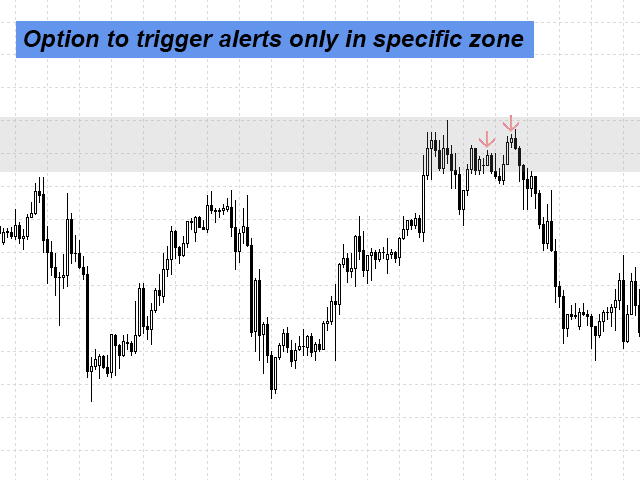
- Option to alert only in a specific zone. Draw a rectangle object on the chart and name it a1, a2, …, a10 (with default settings) and alerts will occur only in this zone. It's a nice robust system if there are already many rectangular zones on the chart for different purposes. With default settings it’s possible to add ten rectangles but this number can be always changed. This option works only with a rectangle chart object.
- Accuracy options for the hit:
- ND/NS signal candle at least touches the rectangle
- ND/NS signal candle body is in rectangle
- ND/NS signal candle is fully in rectangle
-
Change volume type (tick or trade)
-
Show only No Demand or No Supply
-
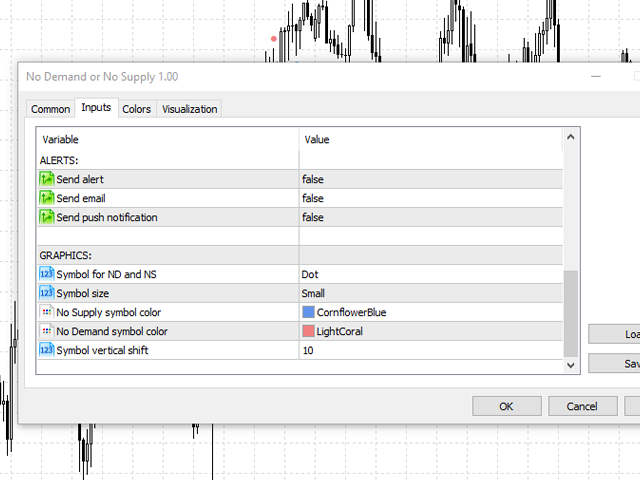
Alerts, email alerts, push notifications
-
Different customizable symbols for plotting No Demand and No Supply signals
-
Multi-timeframe
-
Never repaints