TheStrat FTFC MT5
- Indicadores
- Robert Gerald Wood
- Versión: 1.2
- Actualizado: 16 junio 2021
- Activaciones: 5
FTFC se refiere a Full Timeframe Continuity como se define en The Strat de Rob Smith.
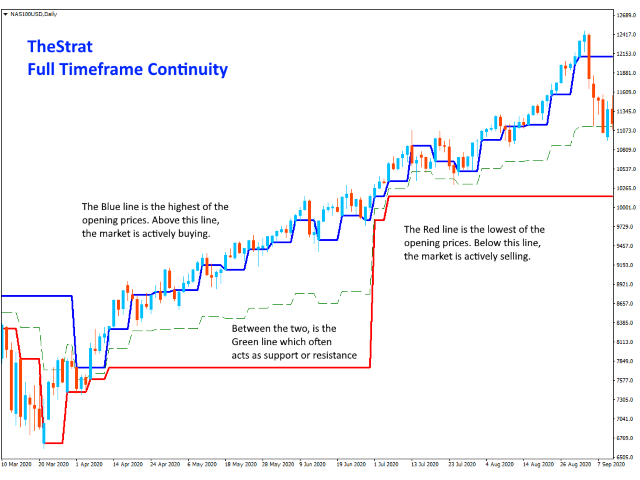
Este indicador dibuja dos líneas en el gráfico, una de las más altas de los niveles de apertura trimestrales, mensuales, semanales, diarias o por horas, y la segunda de las más bajas de esos valores. Esto le da un canal por encima o por debajo del cual es más probable que el comercio sea muy fuerte en una dirección. Entre líneas, la acción del precio será más agitada y es posible que desee utilizar paradas más amplias.
También se dibuja una tercera línea discontinua para mostrar el punto medio entre los máximos y los mínimos. Este suele ser un buen lugar para encontrar soporte o resistencia cuando el mercado intenta empujar el precio en una dirección determinada. Esta línea se puede desactivar si elige establecer el color en NINGUNO.
AJUSTES
Incluir nivel trimestral
Le permite optar por incluir el precio de apertura trimestral en el cálculo, ya que algunas personas prefieren ignorarlo.
Incluir Período de Tiempo Actual Abierto
Cuando es verdadero, si el período de tiempo que se muestra actualmente es H1, D1, W1 o MN1, el indicador incluirá esos períodos abiertos en su cálculo. Esta es una nueva configuración en la última versión del indicador. Anteriormente, el cálculo NO incluía el período de tiempo actual abierto, y esto no concuerda con TheStrat.
La configuración es falsa de forma predeterminada, por lo que los usuarios existentes no se ven afectados a menos que decidan activarlo.
MaxMilliSecondsToCalculate
Para gráficos con mucho historial cargado (más de 10,000 barras), esto limitará la cantidad de tiempo que el indicador tiene para inicializarse. De forma predeterminada, la configuración es 1500 milisegundos, que es 1,5 segundos. Si el indicador no ha logrado realizar todos sus cálculos para barras históricas después de ese período, dejará de intentarlo. Esto significa que siempre obtendrá un historial significativo, pero tenga la garantía de que no hará que su gráfico se detenga.