• Información general
  • Comentarios
  • Discusión (1)
  • Novedades

LT Regression Chanel MT5

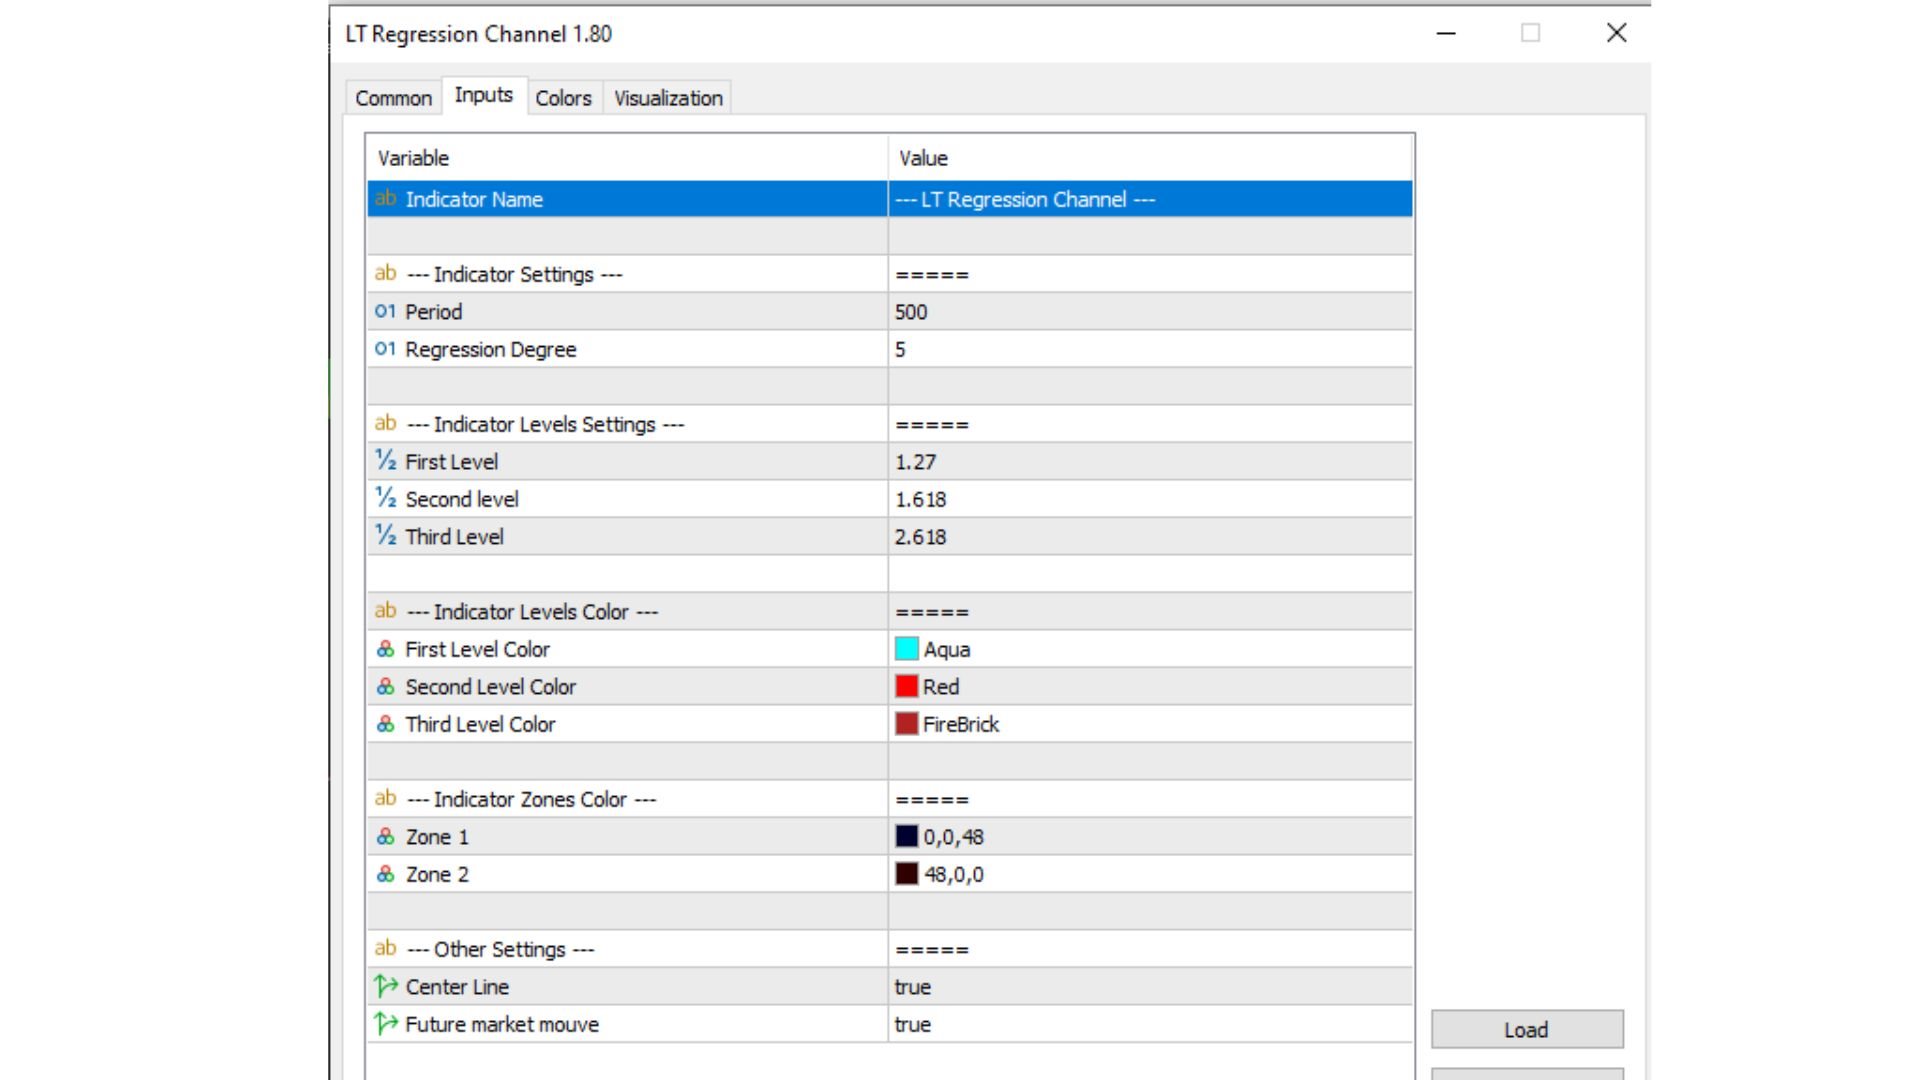
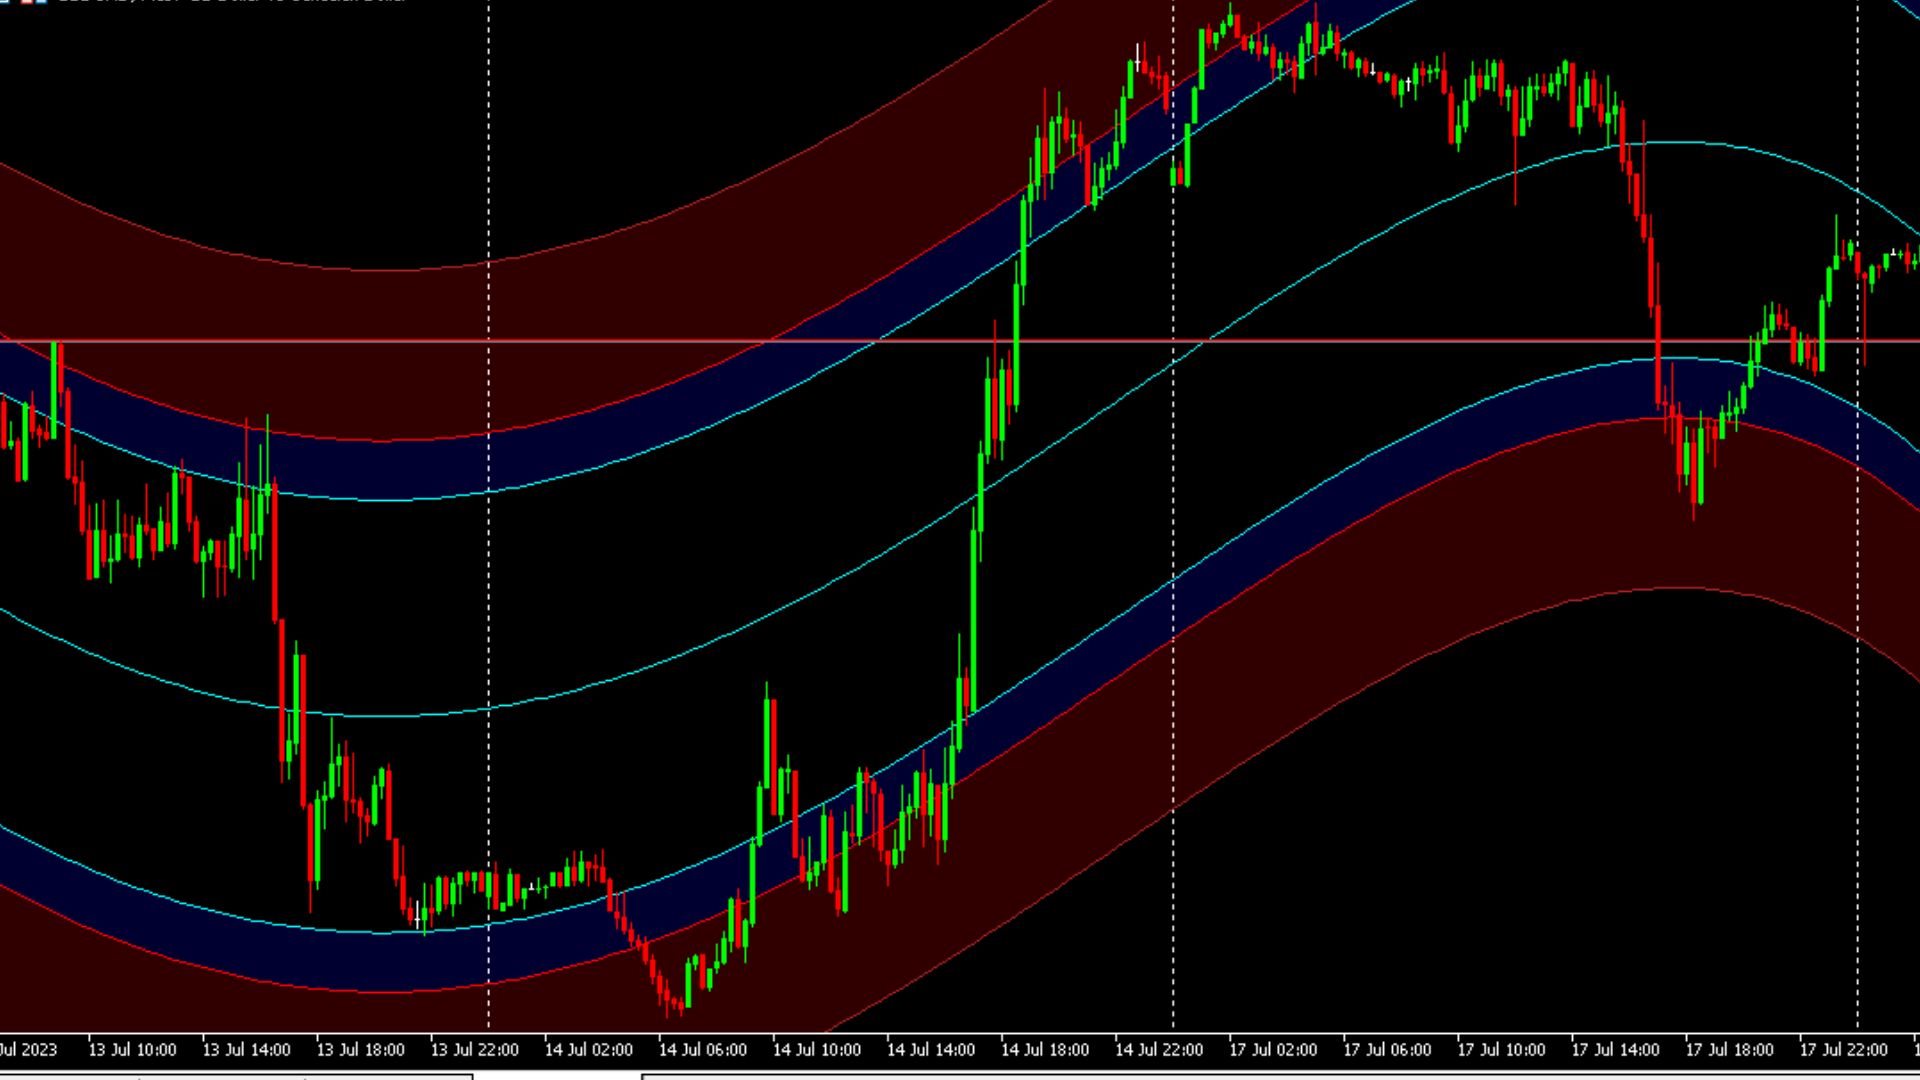
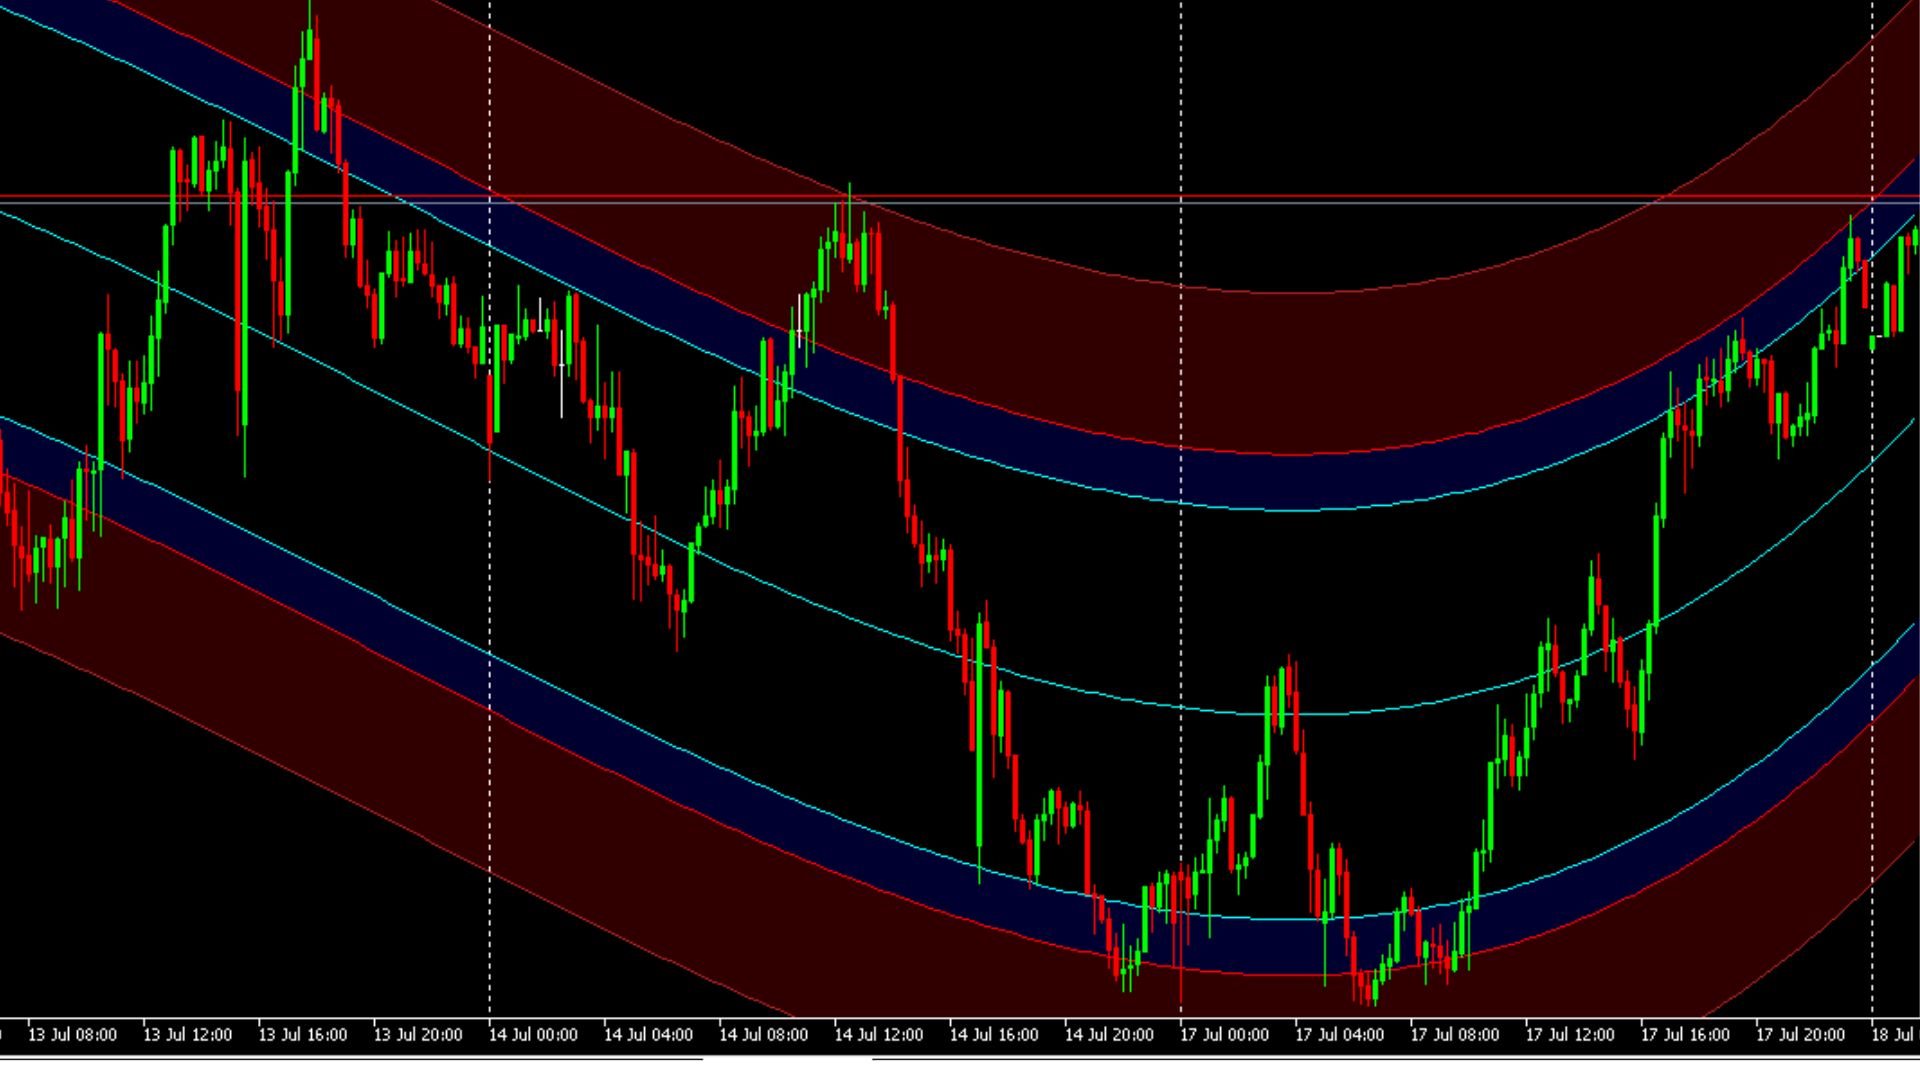
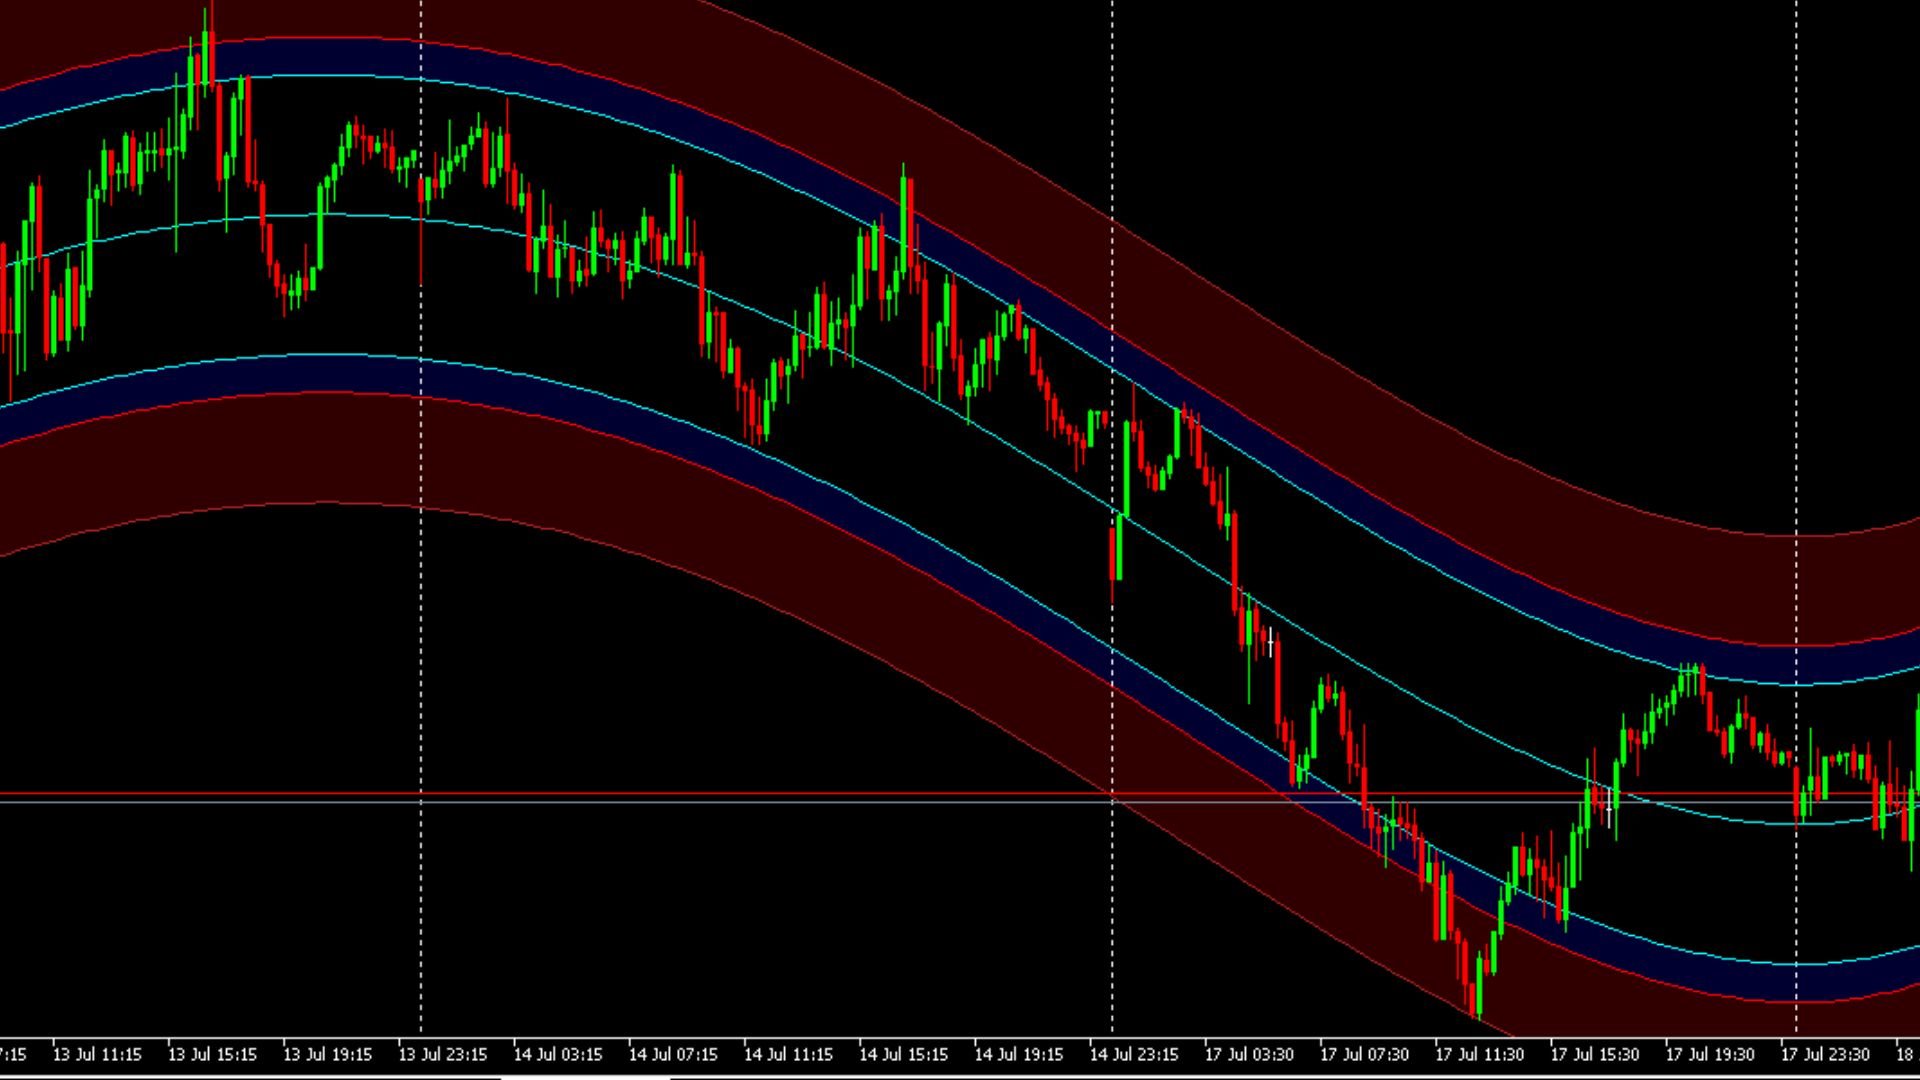
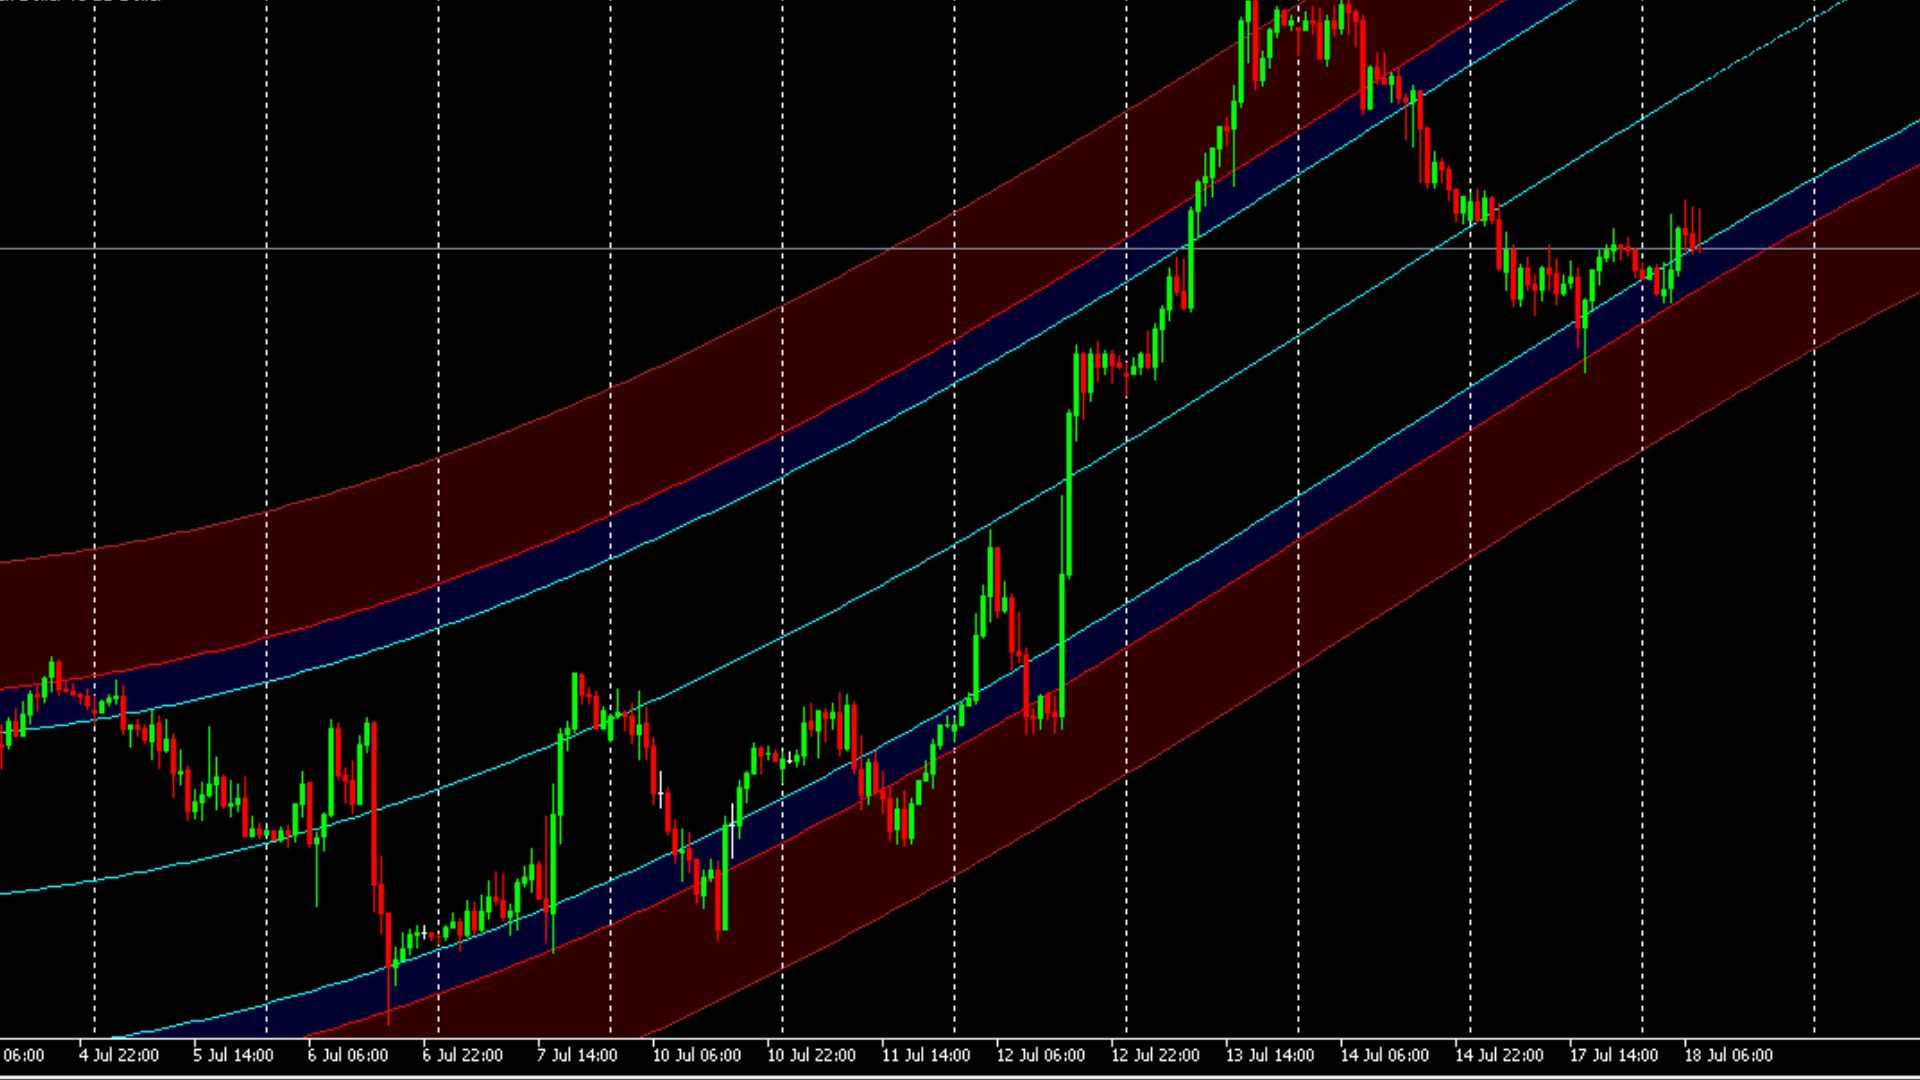
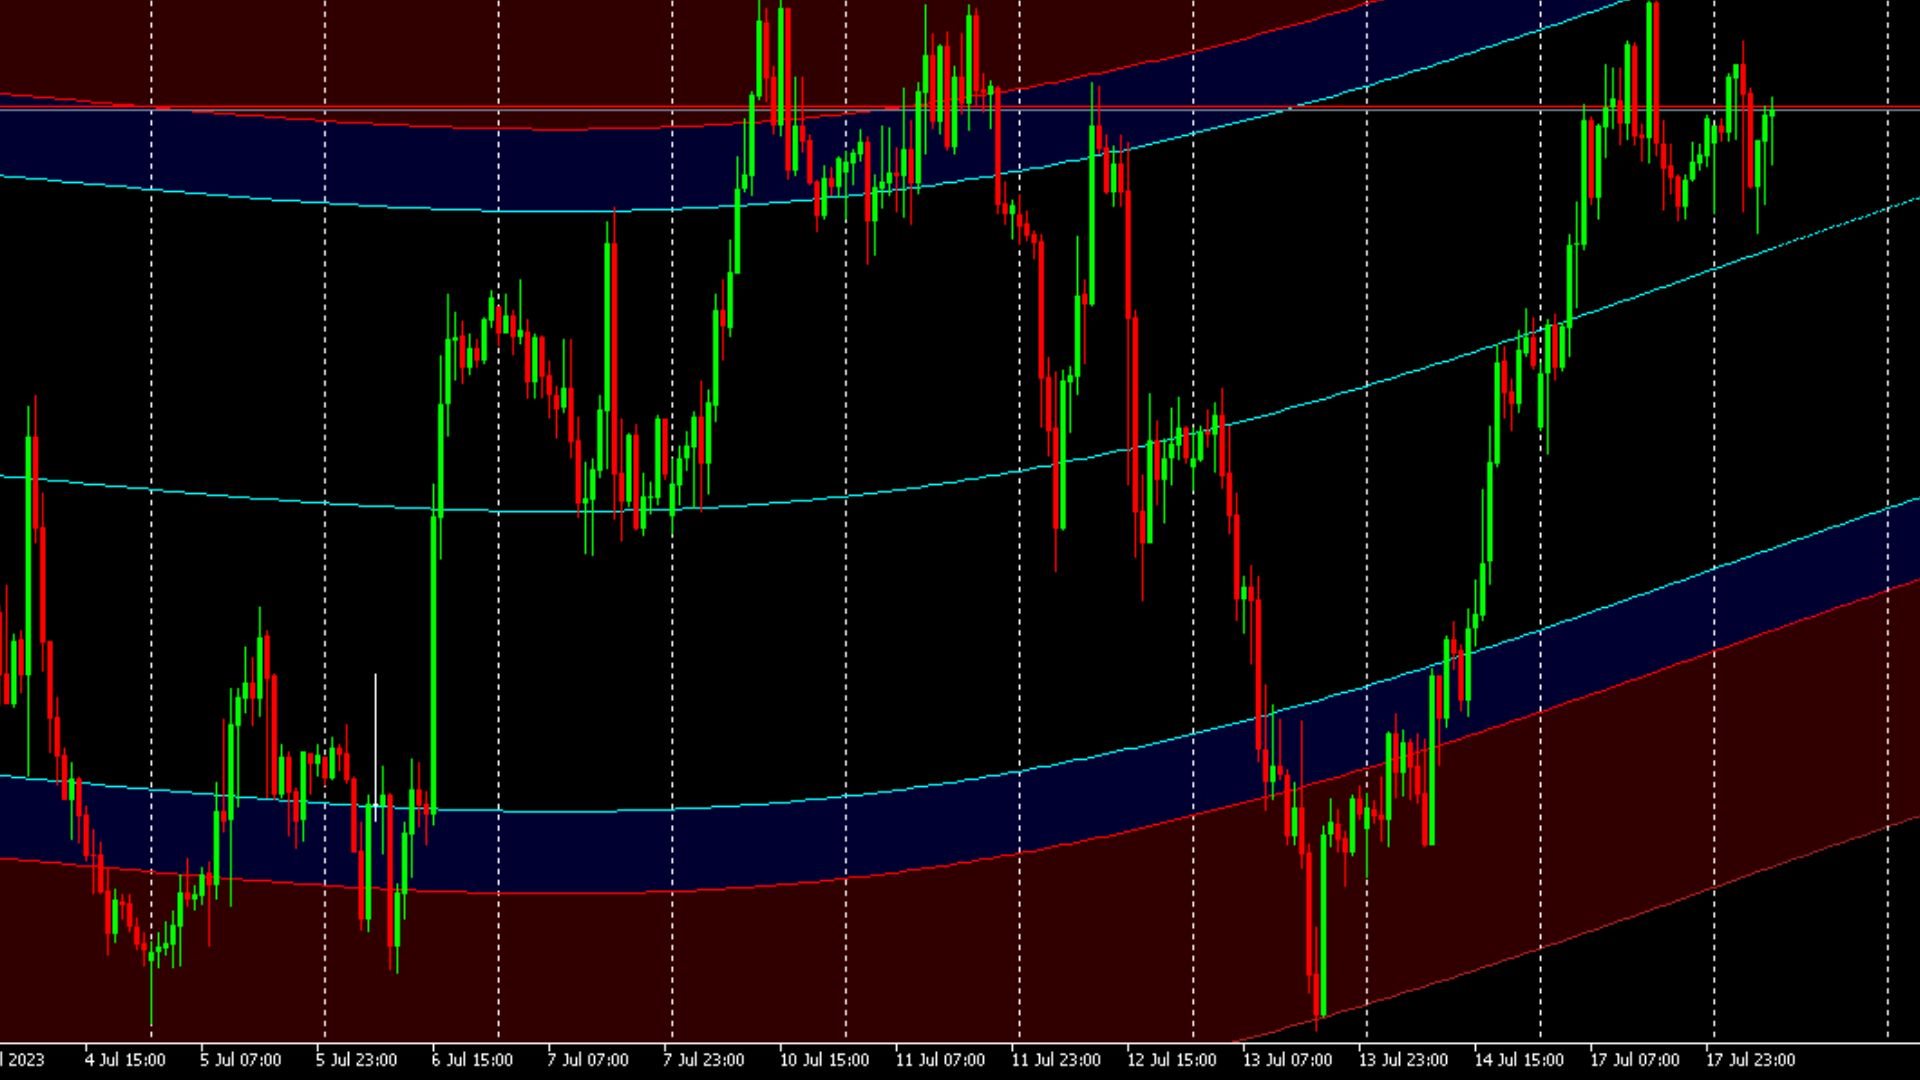
Descubra el Canal de Regresión LT, un poderoso indicador técnico que combina elementos de análisis de Fibonacci, análisis de Envoltura y extrapolar Fourier.

Este indicador está diseñado para evaluar la volatilidad del mercado mientras mejora la precisión en la identificación de niveles de sobrecompra y sobreventa a través del análisis de Fibonacci. También utiliza la extrapolar Fourier para predecir movimientos del mercado al integrar datos de estos indicadores.

Nuestra herramienta versátil se puede utilizar de forma independiente o en combinación con otros indicadores. Es compatible con varios marcos temporales y tipos de gráficos, incluyendo opciones personalizadas como Renko y Heiken Ashi. Aunque puede haber cierta redistribución, su estabilidad mejora significativamente con marcos temporales más largos (se recomienda por encima de 500). Además, proporciona predicciones más precisas con marcos temporales más grandes.

Experimente el poder del Canal de Regresión LT en su estrategia de trading. ¡Pruébelo ahora!


Productos recomendados
Auto Fib Retracements
Ross Adam Langlands Nelson
4.33 (6)
Automatic Fibonacci Retracement Line Indicator. This indicator takes the current trend and if possible draws Fibonacci retracement lines from the swing until the current price. The Fibonacci levels used are: 0%, 23.6%, 38.2%, 50%, 61.8%, 76.4%, 100%. This indicator works for all charts over all timeframes. The Fibonacci levels are also recorded in buffers for use by other trading bots. Any comments, concerns or additional feature requirements are welcome and will be addressed promptly. 
FREE
El Capturador de Tendencias: La Estrategia del Capturador de Tendencias con Indicador de Alerta es una herramienta versátil de análisis técnico que ayuda a los traders a identificar las tendencias del mercado y los posibles puntos de entrada y salida. Presenta una Estrategia dinámica del Capturador de Tendencias, adaptándose a las condiciones del mercado para una clara representación visual de la dirección de la tendencia. Los traders pueden personalizar los parámetros para que se ajusten a s
FREE
Description. The basis for the formation of the Renko chart is the price range. If the price goes beyond its limits, the chart shows a box above or below the previous one. As a result, we see price movement without additional "noise" and important support and resistance levels. Features. For use in conjunction with the Expert Advisor, an additional buffer is implemented-a box counter. For convenience and to increase the speed of testing, the user can use the "new box" event, which the indicato
FREE
Free automatic Fibonacci is an indicator that automatically plots a Fibonacci retracement based on the number of bars you select on the BarsToScan setting in the indicator. The Fibonacci is automatically updated in real time as new highest and lowest values appears amongst the selected bars. You can select which level values to be displayed in the indicator settings. You can also select the color of the levels thus enabling the trader to be able to attach the indicator several times with differe
FREE
A professional tool for trading - the divergence indicator between the WPR and the price, which allows you to receive a signal about a trend reversal in a timely manner or catch price pullback movements (depending on the settings). The indicator settings allow you to adjust the strength of the divergence due to the angle of the WPR peaks and the percentage change in price, which makes it possible to fine-tune the signal strength. The indicator code is optimized and is tested very quickly as par
FREE
PZ Fibonacci MT5
PZ TRADING SLU
4.63 (16)
Are you tired of plotting Fibonacci retracements or extensions manually? This indicator displays Fibo retracements or extensions automatically, calculated from two different price points, without human intervention or manual object anchoring. [ Installation Guide | Update Guide | Troubleshooting | FAQ | All Products ] Easy to use Manual anchoring is not needed Perfect for price confluence studies The indicator evaluates if retracements or extensions are needed Once drawn, you can manually edit t
FREE
This indicator is an automated version of the Fibonacci retracement (Fib) indicator. Deciding the best areas to use when drawing the fib can be tricky and this  indicator was made with that in mind. When you drop it on the chart it will automatically choose the best points to draw the fib with, but in case you aren't satisfied with those regions, you can adjust it as you wish.
FREE
The "   YK Find Support And Resistance " indicator is a technical analysis tool used to identify key support and resistance levels on a price chart. Its features and functions are as follows: 1. Displays support and resistance levels using arrow lines and colored bands, with resistance in red and support in green. 2. Can be adjusted to calculate and display results from a specified timeframe using the forced_tf variable. If set to 0, it will use the current timeframe of the chart. 3. Uses
FREE
Donchian Pro
Paulo Henrique Faquineli Garcia
5 (2)
The Donchian Channel Channels are among the most popular tools of technical analysis, as they visually convey to the analyst the limits within which most price movement tends to occur. Channel users know that valuable information can be obtained at any time, whether prices are in the central region of a band or close to one of the border lines. One of the best known techniques to explore these concepts is Bollinger Bands. However, John Bollinger was not the only one to research the applicatio
FREE
RSI with alerts BDA
Laron Demetris Burrows
4.29 (17)
Este algoritmo predice cambios a corto plazo en el precio con una precisión del 86%*. Cuando hay un movimiento grande determinado por el ATR, durante una condición de sobrecompra o sobreventa, el indicador lo alertará. Predice si el precio será más alto o más bajo que la vela de señal. Perfecto para el comercio de reversión de media, opciones binarias o contratos de futuros en marcos de tiempo más grandes. El indicador se probó en 5 años de datos y tiene una precisión del 90% para predecir reve
FREE
ADR ST Patterns Strategy
Vladimir Poltoratskiy
4.5 (4)
ADR ST Patterns Strategy  is a modification of the classical  ADR  indicator. This simple indicator corresponds to the parameters specified in the  ST Patterns Strategy ( https://stpatterns.com/ ) .  Structural Target Patterns represents the market consistently divided into components. No trend lines, geometric proportions of the model itself, trading volume, or open market interest are needed for the formation of  ST Patterns . They are easily recognized and built only on the basis of breaking
FREE
The CandleStick Scanner is a tool that allow you to perform a   market scan   and search any candlestick pattern that you already created in the current chart, You can perform a quick search in the current chart (500 bars will be scanned),  This is a lite version of  CandleStick Factory for MT5 . The   full version   video can be found here :  https://www.youtube.com/watch?v=fq7pLXqVO94 The  full version  can be purchased here:   https://www.mql5.com/en/market/product/75434 How it works You ca
FREE
"Hunttern harmonic pattern finder" base on the dynamic zigzag with the notification and prediction mode This version of the indicator identifies 11 harmonic patterns and predicts them in real-time before they are completely formed. It offers the ability to calculate the error rate of Zigzag patterns depending on a risk threshold. It moreover sends out a notification once the pattern is complete. The supported patterns: ABCD BAT ALT BAT BUTTERFLY GARTLEY CRAB DEEP CRAB CYPHER SHARK THREE
FREE
Spike Catch Pro
Amani Fungo
4 (5)
Spike Catch Pro 22:03 release updates Advanced engine for searching trade entries in all Boom and Crash pairs (300,500 and 1000) Programmed strategies improvements Mx_Spikes (to combine Mxd,Mxc and Mxe), Tx_Spikes,   RegularSpikes,   Litho_System,   Dx_System,   Md_System,   MaCross,   Omx_Entry(OP),  Atx1_Spikes(OP),   Oxc_Retracement (AT),M_PullBack(AT) we have added an arrow on strategy identification, this will help also in the visual manual backtesting of the included strategies and see h
FREE
Cybertrade Keltner Channels
Emanuel Andriato
4.67 (3)
Cybertrade Keltner Channels - MT5 Created by Chester Keltner, this is a volatility indicator used by technical analysis. It is possible to follow the trend of financial asset prices and generate support and resistance patterns. In addition, envelopes are a way of tracking volatility in order to identify opportunities to buy and sell these assets. It works on periods longer than the period visible on the chart. All values ​​are available in the form of buffers to simplify possible automations.
FREE
Double Tops And Bottoms MT5
Alexander Nikolaev
4.83 (6)
Este indicador busca y muestra los patrones de análisis técnico Double Bottom y Double Top. Señala (muestra un mensaje en la pantalla) si la forma se formó recientemente. A menudo, después de la aparición de estos patrones, la tendencia se invierte o se produce una corrección. Para no buscarlos usted mismo o no perderse su apariencia, es suficiente agregar un indicador al gráfico. El indicador se puede usar en diferentes marcos temporales y pares de divisas, existen configuraciones para una mej
FREE
Basic Harmonic Pattern MT5
Mehran Sepah Mansoor
4.78 (45)
Este indicador identifica los   patrones armónicos   más populares que predicen los puntos de reversión del mercado. Estos patrones armónicos son formaciones de precios que se repiten constantemente en el mercado de divisas y sugieren posibles movimientos futuros de los precios /   Free MT4 Version Además, este indicador tiene incorporada una señal de entrada en el mercado, así como varios take profits y stop losses. Debe tenerse en cuenta que aunque el indicador de patrón armónico puede propor
FREE
PZ Trendlines MT5
PZ TRADING SLU
4.83 (6)
Tired of plotting trendlines? The PZ TrendLines MT5 indicator applies a mechanical approach to the construction of trend lines for you!  [ Installation Guide | Update Guide | Troubleshooting | FAQ | All Products ] It can draw up to 18 trendlines Trendlines can be optionally based on fractals Each line represents a breakout level Each trendline can be broken or rejected Configurable amount of lines Configurable colors Support I am happy to provide free products but given my limited time, they com
FREE
Trend Master Chart MT5
Frederic Jacques Collomb
5 (2)
Trend Master Chart es el indicador de tendencia que necesita. Se superpone al gráfico y utiliza códigos de colores para definir diferentes tendencias/movimientos del mercado. Utiliza un algoritmo que combina dos medias móviles y diferentes osciladores. Los periodos de estos tres elementos son modificables. Funciona en cualquier período de tiempo y en cualquier par. De un vistazo podrás identificar una tendencia alcista o bajista y los diferentes puntos de entrada a esta tendencia. Por ejemplo
FREE
Los Bloques de Orden de Oferta y Demanda: El indicador "Bloques de Orden de Oferta y Demanda" es una herramienta sofisticada basada en Conceptos de Dinero Inteligente, fundamentales para el análisis técnico de Forex. Se enfoca en identificar zonas de oferta y demanda, áreas cruciales donde los traders institucionales dejan huellas significativas. La zona de oferta, que indica órdenes de venta, y la zona de demanda, que indica órdenes de compra, ayudan a los traders a anticipar posibles revers
FREE
Necessary for traders: tools and indicators Waves automatically calculate indicators, channel trend trading Perfect trend-wave automatic calculation channel calculation , MT4 Perfect trend-wave automatic calculation channel calculation , MT5 Local Trading copying Easy And Fast Copy , MT4 Easy And Fast Copy , MT5 Local Trading copying For DEMO Easy And Fast Copy , MT4 DEMO Easy And Fast Copy , MT5 DEMO Bandas de Bollinger avanzadas: 1. El riel de Bollinger cambiará de color con la dirección "
FREE
The indicator plots a curve of the difference between the values ​​of two trading instruments (currency pairs). The purpose of the indicator is to observe the processes of divergence and convergence of the values ​​of two trading instruments. The results obtained can be used for trading strategies of statistical arbitrage, pair trading, correlation, and others. Trading strategy The indicator is attached to the chart of any trading instrument. In the input parameters, the names of trading i
FREE
Value Chart Candlesticks
Flavio Javier Jarabeck
4.67 (9)
The idea of a Value Chart indicator was presented in the very good book I read back in 2020 , " Dynamic Trading Indicators: Winning with Value Charts and Price Action Profile ", from the authors Mark Helweg and David Stendahl. The idea is simple and the result is pure genius: Present candlestick Price analysis in a detrended way! HOW TO READ THIS INDICATOR Look for Overbought and Oversold levels. Of course, you will need to test the settings a lot to find the "correct" one for your approach.
FREE
Curver Arrows
Francis Dube
4 (9)
Es un indicador muy bien conocido. Ha sido portado directamente desde la versión para MetaTrader 4 que está disponible libremente en Internet. No se redibuja en absoluto. El indicador implementa la estrategia de la ruptura. Las flechas indican la dirección del mercado. Utilice este indicador en los períodos de M15 y superiores.
FREE
Bounce Zone MT5
Nguyen Thanh Cong
4 (6)
Introduction The Bounce Zone indicator is a cutting-edge non-repainting technical tool built to identify key areas on the price chart where market sentiment is likely to cause a significant price reversal. Using advanced algorithms and historical price data analysis, this indicator pinpoints potential bounce zones. Combined with other entry signal, this indicator can help forex traders place the best trades possible Signal A possible buy signal is generated when price is in the green zo
FREE
This indicator is designed to detect high probability reversal patterns: Double Tops/Bottoms with fake breakouts . This is the FREE version of the indicator: https://www.mql5.com/en/market/product/29957 The free version works only on EURUSD and GBPUSD! Double top and bottom patterns are chart patterns that occur when the trading instrument moves in a similar pattern to the letter "W" (double bottom) or "M" (double top). The patterns usually occur at the end of a trend and are used to signal tren
FREE
Forex Indicator Arrows
NGUYEN NGHIEM DUY
1 (1)
Forex Indicator Arrows is an arrow Indicator used as an assistant tool for your trading strategy. The indicator analyzes the standard deviation of bar close for a given period and generates a buy or sell signals if the deviation increases. It good to combo with Martingale EA to follow Trend and Sellect Buy Only/Sell Only for EA work Semi-Automatic. You can use this  Indicator with any EAs in my Products.
FREE
This indicator accurately identifies and informs market reversals and continuation patterns by analyzing and signaling the Three White Soldiers / Three Black Crows pattern. User-friendly interface and multi-asset compatibility Fully customizable parameters and colors Does not repaint Can be easily convert its signals into an Expert Advisor. Full support granted. FOR MT5 FULL VERSION:  CLICK HERE   What is the Three White Soldiers / Three Black Crows price action pattern The Three White Soldi
FREE
KTrade Fibo For MT5
Kaijun Wang
4.9 (10)
Necessary for traders: tools and indicators Waves automatically calculate indicators, channel trend trading Perfect trend-wave automatic calculation channel calculation , MT4 Perfect trend-wave automatic calculation channel calculation , MT5 Local Trading copying Easy And Fast Copy , MT4 Easy And Fast Copy , MT5 Local Trading copying For DEMO Easy And Fast Copy , MT4 DEMO Easy And Fast Copy , MT5 DEMO Fibo: from KTrade 1. Automatically calculate and analyze the band. -> Get the desired band 2.
FREE
Peak Trough Analysis is the great tool to detect peaks and troughs in your chart. Peak Trough Analysis tool can use three different peaks and troughs detection algorithm. The three algorithm include the orignal Fractals Indicator by Bill Williams, the Modified Fractals indicator and ZigZag indicator. You can use this peak and trough analysis tool to detect the price pattern made up from Equilibrium Fractal-Wave process. For further usage, there are good guide line on how to use this peak trough
FREE
Los compradores de este producto también adquieren
Atomic Analyst MT5
Issam Kassas
5 (13)
En primer lugar, vale la pena enfatizar que este Indicador de Trading no repinta, no redibuja y no se retrasa, lo que lo hace ideal tanto para el trading manual como para el automatizado. Manual del usuario: configuraciones, entradas y estrategia. El Analista Atómico es un Indicador de Acción del Precio PA que utiliza la fuerza y el impulso del precio para encontrar una mejor ventaja en el mercado. Equipado con filtros avanzados que ayudan a eliminar ruidos y señales falsas, y aumentan el poten
Primero que todo, vale la pena enfatizar que este Sistema de Trading es un Indicador No Repintado, No Redibujado y No Retrasado, lo que lo hace ideal tanto para el trading manual como para el automatizado. Curso en línea, manual y descarga de ajustes preestablecidos. El "Sistema de Trading Inteligente MT5" es una solución completa de trading diseñada para traders nuevos y experimentados. Combina más de 10 indicadores premium y presenta más de 7 estrategias de trading robustas, lo que lo convie
Reversal First Impulse levels (RFI)      INSTRUCTIONS        RUS       -       ENG              R ecommended to use with an indicator   -   TREND PRO -  Version MT4                 A key element in trading is zones or levels from which decisions to buy or sell a trading instrument are made. Despite attempts by major players to conceal their presence in the market, they inevitably leave traces. Our task was to learn how to identify these traces and interpret them correctly. Main functions:: Di
Gold Stuff mt5
Vasiliy Strukov
4.89 (173)
Gold Stuff mt5: un indicador de tendencia diseñado específicamente para el oro, también se puede usar en cualquier instrumento financiero. El indicador no se vuelve a dibujar ni se retrasa. El marco de tiempo recomendado es H1. IMPORTANTE! Póngase en contacto conmigo inmediatamente después de la compra para obtener instrucciones y bonificación! PARÁMETROS Draw Arrow-incl.desactivado. dibujar flechas en el gráfico. Alerts-incl.desactivado.alertas de sonido. E-mail notification-incl.desacti
TPSpro TRENDPRO  - is a trend indicator that automatically analyzes the market and provides information about the trend and each of its changes, as well as giving signals for entering trades without redrawing! The indicator uses each candle, analyzing them separately. referring to different impulses - up or down impulse. Exact entry points into transactions for currencies, crypto, metals, stocks, indices!  -  Version MT4               DETAILED DESCRIPTION               R ecommended to use with
Quantum Trend Sniper
Bogdan Ion Puscasu
5 (39)
Introduciendo       Indicador Quantum Trend Sniper   , el innovador indicador MQL5 que está transformando la forma en que identificas y negocias los cambios de tendencia. Desarrollado por un equipo de comerciantes experimentados con experiencia comercial de más de 13 años,       Indicador de francotirador de tendencia cuántica       está diseñado para impulsar su viaje comercial a nuevas alturas con su forma innovadora de identificar cambios de tendencia con una precisión extremadamente alta.
Trend Screener Pro MT5
STE S.S.COMPANY
4.87 (62)
Desbloquee el poder del comercio de tendencias con el indicador Trend Screener: ¡su solución definitiva para el comercio de tendencias impulsada por lógica difusa y un sistema multidivisa!Mejore su comercio de tendencias con Trend Screener, el revolucionario indicador de tendencias impulsado por lógica difusa. Es un poderoso indicador de seguimiento de tendencias que combina más de 13 herramientas y funciones premium y 3 estrategias comerciales, lo que lo convierte en una opción versátil para co
RelicusRoad Pro MT5
Relicus LLC
4.82 (22)
Ahora $ 147 (aumentando a $ 499 después de algunas actualizaciones) - Cuentas ilimitadas (PC o Mac) Manual de usuario de RelicusRoad + Videos de capacitación + Acceso al grupo privado de Discord + Estado VIP UNA NUEVA MANERA DE VER EL MERCADO RelicusRoad es el indicador comercial más poderoso del mundo para divisas, futuros, criptomonedas, acciones e índices, y brinda a los comerciantes toda la información y las herramientas que necesitan para mantenerse rentables. Brindamos análisis téc
IVISTscalp5
Vadym Zhukovskyi
5 (3)
Te presentamos el indicador iVISTscalp5, que no solo es único sino también efectivo en operaciones de trading. Este indicador se basa en datos temporales y es el resultado de muchos años de experiencia y análisis profundo de los mercados financieros. El indicador iVISTscalp5 es una excelente herramienta para el trading manual. La conveniencia, simplicidad y visualización, toda la complejidad está oculta en su interior. Hemos simplificado al máximo la configuración y uso del indicador iVISTscalp5
FX Volume MT5
Daniel Stein
4.94 (17)
Obtenga su actualización diaria del mercado con detalles y capturas de pantalla a través de nuestro Morning Briefing aquí en mql5 y en Telegram ! FX Volume es el PRIMER y ÚNICO indicador de volumen que proporciona una visión REAL del sentimiento del mercado desde el punto de vista de un bróker. Proporciona una visión impresionante de cómo los participantes institucionales del mercado, como los brokers, están posicionados en el mercado Forex, mucho más rápido que los informes COT. Ver esta info
Bill Williams Advanced
Siarhei Vashchylka
5 (5)
Bill Williams Advanced is designed for automatic chart analysis using Bill Williams' "Profitunity" system. The indicator analyzes four timeframes at once. Manual (Be sure to read before purchasing) Advantages 1. Automatically analyzes the chart using the "Profitunity" system of Bill Williams. The found signals are placed in a table in the corner of the screen. 2. Equipped with a trend filter based on the Alligator indicator. Most of the system signals are recommended to be used only accordi
ICT, SMC, SMART MONEY CONCEPTS, SMART MONEY, Smart Money Concept, Support and Resistance, Trend Analysis, Price Action, Market Structure, Order Blocks, BOS/CHoCH,   Breaker Blocks ,  Momentum Shift,   Supply&Demand Zone/Order Blocks , Strong Imbalance,   HH/LL/HL/LH,    Fair Value Gap, FVG,  Premium  &   Discount   Zones, Fibonacci Retracement, OTE, Buy Side Liquidity, Sell Side Liquidity, BSL/SSL Taken, Equal Highs & Lows, MTF Dashboard, Multiple Time Frame, BigBar, HTF OB, HTF Market Structure
Ante todo, vale la pena enfatizar que esta Herramienta de Trading es un Indicador No Repintado, No Redibujado y No Retrasado, lo que la hace ideal para el trading profesional. Curso en línea, manual del usuario y demostración. El Indicador de Conceptos de Acción del Precio Inteligente es una herramienta muy potente tanto para traders nuevos como experimentados. Combina más de 20 indicadores útiles en uno solo, combinando ideas avanzadas de trading como el Análisis del Trader del Círculo Inte
Dragon Multi Indicator MT5
Mansour Babasafary
5 (3)
74% discount for the next 10 buyers (original price $605): 1 left Get a 50% bonus by buying (or even renting) any of our products. After buying (or renting), send a message for more information. 3 Indicators in 1 indicator Strategy based on price action Made specifically for the best forex currency pairs Can be used in the best time frame of the market at a very reasonable price This indicator is basically 3 different indicatos . But we have combined these 3 indicators in 1 indicator so th
AW Trend Predictor MT5
AW Trading Software Limited
4.77 (56)
La combinación de niveles de tendencia y ruptura en un sistema. Un algoritmo de indicador avanzado filtra el ruido del mercado, determina la tendencia, los puntos de entrada y los posibles niveles de salida. Las señales indicadoras se registran en un módulo estadístico, que le permite seleccionar las herramientas más adecuadas, mostrando la efectividad del historial de señales. El indicador calcula las marcas Take Profit y Stop Loss. Manual e instrucciones ->   AQUÍ   / Versión MT4 ->   AQUÍ Có
Was: $249  Now: $99   Market Profile defines a number of day types that can help the trader to determine market behaviour. A key feature is the Value Area, representing the range of price action where 70% of trading took place. Understanding the Value Area can give traders valuable insight into market direction and establish the higher odds trade. It is an excellent addition to any system you may be using. Inspired by Jim Dalton’s book “Mind Over Markets”, this indicator is designed to suit the
"Piranha" - an autonomous trading system that determines overbought and oversold levels on the chart. Red and blue zones represent overbought and oversold levels respectively. Entry points are marked with arrows: a downward arrow in the red zone for "sell" and an upward arrow in the blue zone for "buy". The Take profit level is indicated by the green moving average. Key features: Adjusting the Take profit level as the green moving average changes position. Averaging ability when a new market e
FxaccurateLS
Shiv Raj Kumawat
WHY IS OUR FXACCCURATE LS MT5 THE PROFITABLE ? PROTECT YOUR CAPITAL WITH RISK MANAGEMENT Gives entry, stop and target levels from time to time. It finds Trading opportunities by analyzing what the price is doing during established trends. POWERFUL INDICATOR FOR A RELIABLE STRATEGIES We have made these indicators with a lot of years of hard work. It is made at a very advanced level. Established trends provide dozens of trading opportunities, but most trend indicators completely ignore them!
Introduciendo       Quantum Breakout PRO   , el innovador indicador MQL5 que está transformando la forma en que comercia con Breakout Zones. Desarrollado por un equipo de comerciantes experimentados con experiencia comercial de más de 13 años,       Desglose cuántico PRO       está diseñado para impulsar su viaje comercial a nuevas alturas con su innovadora y dinámica estrategia de zona de ruptura. El indicador de ruptura cuántica le dará flechas de señal en las zonas de ruptura con 5 zonas
Advanced Supply Demand MT5
Bernhard Schweigert
4.53 (15)
¡Actualmente con 33% de descuento! ¡La mejor solución para cualquier tráder principiante o experto! Este indicador es una herramienta comercial única, de alta calidad y asequible, porque incorpora una serie de características patentadas y una nueva fórmula. Con esta actualización, podrá mostrar zonas de doble marco temporal. No solo podrá mostrar un marco temporal más alto, sino también mostrar ambos, el marco temporal del gráfico MÁS el marco temporal más alto: MOSTRANDO ZONAS ANIDADAS. A todos
IX Power MT5
Daniel Stein
5 (3)
IX Power   lleva por fin la insuperable precisión de FX Power a los símbolos que no son de Forex. Determina con exactitud la intensidad de las tendencias a corto, medio y largo plazo de tus índices, acciones, materias primas, ETF e incluso criptodivisas favoritas. Puede   analizar todo lo   que su terminal le ofrece. Pruébalo y experimenta cómo   tu timing mejora significativamente   a la hora de operar. Características principales de IX Power Resultados de cálculo 100% precisos y sin rep
Gartley Hunter Multi
Siarhei Vashchylka
5 (6)
Gartley Hunter Multi - An indicator for searching for harmonic patterns simultaneously on dozens of trading instruments and on all classic timeframes: (m1, m5, m15, m30, H1, H4, D1, Wk, Mn). Manual (Be sure to read before purchasing) | Version for MT4 Advantages 1. Patterns: Gartley, Butterfly, Shark, Crab. Bat, Alternate Bat, Deep Crab, Cypher 2. Simultaneous search for patterns on dozens of trading instruments and on all classic timeframes 3. Search for patterns of all possible sizes. Fr
Black Dragon indicator mt5
Ramil Minniakhmetov
4.83 (58)
El indicador de detección de tendencias complementará cualquier estrategia y también se puede utilizar como una herramienta independiente. Ventajas Fácil de usar, no sobrecarga el gráfico con información innecesaria; Puede usarse como filtro para cualquier estrategia; Tiene niveles integrados de soporte y resistencia dinámicos, que se pueden usar tanto para obtener ganancias como para establecer límites de pérdidas; El indicador no cambia de color después de que se cierra la vela;  Funciona
Auto Order Block with break of structure based on ICT and Smart Money Concepts (SMC) Futures Break of Structure ( BoS )             Order block ( OB )            Higher time frame Order block / Point of Interest ( POI )    shown on current chart           Fair value Gap ( FVG ) / Imbalance   -  MTF      ( Multi Time Frame )    HH/LL/HL/LH  -  MTF      ( Multi Time Frame )  Choch  MTF      ( Multi Time Frame )  Volume Imbalance     ,  MTF          vIMB Gap’s Equal High / Low’s     ,
El indicador de reversión de ADR le muestra de un vistazo dónde se cotiza actualmente el precio en relación con su rango diario promedio normal. Recibirá alertas instantáneas a través de una ventana emergente, correo electrónico o push cuando el precio exceda su rango promedio y los niveles por encima de su elección para que pueda saltar rápidamente a retrocesos y reversiones. El indicador dibuja líneas horizontales en el gráfico en los extremos del rango promedio diario y también extensiones p
Introducing the South African Sniper indicator created by a small group of traders with a few years trading trading the financial market profitably . This is a plug and play indicator that provides you with  BUY and SELL (SNIPER ENTRY) signals with TARGET and trail stops. The indicator Works with all MT5 trading instruments. The indicator uses previous  chart data as receipt to speculate on future market moves.
Blahtech Supply Demand MT5
Blahtech Limited
4.57 (14)
Was: $299  Now: $99   Supply Demand uses previous price action to identify potential imbalances between buyers and sellers. The key is to identify the better odds zones, not just the untouched ones. Blahtech Supply Demand indicator delivers functionality previously unavailable on any trading platform. This 4-in-1 indicator not only highlights the higher probability zones using a multi-criteria strength engine, but also combines it with multi-timeframe trend analysis, previously confirmed swings
Golden Gate Algo MT5
James David Lane
4 (6)
¡40% DE DESCUENTO PARA NAVIDAD! ¡AUMENTO DE PRECIO A $250 EL 1 DE ENERO! Presentamos GoldenGate Entries: ¡Una Solución de Trading de Vanguardia! Descubre un enfoque revolucionario para el trading con GoldenGate Entries (GGE), un indicador avanzado diseñado para elevar tu experiencia de trading. GGE proporciona un conjunto completo de características para capacitar a los usuarios con precisión y confianza en sus decisiones comerciales. Pares: Cualquiera (FX - Materias primas - Acciones - A
Quantum Heiken Ashi PRO MT5
Bogdan Ion Puscasu
4.5 (8)
Presentamos el   Quantum Heiken Ashi PRO Diseñadas para brindar información clara sobre las tendencias del mercado, las velas Heiken Ashi son reconocidas por su capacidad para filtrar el ruido y eliminar las señales falsas. Diga adiós a las confusas fluctuaciones de precios y dé la bienvenida a una representación gráfica más fluida y confiable. Lo que hace que Quantum Heiken Ashi PRO sea realmente único es su fórmula innovadora, que transforma los datos de velas tradicionales en barras de colore
Conviértase en un Breaker Trader y obtenga beneficios de los cambios en la estructura del mercado a medida que se invierte el precio. El indicador de ruptura de bloque de órdenes identifica cuándo una tendencia o movimiento de precio se acerca al agotamiento y está listo para revertirse. Le alerta sobre cambios en la estructura del mercado que generalmente ocurren cuando una reversión o un retroceso importante están a punto de suceder. El indicador utiliza un cálculo patentado que identific
Otros productos de este autor
LT Super Trend
Sie Samuel Roland Youl
4.88 (8)
El indicador Super Trend es una herramienta popular de análisis técnico utilizada por traders para identificar la dirección de una tendencia y los posibles puntos de entrada y salida en el mercado. Es un indicador que sigue la tendencia y proporciona señales basadas en la acción del precio y la volatilidad. El indicador Super Trend consta de dos líneas: una indica la tendencia alcista (generalmente de color verde) y la otra indica la tendencia bajista (generalmente de color rojo). Las líneas
FREE
LT Envelope
Sie Samuel Roland Youl
Presentamos nuestro innovador LT Envelope EA, una poderosa herramienta diseñada para mejorar tu experiencia de trading utilizando el indicador Envelope. Este asesor experto está específicamente creado para brindar a los traders excepcionales características clave y funcionalidades flexibles, convirtiéndolo en una solución indispensable para el seguimiento de tendencias y la optimización de los resultados de trading en los mercados financieros. Principales características: 1. Estrategia del
LT Nrtr
Sie Samuel Roland Youl
Presentamos el poderoso indicador NRTR (Nick Rypock Trailing Reverse) - una herramienta técnica imprescindible para los traders que buscan identificar las inversiones de tendencia y establecer niveles efectivos de stop trailing. Desarrollado por Nick Rypock, este indicador cuenta con un algoritmo único que se adapta a las cambiantes condiciones del mercado, convirtiéndose en una adición invaluable para el arsenal de cualquier trader. Aquí están las dos formas populares en las que los traders
FREE
Este EA utiliza una estrategia de trading simple pero efectiva, lo que lo hace adecuado para traders de todos los niveles. Opera analizando patrones de velas y ejecutando operaciones en consecuencia. Cuando la vela anterior indica una tendencia alcista, el EA iniciará una operación de compra en la siguiente vela. Por el contrario, si la vela anterior indica una tendencia bajista, el EA colocará una operación de venta. Aunque puede sonar poco convencional, este enfoque ha mostrado resultados n
LT Rsi
Sie Samuel Roland Youl
Introducimos el indicador RSI (Índice de Fuerza Relativa), un oscilador de impulso ampliamente utilizado en el análisis técnico, diseñado para evaluar la fuerza de los movimientos de precios e identificar posibles condiciones de sobrecompra o sobreventa en instrumentos financieros. El RSI se calcula utilizando una fórmula matemática basada en el promedio de las ganancias y pérdidas de precios durante un período específico, generalmente 14 períodos. Su valor varía de 0 a 100 y se muestra como un
¡Potencie sus operaciones con nuestro Asesor Experto de Medias Móviles Super Cargado! ¿Está listo para llevar sus operaciones al siguiente nivel? La Media Móvil es una herramienta favorita de los operadores de todo el mundo, ¡y ahora la hemos llevado un paso más allá! Nuestro AE (Asesor Experto) está diseñado para impulsar su estrategia de operaciones integrando los tres enfoques de medias móviles más populares: Señales de Cruce: Reciba alertas cuando el precio cruce una media móvil. Cruce Doble
Embark on a journey into the dynamic world of Bollinger Bands with our Bollinger Bands EA. This expert advisor is your gateway to three powerful trading strategies, each intricately woven around the pulsating heart of Bollinger Bands. It's more than just a tool; it's your partner in navigating the ever-changing tides of the market, designed to empower traders of every caliber. Key Features: Triple Strategy Power : Our EA integrates three distinct trading strategies centered around Bollinger Band
LT Macd EA
Sie Samuel Roland Youl
Unlock the full potential of MACD (Moving Average Convergence Divergence) trading with our versatile MACD Multi-Strategy Expert Advisor, designed for traders of all levels. This powerful tool brings multiple MACD trading strategies under one roof, empowering you to explore MACD trend trading, reversal strategies, and more with ease. Key Features: Multiple MACD Strategies: Our Expert Advisor incorporates a variety of MACD-based trading strategies, giving you the flexibility to choose the one that
LT Adx EA
Sie Samuel Roland Youl
Unlock the power of ADX trading strategies with our versatile and user-friendly expert advisor. Our All-in-One ADX Expert Advisor is your key to successful trading with multiple ADX strategies and different ADX indicator support. Whether you're a novice trader or an experienced pro, this EA is designed to elevate your trading experience. Key Features: 1. Multi-Strategy Trading: Our expert advisor supports multiple ADX trading strategies, providing you with flexibility to adapt to various ma
LT Alligator EA
Sie Samuel Roland Youl
Experience the immense potential of the Alligator indicator like never before with our Alligator Expert Advisor. This powerful tool is meticulously designed to harness the wisdom of this iconic indicator and elevate your trading to new heights.  The Alligator indicator, created by legendary trader Bill Williams, is not just a tool – it's a philosophy. It's based on the concept that the market exhibits different phases – sleeping, waking, and eating. By understanding these phases, you gain a rema
Are you ready to take your trading to the next level? Our Awesome Oscillator Expert Advisor is here to help you make more informed and profitable trading decisions. Packed with four unique trading strategies, advanced features, and customizable filters, this EA is the ultimate tool for both novice and experienced traders. Key Features : Four Proven Trading Strategies : Our EA offers four distinct trading strategies based on the Awesome Oscillator indicator. Whether you prefer trend-following, re
Unlock the full potential of Bollinger Bands with the Bollinger Bands Pro EA! Our expert advisor is here to revolutionize your trading experience, offering not one, but three powerful trading strategies based on the time-tested Bands expert. Whether you're a novice or an experienced trader, this EA is designed to suit your needs with an array of features that make trading easier and more flexible. Key Features: Triple Strategy Power : Our EA incorporates three distinct trading strategies centere
LT Stochastic EA
Sie Samuel Roland Youl
LT Stochastic EA is an expert advisor based on the on the Stochastic Oscillator indicator. It is one of the most used indicators by traders around the world. The LT Stochastic EA offer you the possibility to automate 4 different stochastic trading strategy (please refer to the attached pictures). Not only it is user friendly, it has also been designed to offer  great amount of flexibility to suit the need of everyone. IT comes in bult with many options such as:  Trading on Normal or Custom Symbo
LT Rvi EA
Sie Samuel Roland Youl
The RVI indicator, or Relative Vigor Index, is a paramount tool that traders around the world rely on for its unparalleled ability to measure market momentum. By integrating this influential indicator, the LT RVI EA empowers you with the insight needed to make data-driven, precise trading decisions. Are you looking to streamline your trading and harness the potential of the Relative Vigor Index indicator? Look no further! The LT RVI EA is here to revolutionize your trading strategies. Whether yo
LT Gap EA
Sie Samuel Roland Youl
Discover the ultimate solution for trading market gaps with the LT Gap EA, now available on MQL5. With three powerful strategies at your disposal, you can maximize your gap trading potential like never before. Key Features: Versatile Strategies: Choose from three distinct gap trading strategies. Trade all gaps, focus on gaps meeting predefined minimum criteria, or execute trades exclusively when gap distances match predefined values. Customization Galore: Tailor your trading experience with a w
Filtro:
No hay comentarios
Respuesta al comentario
Versión 2.50 2023.10.16
El indicador ha sido optimizado
Versión 2.0 2023.07.27
Bug fixed
Versión 1.85 2023.07.18
Fixed a little bug.