Trailing Uses Quadratic Regression
- Indicadores
- Vladimir Komov
- Versión: 1.0
- Activaciones: 5
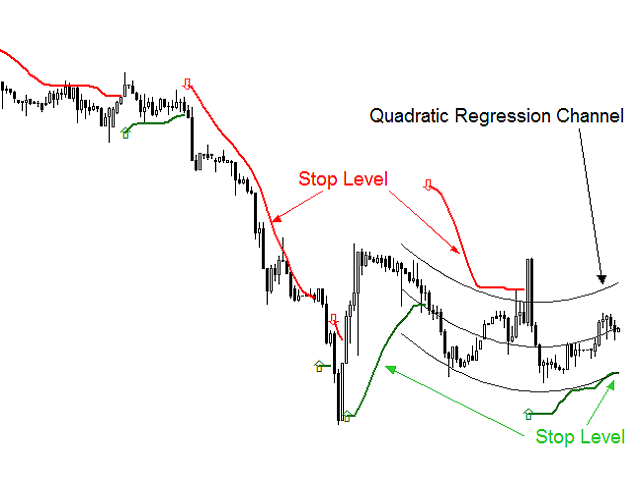
- This is an indicator of directional movement that allows you to determine the trend at the time of its inception and set the levels of a
protective stop.
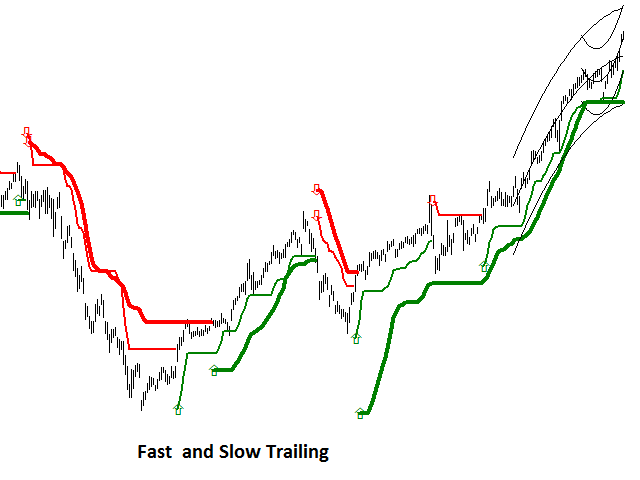
Trailing can be carried out both from below, when the stop level is below the current price and is pulled up behind the price if it increases, and
above, when stop levels are above the current price.
Unlike trailing with a constant distance, the stop level is set at the lower boundary of the quadratic regression channel (in the case of
trailing from the bottom). When trailing from above, the stop is located on the upper border of the channel.
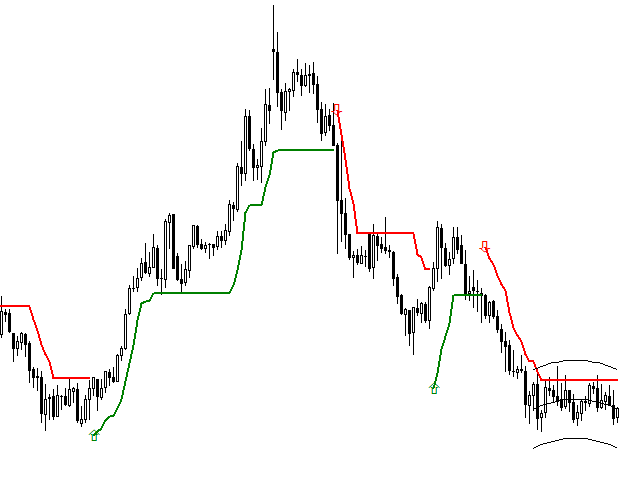
A change in the direction of trailing occurs when the stop level crosses at the closing price of the bar.
Moments of trend change are indicated by arrows.
Benefits
Stable trend recognition from its inception to the end.
It is easily perceived and interpreted.
It works on any instrument.
Works on all timeframes.
Not redrawn, not recounted.
Options
regression period - period of quadratic regression
multiplier- coefficient setting the channel width
The boundaries of the channel are separated from its middle by the value multiplier * Sigma, where Sigma is the standard deviation of closing
prices from the regression line.
Using
The indicator can be used in several ways.
As a sign of a trend.
To assess the strength of the trend: when the price significantly exceeds the indicator line, a growing trend is gaining strength. If the
price approaches the indicator line, then the growing trend is weakening. A falling trend is likewise recognized.
To generate buy / sell signals when the price crosses the indicator line.
Features
The longer the regression period, the less often the indicator signals about a trend change