• Información general
  • Comentarios
  • Discusión

CPA Candle Pattern Analyze

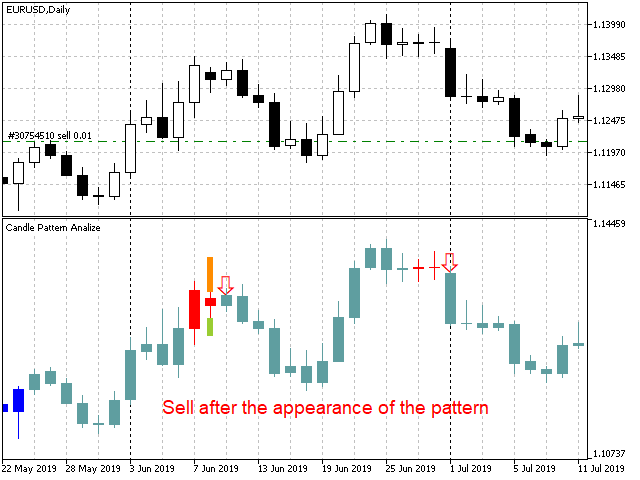
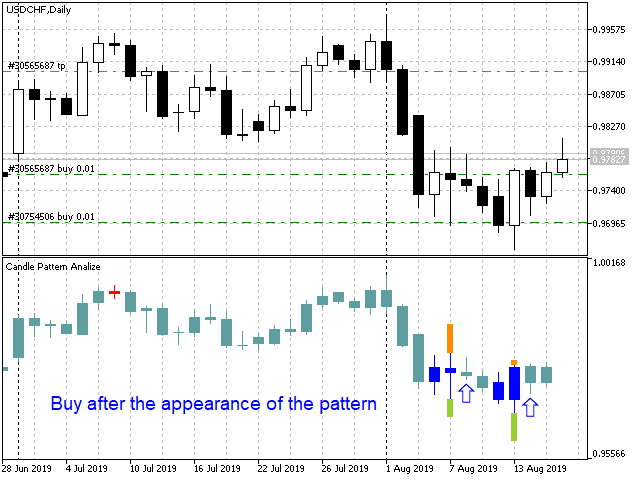
CPA - "Candle Pattern Analyze" - Индикатор поиска и анализа свечных моделей.

Индикатор осуществляет поиск наиболее ликвидных свечных моделей, а так же производит анализ истории, как развивалась цена в прошлом.

Внимание!

В тестере стратегий индикатор показывает только свечные модели. Линии возможного движения, формируются на истории, и показываются только в терминале (естественно при условии наличия истории выбранного интервала).

Настройки индикатора по умолчанию - минимальны, то есть, перед использованием, надо настроить на конкретный график.

Первые два параметра настроек влияют на формирование свечных моделей, остальные на уровень возможного движения цены.

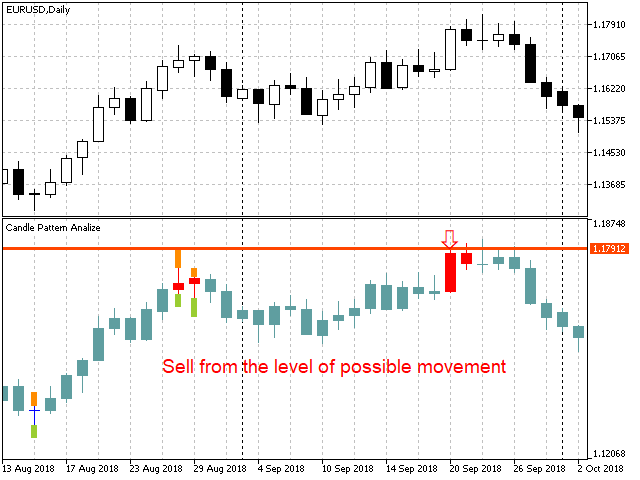
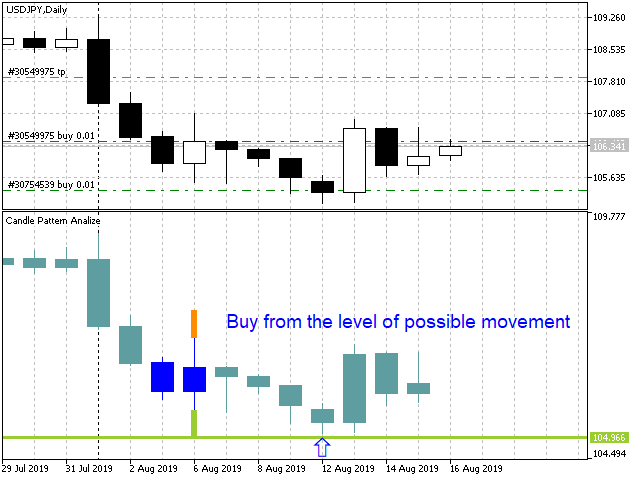
Уровень возможного движения цены - это вероятность движения цены после появления свечной модели, в верх или в низ, на уровень пунктов указанных в настройках "Completed points after the signal". Изображается в виде линий, над и под свечной моделью, зависит от истории и от настроек.

Настройки индикатора:

  • Trend level - Уровень тренда - в среднем равняется 1/2 пунктов размаха цены в канале (чем больше, тем меньше ложных свечных моделей показывается);
  • Trend analyzed - Анализ тренда - на каком количестве данных производить анализ тренда (в среднем от 3 до 6 наиболее оптимально);
  • Analyzed Candles - Анализируемые свечи - размер данных для сравнения с историей (если значение будет больше 300, то возможно, индикатор будет существенно притормаживать);
  • The analyzed period - Период анализа - размер данных истории для сравнения с анализируемыми свечами (параметр подбирается индивидуально и влияет на показ уровня возможного движения цены после появления модели, если рынок от года в год очень сильно изменяется, то значение должно быть меньше, если же рынок часто повторяет то что было давно в истории, то значение должно быть больше);
  • Number of candles in the analyzed period - Количество свечей в анализируемом периоде - ручной ввод предыдущего параметра (в предыдущем параметре надо выбрать "Manual Number Candles");
  • Given the percentage of matches - Учитывать процент совпадения свечной модели, для формирования уровня возможного движения цены (уровень процента совпадения задаётся в "Pattern match percentage");
  • Given only pattern (or all candle) for compare - Рассматривать только образованные свечные модели = true, или рассматривать, все свечи = false (при "false", показывает больше уровней возможного движения цены);
  • Given the change of pattern direction - Не рассматривать движение цены, если уровень не пройден, при этом появилась новая модель (на большинстве графиков, мало влияет на индикацию);
  • Pattern match percentage - Размер процентного совпадения, для выявления уровня возможного движения цены (чем больше, тем более точно выявляется уровень, но так как графики сильно изменчивые, данный параметр хорошо показал себя на значениях от 30 до 50, при значении более 90, возможно не будет показывать уровни вообще, максимальное значение - 100);
  • Completed points after the signal - Количество пройденных пунктов, для зачисления уровня возможного движения цены (обычно равняется 1/4 от размаха цены в канале, подбирается индивидуально под график);
На скриншотах приводятся, основные варианты входа в рынок. Один из вариантов входа можно рассматривать отскок от уровня возможного движения цены (смотри скриншоты), это было получено в результате эмпирического формирования уровня, хотя сам уровень показывает - куда цена обычно ходит после данной свечной модели. Уровень тренда так же рассчитывается по эмпирической формуле. Индикатор можно использовать как один, так и в совокупности с несколькими, для подтверждения входа или для его сомнения.

Productos recomendados
ACPD – «Auto Candlestick Patterns Detected» - The indicator for automatic detection of candlestick patterns. The Indicator of Candlestick Patterns ACPD is Capable of: Determining 40 reversal candlestick patterns . Each signal is displayed with an arrow, direction of the arrow indicates the forecast direction of movement of the chart. Each caption of a pattern indicates: its name , the strength of the "S" signal (calculated in percentage terms using an empirical formula) that shows how close is t
This is a multi-symbol and multi-timeframe table-based indicator designed for a candlestick patterns detection with 46 patterns for META TRADER 5. Each formation has own image for easier recognition. Here you find most popular formations such as "Engulfing", "Hammer", "Three Line Strike", "Piercing" or Doji - like candles. Check my full list of patterns on my screenshots below. Also you can not only switch all bearish or bullish patterns from input, but also select formation for a specified symb
The   Three Inside Up   candlestick pattern is formed by three candles. Here’s how to identify the Three Inside Up candlestick pattern: The first candle must be bearish The second candle must be bullish The close of the second candle should ideally be above the 50% level of the body of the first one The third candle should close above the first one This 3-candle bullish candlestick pattern is a reversal pattern, meaning that it’s used to find bottoms. For this reason, we want to see this patter
CandleStick Pattern Indicator MT5
Driller Capital Management UG
5 (2)
This is a simple Candle Stick Pattern Indicator, which shows in the current time period all standardisized Patterns in the chart. All Patterns will be calculatet automatically based on standard conditions. Following Candle Stick Patterns are included: Bullish Hammer | Bearish Hammer Bullish Inverted Hammer | Bearish Inverted Hammer Bullish Engulfing | Bearish Engulfing Piercing | Dark Cloud Cover Bullish 3 Inside | Bearish 3 Inside There are only a few settings at the begining to take. Every Pat
FREE
50+ Candlestick Patterns, Simulated Trading Results, Top Five Performers Candle Analysis extends Candlesticks Pattern Analysis by not only identifying Patterns but also recording the Past Performance of the Patterns. What it Does:- Identifies and plots results on chart Displays Top Patterns for both Bullish and Bearish type.  Log can be printed in experts tab to see Simulated Trading results Displays All or Selected Patterns Alerts on Pattern formation More detailed information in   Blog
The Bheurekso Pattern Indicator for MT5 helps traders automatically identify candlestick pattern that formed on the chart base on some japanese candle pattern and other indicator to improve accurate. This indicator scans all candles, recognizes and then displays any candle patterns formed on the chart. The candle displayed can be Bullish or Bearish Engulfing, Bullish or Bearish Harami, and so on. There are some free version now but almost that is repaint and lack off alert function. With this ve
LevelPAttern MT5 is a technical indicator based on the daily levels and Price Action patterns. The indicator is based on the standard ZigZag indicator + reversal candlestick pattens, such as Star, Hammer (also knows as Pin bar), Engulfing and others. The indicator generates audio and text notifications when a pattern is formed and a level is touched. It also supports sending email and push notifications. Indicator operation features It is suitable for working with any CFD and FOREX trading ins
Description : Rainbow EA MT5 is a simple Expert advisor based on   Rainbow MT5 indicator witch is based on Moving average with period 34. The indicator is incorporated in the EA, therefore, it is not required for the EA to operate, but if you wish, you can download it from   my product page . The Expert Advisor settings are as follows : Suitable for Timeframes up to H1 The parameters below can be set according to your trading rules. StopLoss ( Stop Loss in pips) TakeProfit ( Take Profit in pi
El indicador muestra patrones armónicos en el gráfico   sin repintar   con el mínimo retraso posible. La búsqueda de la parte superior de los indicadores se basa en el principio de onda del análisis de precios. La configuración avanzada le permite elegir parámetros para su estilo de negociación. En la apertura de una vela (barra), cuando se forma un nuevo patrón, se fija una flecha de la dirección probable del movimiento del precio, que permanece sin cambios. El indicador reconoce los siguientes
The Candlestick Patterns indicator for MT5 includes 12 types of candlestick signales in only one indicator. - DoubleTopsAndBottoms - SmallerGettingBars - BiggerGettingBars - ThreeBarsPlay - TwoBarsStrike - Hammers - InsideBars - OutsideBars - LongCandles - TwoGreenTwoRed Candles - ThreeGreenThreeRed Candles The indicator creats a arrow above or under the signal candle and a little character inside the candle to display the type of the signal. For long candles the indicator can display the exac
Candle hunter
Ruslan Khasanov
5 (1)
Indicador para análisis gráfico. Marca los principales patrones de velas japonesas en el gráfico. Por el momento, el siguiente conjunto de patrones está disponible para el comerciante:  - Bearish/Bullish Abandoned Baby;  - Bearish Advance Block;  - Bearish Deliberation;  - Bearish/Bullish Belt Hold;  - Bearish/Bullish Engulfing;  - Bearish Shooting Star;  - Bearish Evening Star;  - Bearish Evening Doji Star;  - Bearish/Bullish Doji Star;    - Bearish/Bullish Tri-Star;  - Bearish Hanging Man;  -
DYJ Super Trend Wave es un sistema de negociación de picos y valles altamente preciso. Este indicador busca los puntos más altos y más bajos de la línea de velas al entrar y salir del mercado. El precio de entrada está cerca del punto más alto o más bajo. El tipo de notificación de la señal se ha agregado a dyj supertrend. Cuando se genera una señal multi-espacial, Se pueden utilizar los siguientes tipos de señales de notificación: Alert mailSend, MobilePush. Input InpSignalPeriod = 10 Ba
Basing Candles
Abdelkhabir Yassine Alaoui
Basing Candles indicator is an automatic indicator that detects and marks basing candles on the chart. A basing candle is a candle with body length less than 50% of its high-low range. A basing candle or basing candlestick is a trading indicator whose body length is less than half of its range between the highs and lows. That's less than 50% of its range. The indicator highlights the basing candles using custom candles directly in the main chart of the platform. The percentage criterion can be
FREE
Owl Smart Levels MT5
Sergey Ermolov
4.43 (37)
Versión MT4  |  FAQ El Indicador Owl Smart Levels es un sistema comercial completo dentro de un indicador que incluye herramientas de análisis de mercado tan populares como los fractales avanzados de Bill Williams , Valable ZigZag que construye la estructura de onda correcta del mercado y los niveles de Fibonacci que marcan los niveles exactos de entrada. en el mercado y lugares para tomar ganancias. Descripción detallada de la estrategia Instrucciones para trabajar con el indicador Asesor de c
Candle Pattern Finder MT5
Pavel Zamoshnikov
4.33 (6)
This indicator searches for candlestick patterns. Its operation principle is based on Candlestick Charting Explained: Timeless Techniques for Trading Stocks and Futures by Gregory L. Morris. If a pattern is detected, the indicator displays a message at a bar closure. If you trade using the MetaTrader 4 terminal, then you can download the full analogue of the " Candle Pattern Finder for MT4 " indicator It recognizes the following patterns: Bullish/Bearish (possible settings in brackets) : Hamme
The   Three White Soldiers candlestick pattern   is formed by three candles. Here’s how to identify the Three White Soldiers candlestick pattern: Three consecutive bullish candles The bodies should be big The wicks should be small or non-existent This 3-candle bullish candlestick pattern is a reversal pattern, meaning that it’s used to find bottoms. For this reason, we want to see this pattern after a move to the downside, showing that bulls are starting to take control. When a Three White Sold
AW Candle Patterns
AW Trading Software Limited
El indicador de patrones de velas AW es una combinación de un indicador de tendencia avanzado combinado con un potente escáner de patrones de velas. Es una herramienta útil para reconocer y resaltar los treinta patrones de velas más fiables. Además, es un analizador de tendencias actual basado en barras de colores con un       panel de tendencias de múltiples marcos de tiempo que se puede cambiar de tamaño y posicionar. Una capacidad única para ajustar la visualización de patrones según el filtr
Liquidity Oscillator
Paolo Scopazzo
5 (1)
A powerful oscillator that provide Buy and Sell signals by calculating the investor liquidity. The more liquidity the more buy possibilities. The less liquidity the more sell possibilities. Please download the demo and run a backtest! HOW IT WORKS: The oscillator will put buy and sell arrow on the chart in runtime only . Top value is 95 to 100 -> Investors are ready to buy and you should follow. Bottom value is 5 to 0 -> Investors are ready to sell and you should follow. Alert + sound will app
This indicator looks for 3 rather strong patterns: Spinning Top pattern Hammer or Hanging Man Inverted Hammer or Shooting Star These patterns may indicate a trend continuation or its reversal, depending on the location of the patterns. Input parameters Zero - consider candles without a body Multiplier for hammerhigh - multiplier for the larger shadow of the Hammer Multiplier for hammerlow - multiplier for the smaller shadow of the Hammer Multiplier for wolf - multiplier for the shadows of the
Supply Demand Ranger
Krzysztof Janusz Stankiewic
5 (2)
The indicator draws supply and demand zones. The zone timeframe can be set independently of the chart timeframe. For instance, it is possible to set M5 zones on an H4 chart. The importance of zones can be adjusted using the zone strength parameter. Demand zones are displayed if at least one candle in the range of the zone is entirely above the zone. Similarly, supply zones are displayed if at least one candle within the zone is entirely below the zone.
This is the famous Sunflower indicator for Metatrader5. This indicator marks possible tops and bottoms on price charts. The indicator identifies tops and bottoms in the asset's price history, keep in mind that the current sunflower of the last candle repaints, as it is not possible to identify a top until the market reverses and it is also not possible to identify a bottom without the market stop falling and start rising. If you are looking for a professional programmer for Metatrader5, please
Introduction to Harmonic Volatility Indicator Harmonic Volatility Indicator is the first technical analysis applying the Fibonacci analysis to the financial volatility. Harmonic volatility indicator is another level of price action trading tool, which combines robust Fibonacci ratios (0.618, 0.382, etc.) with volatility. Originally, Harmonic Volatility Indicator was developed to overcome the limitation and the weakness of Gann’s Angle, also known as Gann’s Fan. We have demonstrated that Harmonic
Point Black
Ignacio Agustin Mene Franco
Pack Black Card indicador 5/1  Point black  cuenta con la estrategia de bollingers profesionales donde cada flecha te da una señal distinta de entrada .  sirve asta para operar en m1 y en d1  sirve para hacer scalping y intraday ,  modificado para los mercados de forex !  apto para todo los pares  modificado para los mercados de indices sinteticos apto para todo los pares !  Ideal para los volatilitys y jumps ! 
A machine translation from the English product description was used. We apologize for possible imprecisions. Se utilizó una traducción automática de la descripción del producto en inglés. Pedimos disculpas por posibles imprecisiones. Un sistema de visualización de patrones de acción de precios de velas japonesas favoritas. Una vez adjunto, el indicador marcará automáticamente los siguientes patrones en el gráfico: Barra de Pinocho (pinbar)  - una barra de cuerpo pequeño con una 'nariz' larga, un
El patrón 123 es uno de los patrones de gráficos más populares, potentes y flexibles. El patrón se compone de tres puntos de precio: un fondo, un pico o valle, y un retroceso de Fibonacci entre 38.2% y 71.8%. Un patrón se considera válido cuando el precio se rompe más allá del último pico o valle, momento en el que el indicador traza una flecha, levanta una alerta y se puede colocar el comercio. [ Guía de instalación | Guía de actualización | Solución de problemas | FAQ | Todos los productos ]
Indicator and Expert Adviser  EA Available in the comments section of this product. Download with Indicator must have indicator installed for EA to work. Mt5 indicator alerts for bollinger band and envelope extremes occurring at the same time. Buy signal alerts occur when A bullish candle has formed below both the lower bollinger band and the lower envelope  Bar must open and close below both these indicators. Sell signal occur when A bear bar is formed above the upper bollinger band and upp
The indicator automatically draws Wolfe waves. The indicator uses Wolfe waves found in three timeframes. This indicator is especially accurate because it waits for a breakout in the wave direction before signaling the trade. Recommended timeframe: М1. Indicator features Amazingly easy to trade. The indicator is able to recognize all the patterns of Wolfe waves in the specified period interval. It is a check of potential points 1,2,3,4,5 on every top, not only the tops of the zigzag. Finds the
PZ Trend Trading MT5
PZ TRADING SLU
3.67 (3)
Trend Trading es un indicador diseñado para sacar el máximo provecho posible de las tendencias que tienen lugar en el mercado, mediante el cronometraje de retrocesos y rupturas. Encuentra oportunidades comerciales al analizar qué está haciendo el precio durante las tendencias establecidas. [ Guía de instalación | Guía de actualización | Solución de problemas | FAQ | Todos los productos ] Opere en los mercados financieros con confianza y eficiencia Aproveche las tendencias establecidas sin s
Introduction Harmonic Patterns are best used to predict potential turning point. Traditionally, Harmonic Pattern was identified manually connecting peaks and troughs points in the chart. Manual harmonic pattern detection is painfully tedious and not suitable for everyone. You are often exposed under subjective pattern identification with manual pattern detection. To avoid these limitations, Harmonic Pattern Plus was designed to automate your harmonic pattern detection process. The functionality
Trend Monitor MT5
Pavel Zamoshnikov
3.67 (3)
The indicator generates early signals basing on ADX reading data combined with elements of price patterns. Works on all symbols and timeframes. The indicator does not redraw its signals. You see the same things on history and in real time. For better visual perception signals are displayed as arrows (in order not to overload the chart). Features The best results are obtained when the indicator works on two timeframes. For example: M30 – the indicator shows the main trend; M5 – the indicator ge
Los compradores de este producto también adquieren
Atomic Analyst MT5
Issam Kassas
5 (13)
En primer lugar, vale la pena enfatizar que este Indicador de Trading no repinta, no redibuja y no se retrasa, lo que lo hace ideal tanto para el trading manual como para el automatizado. Manual del usuario: configuraciones, entradas y estrategia. El Analista Atómico es un Indicador de Acción del Precio PA que utiliza la fuerza y el impulso del precio para encontrar una mejor ventaja en el mercado. Equipado con filtros avanzados que ayudan a eliminar ruidos y señales falsas, y aumentan el poten
Primero que todo, vale la pena enfatizar que este Sistema de Trading es un Indicador No Repintado, No Redibujado y No Retrasado, lo que lo hace ideal tanto para el trading manual como para el automatizado. Curso en línea, manual y descarga de ajustes preestablecidos. El "Sistema de Trading Inteligente MT5" es una solución completa de trading diseñada para traders nuevos y experimentados. Combina más de 10 indicadores premium y presenta más de 7 estrategias de trading robustas, lo que lo convie
Reversal First Impulse levels (RFI)      INSTRUCTIONS        RUS       -       ENG              R ecommended to use with an indicator   -   TREND PRO -  Version MT4                 A key element in trading is zones or levels from which decisions to buy or sell a trading instrument are made. Despite attempts by major players to conceal their presence in the market, they inevitably leave traces. Our task was to learn how to identify these traces and interpret them correctly. Main functions:: Di
Quantum Trend Sniper
Bogdan Ion Puscasu
5 (39)
Introduciendo       Indicador Quantum Trend Sniper   , el innovador indicador MQL5 que está transformando la forma en que identificas y negocias los cambios de tendencia. Desarrollado por un equipo de comerciantes experimentados con experiencia comercial de más de 13 años,       Indicador de francotirador de tendencia cuántica       está diseñado para impulsar su viaje comercial a nuevas alturas con su forma innovadora de identificar cambios de tendencia con una precisión extremadamente alta.
RelicusRoad Pro MT5
Relicus LLC
4.82 (22)
Ahora $ 147 (aumentando a $ 499 después de algunas actualizaciones) - Cuentas ilimitadas (PC o Mac) Manual de usuario de RelicusRoad + Videos de capacitación + Acceso al grupo privado de Discord + Estado VIP UNA NUEVA MANERA DE VER EL MERCADO RelicusRoad es el indicador comercial más poderoso del mundo para divisas, futuros, criptomonedas, acciones e índices, y brinda a los comerciantes toda la información y las herramientas que necesitan para mantenerse rentables. Brindamos análisis téc
TPSpro TRENDPRO  - is a trend indicator that automatically analyzes the market and provides information about the trend and each of its changes, as well as giving signals for entering trades without redrawing! The indicator uses each candle, analyzing them separately. referring to different impulses - up or down impulse. Exact entry points into transactions for currencies, crypto, metals, stocks, indices!  -  Version MT4               DETAILED DESCRIPTION               R ecommended to use with
IVISTscalp5
Vadym Zhukovskyi
5 (3)
Te presentamos el indicador iVISTscalp5, que no solo es único sino también efectivo en operaciones de trading. Este indicador se basa en datos temporales y es el resultado de muchos años de experiencia y análisis profundo de los mercados financieros. El indicador iVISTscalp5 es una excelente herramienta para el trading manual. La conveniencia, simplicidad y visualización, toda la complejidad está oculta en su interior. Hemos simplificado al máximo la configuración y uso del indicador iVISTscalp5
FX Volume MT5
Daniel Stein
4.94 (17)
Obtenga su actualización diaria del mercado con detalles y capturas de pantalla a través de nuestro Morning Briefing aquí en mql5 y en Telegram ! FX Volume es el PRIMER y ÚNICO indicador de volumen que proporciona una visión REAL del sentimiento del mercado desde el punto de vista de un bróker. Proporciona una visión impresionante de cómo los participantes institucionales del mercado, como los brokers, están posicionados en el mercado Forex, mucho más rápido que los informes COT. Ver esta info
Bill Williams Advanced
Siarhei Vashchylka
5 (5)
Bill Williams Advanced is designed for automatic chart analysis using Bill Williams' "Profitunity" system. The indicator analyzes four timeframes at once. Manual (Be sure to read before purchasing) Advantages 1. Automatically analyzes the chart using the "Profitunity" system of Bill Williams. The found signals are placed in a table in the corner of the screen. 2. Equipped with a trend filter based on the Alligator indicator. Most of the system signals are recommended to be used only accordi
ICT, SMC, SMART MONEY CONCEPTS, SMART MONEY, Smart Money Concept, Support and Resistance, Trend Analysis, Price Action, Market Structure, Order Blocks, BOS/CHoCH,   Breaker Blocks ,  Momentum Shift,   Supply&Demand Zone/Order Blocks , Strong Imbalance,   HH/LL/HL/LH,    Fair Value Gap, FVG,  Premium  &   Discount   Zones, Fibonacci Retracement, OTE, Buy Side Liquidity, Sell Side Liquidity, BSL/SSL Taken, Equal Highs & Lows, MTF Dashboard, Multiple Time Frame, BigBar, HTF OB, HTF Market Structure
Dragon Multi Indicator MT5
Mansour Babasafary
5 (3)
74% discount for the next 10 buyers (original price $605): 1 left Get a 50% bonus by buying (or even renting) any of our products. After buying (or renting), send a message for more information. 3 Indicators in 1 indicator Strategy based on price action Made specifically for the best forex currency pairs Can be used in the best time frame of the market at a very reasonable price This indicator is basically 3 different indicatos . But we have combined these 3 indicators in 1 indicator so th
Was: $249  Now: $99   Market Profile defines a number of day types that can help the trader to determine market behaviour. A key feature is the Value Area, representing the range of price action where 70% of trading took place. Understanding the Value Area can give traders valuable insight into market direction and establish the higher odds trade. It is an excellent addition to any system you may be using. Inspired by Jim Dalton’s book “Mind Over Markets”, this indicator is designed to suit the
Advanced Supply Demand MT5
Bernhard Schweigert
4.53 (15)
¡Actualmente con 33% de descuento! ¡La mejor solución para cualquier tráder principiante o experto! Este indicador es una herramienta comercial única, de alta calidad y asequible, porque incorpora una serie de características patentadas y una nueva fórmula. Con esta actualización, podrá mostrar zonas de doble marco temporal. No solo podrá mostrar un marco temporal más alto, sino también mostrar ambos, el marco temporal del gráfico MÁS el marco temporal más alto: MOSTRANDO ZONAS ANIDADAS. A todos
FxaccurateLS
Shiv Raj Kumawat
WHY IS OUR FXACCCURATE LS MT5 THE PROFITABLE ? PROTECT YOUR CAPITAL WITH RISK MANAGEMENT Gives entry, stop and target levels from time to time. It finds Trading opportunities by analyzing what the price is doing during established trends. POWERFUL INDICATOR FOR A RELIABLE STRATEGIES We have made these indicators with a lot of years of hard work. It is made at a very advanced level. Established trends provide dozens of trading opportunities, but most trend indicators completely ignore them!
Introduciendo       Quantum Breakout PRO   , el innovador indicador MQL5 que está transformando la forma en que comercia con Breakout Zones. Desarrollado por un equipo de comerciantes experimentados con experiencia comercial de más de 13 años,       Desglose cuántico PRO       está diseñado para impulsar su viaje comercial a nuevas alturas con su innovadora y dinámica estrategia de zona de ruptura. El indicador de ruptura cuántica le dará flechas de señal en las zonas de ruptura con 5 zonas
IX Power MT5
Daniel Stein
5 (3)
IX Power   lleva por fin la insuperable precisión de FX Power a los símbolos que no son de Forex. Determina con exactitud la intensidad de las tendencias a corto, medio y largo plazo de tus índices, acciones, materias primas, ETF e incluso criptodivisas favoritas. Puede   analizar todo lo   que su terminal le ofrece. Pruébalo y experimenta cómo   tu timing mejora significativamente   a la hora de operar. Características principales de IX Power Resultados de cálculo 100% precisos y sin rep
Gartley Hunter Multi
Siarhei Vashchylka
5 (6)
Gartley Hunter Multi - An indicator for searching for harmonic patterns simultaneously on dozens of trading instruments and on all classic timeframes: (m1, m5, m15, m30, H1, H4, D1, Wk, Mn). Manual (Be sure to read before purchasing) | Version for MT4 Advantages 1. Patterns: Gartley, Butterfly, Shark, Crab. Bat, Alternate Bat, Deep Crab, Cypher 2. Simultaneous search for patterns on dozens of trading instruments and on all classic timeframes 3. Search for patterns of all possible sizes. Fr
Black Dragon indicator mt5
Ramil Minniakhmetov
4.82 (57)
El indicador de detección de tendencias complementará cualquier estrategia y también se puede utilizar como una herramienta independiente. Ventajas Fácil de usar, no sobrecarga el gráfico con información innecesaria; Puede usarse como filtro para cualquier estrategia; Tiene niveles integrados de soporte y resistencia dinámicos, que se pueden usar tanto para obtener ganancias como para establecer límites de pérdidas; El indicador no cambia de color después de que se cierra la vela;  Funciona
Blahtech Supply Demand MT5
Blahtech Limited
4.57 (14)
Was: $299  Now: $99   Supply Demand uses previous price action to identify potential imbalances between buyers and sellers. The key is to identify the better odds zones, not just the untouched ones. Blahtech Supply Demand indicator delivers functionality previously unavailable on any trading platform. This 4-in-1 indicator not only highlights the higher probability zones using a multi-criteria strength engine, but also combines it with multi-timeframe trend analysis, previously confirmed swings
Golden Gate Algo MT5
James David Lane
4 (6)
¡40% DE DESCUENTO PARA NAVIDAD! ¡AUMENTO DE PRECIO A $250 EL 1 DE ENERO! Presentamos GoldenGate Entries: ¡Una Solución de Trading de Vanguardia! Descubre un enfoque revolucionario para el trading con GoldenGate Entries (GGE), un indicador avanzado diseñado para elevar tu experiencia de trading. GGE proporciona un conjunto completo de características para capacitar a los usuarios con precisión y confianza en sus decisiones comerciales. Pares: Cualquiera (FX - Materias primas - Acciones - A
Quantum Heiken Ashi PRO MT5
Bogdan Ion Puscasu
4.5 (8)
Presentamos el   Quantum Heiken Ashi PRO Diseñadas para brindar información clara sobre las tendencias del mercado, las velas Heiken Ashi son reconocidas por su capacidad para filtrar el ruido y eliminar las señales falsas. Diga adiós a las confusas fluctuaciones de precios y dé la bienvenida a una representación gráfica más fluida y confiable. Lo que hace que Quantum Heiken Ashi PRO sea realmente único es su fórmula innovadora, que transforma los datos de velas tradicionales en barras de colore
FX Power MT5 NG
Daniel Stein
5 (5)
Obtenga su actualización diaria del mercado con detalles y capturas de pantalla a través de nuestro Morning Briefing aquí en mql5 y en Telegram ! FX Power MT5 NG es la nueva generación de nuestro popular medidor de fuerza de divisas, FX Power. ¿Y qué ofrece este medidor de fuerza de nueva generación? Todo lo que le encantaba del FX Power original PLUS Análisis de fuerza de ORO/XAU Resultados de cálculo aún más precisos Períodos de análisis configurables individualmente Límite de cálculo persona
¡La mejor solución para cualquier operador novato o experto! Este indicador es una herramienta única, de alta calidad y asequible porque hemos incorporado una serie de características propias y una nueva fórmula. ¡Con sólo UN gráfico puede leer la Fuerza de la Divisa para 28 pares de Divisas! Imagínese cómo mejorará su operativa porque podrá señalar el punto exacto de activación de una nueva tendencia o de una oportunidad de scalping. Manual del usuario: haga   clic aquí Ese es el primero
Este es un genial indicador para MT5 que ofrece señales precisas para entrar en una transacción sin redibujar. Se puede aplicar a cualquier activo financiero: fórex, criptomonedas, metales, acciones, índices. Nos dará valoraciones bastante precisas y nos dirá cuándo es mejor abrir y cerra una transacción. Eche un vistazo  al vídeo  (6:22), ¡contiene un ejemplo de procesamiento de una sola señal que ha amortizado el indicador! La mayoría de los tráders mejoran sus resultados comerciales durante l
Fractal Advanced MT5
Siarhei Vashchylka
5 (3)
Fractal Advanced - displays Fractal and Alligator indicators on the price chart. Has wide options for settings and customization. It is also equipped with alerts and a hotkey system. Manual (Be sure to read before purchasing) | Version for MT4 Advantages 1. The indicator does not fill the entire chart with fractals, but allows you to display only relevant signals. 2. The number of fractals is adjusted by scrolling the mouse while holding down the Shift key. 3. Instantly show/hide the Alligator
The Price Action Finder Multi indicator is an indicator of entry points that searches for and displays Price Action system patterns on dozens of trading instruments and on all standard time frames: (m1, m5, m15, m30, H1, H4, D1, Wk, Mn). The indicator places the found patterns in a table at the bottom of the screen. By clicking on the pattern names in the table, you can move to the chart where this pattern is located. Manual (Be sure to read before purchasing) | Version for MT4 Advantages 1. Pa
Professional Scalping Tool on Deriv Attention! The indicator will be sold in limited quantities!!! The previous 5 copies were sold for $250 The remaining 4 copies will be sold for $350 The next price is $500 Description: This trading indicator is designed for professional traders focused on scalping. Designed with the market in mind, it provides highly accurate spike trading signals. It works on the M1 timeframe and supports the following symbols: Boom 300 Index, Boom 500 Index, Boom 1000 I
MetaForecast M5
Vahidreza Heidar Gholami
5 (2)
MetaForecast predice y visualiza el futuro de cualquier mercado basándose en las armonías de los datos de precios. Aunque el mercado no siempre es predecible, si existe un patrón en el precio, MetaForecast puede predecir el futuro con la mayor precisión posible. En comparación con otros productos similares, MetaForecast puede generar resultados más precisos al analizar las tendencias del mercado. Parámetros de entrada Past size (Tamaño del pasado) Especifica el número de barras que MetaForecas
TrendDecoder Premium MT5
Christophe Pa Trouillas
5 (2)
Identifique los rangos y los próximos movimientos probables  |  Obtenga las señales más tempranas y la fuerza de las Tendencias   |  Obtener salidas claras antes de reversión   |  Detecte los niveles de Fibo que el precio pondrá a prueba   |  Indicador no repintado y no retardado - ideal para la trading manual y automatizada - adecuado para todos los activos y todas las unidades temporales 69$   para el lanzamiento - luego de nuevo a >>   $ 149 Después de la compra,   póngase en contacto con mi
The Volume by Price Indicator for MetaTrader 5 features Volume Profile and Market Profile TPO (Time Price Opportunity). Volume and TPO histogram bar and line charts. Volume Footprint charts. TPO letter and block marker collapsed and split structure charts. Session filtering and grouping. Static, dynamic and flexible range segmentation and compositing methods with relative and absolute visualizations. Graphical layering, positioning and styling options to suit the user's analytic and aesthetic n
Otros productos de este autor
TTMM – "Time To Make Money" – Time When Traders Makes Money on the Stock Exchanges The ТТММ trade sessions indicator displays the following information: Trade sessions: American, European, Asian and Pacific. (Note: Sessions are displayed on the previous five days and the current day only. The number of days may change depending on the holidays - they are not displayed in the terminals. The sessions are also not displayed on Saturday and Sunday). The main trading hours of the stock exchanges (tim
ACPD – «Auto Candlestick Patterns Detected» - The indicator for automatic detection of candlestick patterns. The Indicator of Candlestick Patterns ACPD is Capable of: Determining 40 reversal candlestick patterns . Each signal is displayed with an arrow, direction of the arrow indicates the forecast direction of movement of the chart. Each caption of a pattern indicates: its name , the strength of the "S" signal (calculated in percentage terms using an empirical formula) that shows how close is t
AABB - Active Analyzer Bulls and Bears is created to indicate the state to what extent a candlestick is bullish or bearish. The indicator shows good results on EURUSD H4 chart with default settings. The Strategy of the Indicator When the indicator line crosses 80% level upwards, we buy. When the indicator line crosses 20% level downwards, we sell. It is important to buy or sell when a signal candlestick is formed. You should buy or sell on the first signal. It is not recommended to buy more as w
RBC Range Bar Chart is a classical range bar chart indicator. The indicator features price ranges for charting: High/Low price range is a classical option for analysis. It also has Open, High, Low and Close prices. In the first option, two price values are analyzed at the same time, while other options only use one price. Conventionally, range bars are drawn using tick data but since tick data is not available on the server, charting is only possible based on bar data from standard time frames.
Filtro:
No hay comentarios
Respuesta al comentario