MTF iFractals Support Resistance Indicator help
I figure out a method to do a MTF fractal but...still not perfect...
I see two problems:
1. it does not display the fractal in the native timeframe..So if I set the indicator to 1m, and place the indicator in a chart at M1..it does not show anything...but if I increase the TF of the indicator and place it in a lower resolution chart it display nicely the position on x and y of the fractal...
2. It will be nice to elongate the fractal until it is validated or crossover or under by the price... this will allow to display the two latest fractals on the latest candle. and show in this indicator HERE
Any thoughts?
#property indicator_chart_window
#property indicator_buffers 2
#property indicator_plots   2
//--- the FractalUp plot
#property indicator_label1  "FractalUp"
#property indicator_type1   DRAW_ARROW
#property indicator_color1  clrBlue
//--- the FractalDown plot
#property indicator_label2  "FractalDown"
#property indicator_type2   DRAW_ARROW
#property indicator_color2  clrRed
//+------------------------------------------------------------------+
//| Enumeration of the methods of handle creation                    |
//+------------------------------------------------------------------+

input ENUM_TIMEFRAMES      period=PERIOD_M1;        // timeframe
//--- indicator buffers
//--- variable for storing the handle of the iFractals indicator
int    handle;

//--- name of the indicator on a chart
string short_name;
//--- we will keep the number of values in the Fractals indicator
int    bars_calculated=0;

double         FractalUpBuffer[];
double         FractalDownBuffer[];
int      Shift;
//+------------------------------------------------------------------+
//| Custom indicator initialization function                         |
//+------------------------------------------------------------------+
int OnInit() {
    Shift= PeriodSeconds(period)/PeriodSeconds(Period());


   SetIndexBuffer(0,FractalUpBuffer,INDICATOR_DATA);
   SetIndexBuffer(1,FractalDownBuffer,INDICATOR_DATA);
//--- assignment of arrays to indicator buffers
//--- set codes using a symbol from the Wingdings charset for the PLOT_ARROW property
   PlotIndexSetInteger(0,PLOT_ARROW,217); // arrow up
   PlotIndexSetInteger(1,PLOT_ARROW,218); // arrow down

//--- determine the symbol the indicator is drawn for


//--- create handle of the indicator

   handle=iFractals(_Symbol,period);


   return(INIT_SUCCEEDED);
}
//+------------------------------------------------------------------+
//| Custom indicator iteration function                              |
//+------------------------------------------------------------------+
int OnCalculate(const int rates_total,
                const int prev_calculated,
                const datetime &time[],
                const double &open[],
                const double &high[],
                const double &low[],
                const double &close[],
                const long &tick_volume[],
                const long &volume[],
                const int &spread[]) {
//--- number of values copied from the iFractals indicator
   int values_to_copy;
//--- determine the number of values calculated in the indicator
   int calculated=BarsCalculated(handle);
   if(calculated<=0) {
      PrintFormat("BarsCalculated() returned %d, error code %d",calculated,GetLastError());
      return(0);
   }

//--- if it is the first start of calculation of the indicator or if the number of values in the iFractals indicator changed
//---or if it is necessary to calculated the indicator for two or more bars (it means something has changed in the price history)
   if(prev_calculated==0 || calculated!=bars_calculated || rates_total>prev_calculated+1) {
      //--- if the FractalUpBuffer array is greater than the number of values in the iFractals indicator for symbol/period, then we don't copy everything
      //--- otherwise, we copy less than the size of indicator buffers
      if(calculated>rates_total) values_to_copy=rates_total;
      else                       values_to_copy=calculated;
   } else {
      //--- it means that it's not the first time of the indicator calculation, and since the last call of OnCalculate()
      //--- for calculation not more than one bar is added
      values_to_copy=(rates_total-prev_calculated)+1;
   }


datetime times[];
      datetime startTime = time[0]-PeriodSeconds(period);
      datetime endTime   = time[rates_total-1];
         int bars = CopyTime(NULL,period,startTime,endTime,times);

         if (bars<2 || times[0]>time[0]) return(prev_calculated);
               double UpBuffer[]; CopyBuffer(handle,0,0,bars,UpBuffer);
               double DownBuffer[]; CopyBuffer(handle,1,0,bars,DownBuffer);


      for(int i=(int)MathMax(prev_calculated-Shift,0);i<rates_total;i++)
      {
         int d = dateArrayBsearch(times,time[i],bars);
         if (d > -1 && d < bars)
         {
         FractalUpBuffer[i]=UpBuffer[d];
         FractalDownBuffer[i]=DownBuffer[d];
         }
      }

   bars_calculated=calculated;
   return(rates_total);
}

//+------------------------------------------------------------------+
//| Indicator deinitialization function                              |
//+------------------------------------------------------------------+
void OnDeinit(const int reason) {
   if(handle!=INVALID_HANDLE)
      IndicatorRelease(handle);
//--- clear the chart after deleting the indicator
   Comment("");
}


int dateArrayBsearch(datetime& times[], datetime toFind, int total)
{
   int mid   = 0;
   int first = 0;
   int last  = total-1;

   while (last >= first)
   {
      mid = (first + last) >> 1;
      if (toFind == times[mid] || (mid < (total-1) && (toFind > times[mid]) && (toFind < times[mid+1]))) break;
      if (toFind <  times[mid])
            last  = mid - 1;
      else  first = mid + 1;
   }
   return (mid);
}

- www.mql5.com
I was able to modify the "Fractals.mq5" installed in MT5 to make it an MTF indicator.
I believe this method could be used for your plan as well.
//+------------------------------------------------------------------+
//|                                                     Fractals.mq5 |
//|                             Copyright 2000-2023, MetaQuotes Ltd. |
//|                                             https://www.mql5.com |
//+------------------------------------------------------------------+
#property copyright "Copyright 2000-2023, MetaQuotes Ltd."
#property link      "https://www.mql5.com"
//--- indicator settings
#property indicator_chart_window
#property indicator_buffers 2
#property indicator_plots   2
#property indicator_type1   DRAW_ARROW
#property indicator_type2   DRAW_ARROW
#property indicator_color1  Gray
#property indicator_color2  Gray
#property indicator_label1  "Fractal Up"
#property indicator_label2  "Fractal Down"
//--- input parameters
input  ENUM_TIMEFRAMES TimeFrame = PERIOD_H4;
//--- indicator buffers
double ExtUpperBuffer[];
double ExtLowerBuffer[];
//--- 10 pixels upper from high price
int    ExtArrowShift = -10;
//+------------------------------------------------------------------+
//| Custom indicator initialization function                         |
//+------------------------------------------------------------------+
void OnInit()
{
//--- indicator buffers mapping
   SetIndexBuffer(0, ExtUpperBuffer, INDICATOR_DATA);
   SetIndexBuffer(1, ExtLowerBuffer, INDICATOR_DATA);
   ArraySetAsSeries(ExtUpperBuffer, true);
   ArraySetAsSeries(ExtLowerBuffer, true);
   IndicatorSetInteger(INDICATOR_DIGITS, _Digits);
//--- sets first bar from what index will be drawn
   PlotIndexSetInteger(0, PLOT_ARROW, 217);
   PlotIndexSetInteger(1, PLOT_ARROW, 218);
//--- arrow shifts when drawing
   PlotIndexSetInteger(0, PLOT_ARROW_SHIFT, ExtArrowShift);
   PlotIndexSetInteger(1, PLOT_ARROW_SHIFT, -ExtArrowShift);
//--- sets drawing line empty value--
   PlotIndexSetDouble(0, PLOT_EMPTY_VALUE, EMPTY_VALUE);
   PlotIndexSetDouble(1, PLOT_EMPTY_VALUE, EMPTY_VALUE);
}
//+------------------------------------------------------------------+
//|  Fractals on 5 bars                                              |
//+------------------------------------------------------------------+
int OnCalculate(const int rates_total,
                const int prev_calculated,
                const datetime &time[],
                const double &open[],
                const double &high[],
                const double &low[],
                const double &close[],
                const long &tick_volume[],
                const long &volume[],
                const int &spread[])
{
   if(rates_total < 5)
      return(0);

   ArraySetAsSeries(time, true);

   int start;
//--- clean up arrays
   if(prev_calculated < 7)
   {
      start = rates_total - 3;
      ArrayInitialize(ExtUpperBuffer, EMPTY_VALUE);
      ArrayInitialize(ExtLowerBuffer, EMPTY_VALUE);
   }
   else
      start = 5;
//--- main cycle of calculations
   for(int i = start; i >= 3 && !IsStopped(); i--)
   {
      int y = iBarShift(_Symbol, TimeFrame, time[i]);

      //--- Upper Fractal
      if(iHigh(_Symbol, TimeFrame, y) > iHigh(_Symbol, TimeFrame, y + 1) && iHigh(_Symbol, TimeFrame, y) > iHigh(_Symbol, TimeFrame, y + 2) && iHigh(_Symbol, TimeFrame, y) >= iHigh(_Symbol, TimeFrame, y - 1) && iHigh(_Symbol, TimeFrame, y) >= iHigh(_Symbol, TimeFrame, y - 2))
         ExtUpperBuffer[i] = iHigh(_Symbol, TimeFrame, y);
      else
         ExtUpperBuffer[i] = EMPTY_VALUE;

      //--- Lower Fractal
      if(iLow(_Symbol, TimeFrame, y) < iLow(_Symbol, TimeFrame, y + 1) && iLow(_Symbol, TimeFrame, y) < iLow(_Symbol, TimeFrame, y + 2) && iLow(_Symbol, TimeFrame, y) <= iLow(_Symbol, TimeFrame, y - 1) && iLow(_Symbol, TimeFrame, y) <= iLow(_Symbol, TimeFrame, y - 2))
         ExtLowerBuffer[i] = iLow(_Symbol, TimeFrame, y);
      else
         ExtLowerBuffer[i] = EMPTY_VALUE;
   }
//--- OnCalculate done. Return new prev_calculated.
   return(rates_total);
}

//+------------------------------------------------------------------+
I was able to modify the "Fractals.mq5" installed in MT5 to make it an MTF indicator.
I believe this method could be used for your plan as well.
Thank for your help with this... I tested your code but it does not show anythng on lower TF...saying if you put the indicator in chart M1,...and set the indicator to TF = M30...the arraws are shown only on the last candle.... I am still learning this, but I think the code will need a loop to allowcade the value into the main buffers..
Thank for your help with this... I tested your code but it does not show anythng on lower TF...saying if you put the indicator in chart M1,...and set the indicator to TF = M30...the arraws are shown only on the last candle.... I am still learning this, but I think the code will need a loop to allowcade the value into the main buffers..
I have confirmed that it works reliably.

You are right... it also works for me in the GBPJPY M30..
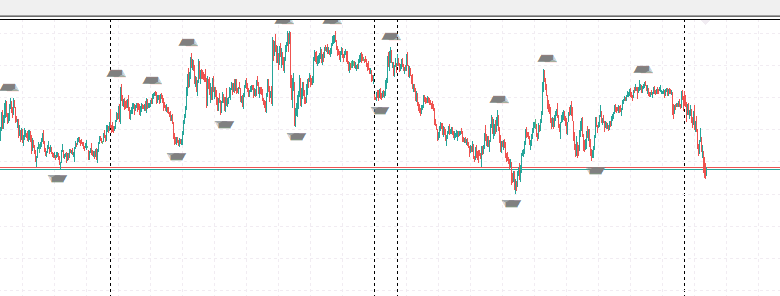
but If I use EURUSD M1 for the buffers show 0 and empty... only 1 arra appears in the last candle....what do you have the same behaviour if you use other pairs in your computer?....
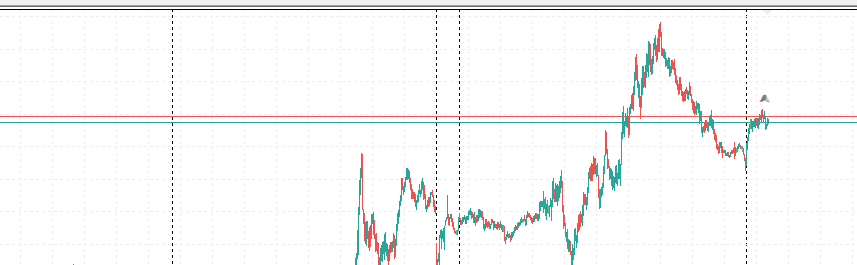
but If I use EURUSD M1 for the buffers show 0 and empty... only 1 arra appears in the last candle....what do you have the same behaviour if you use other pairs in your computer?....
It appears without any problem as well as "GBPJPY".
If you have never displayed the chart, the data may not be downloaded.
- Free trading apps
- Over 8,000 signals for copying
- Economic news for exploring financial markets
You agree to website policy and terms of use
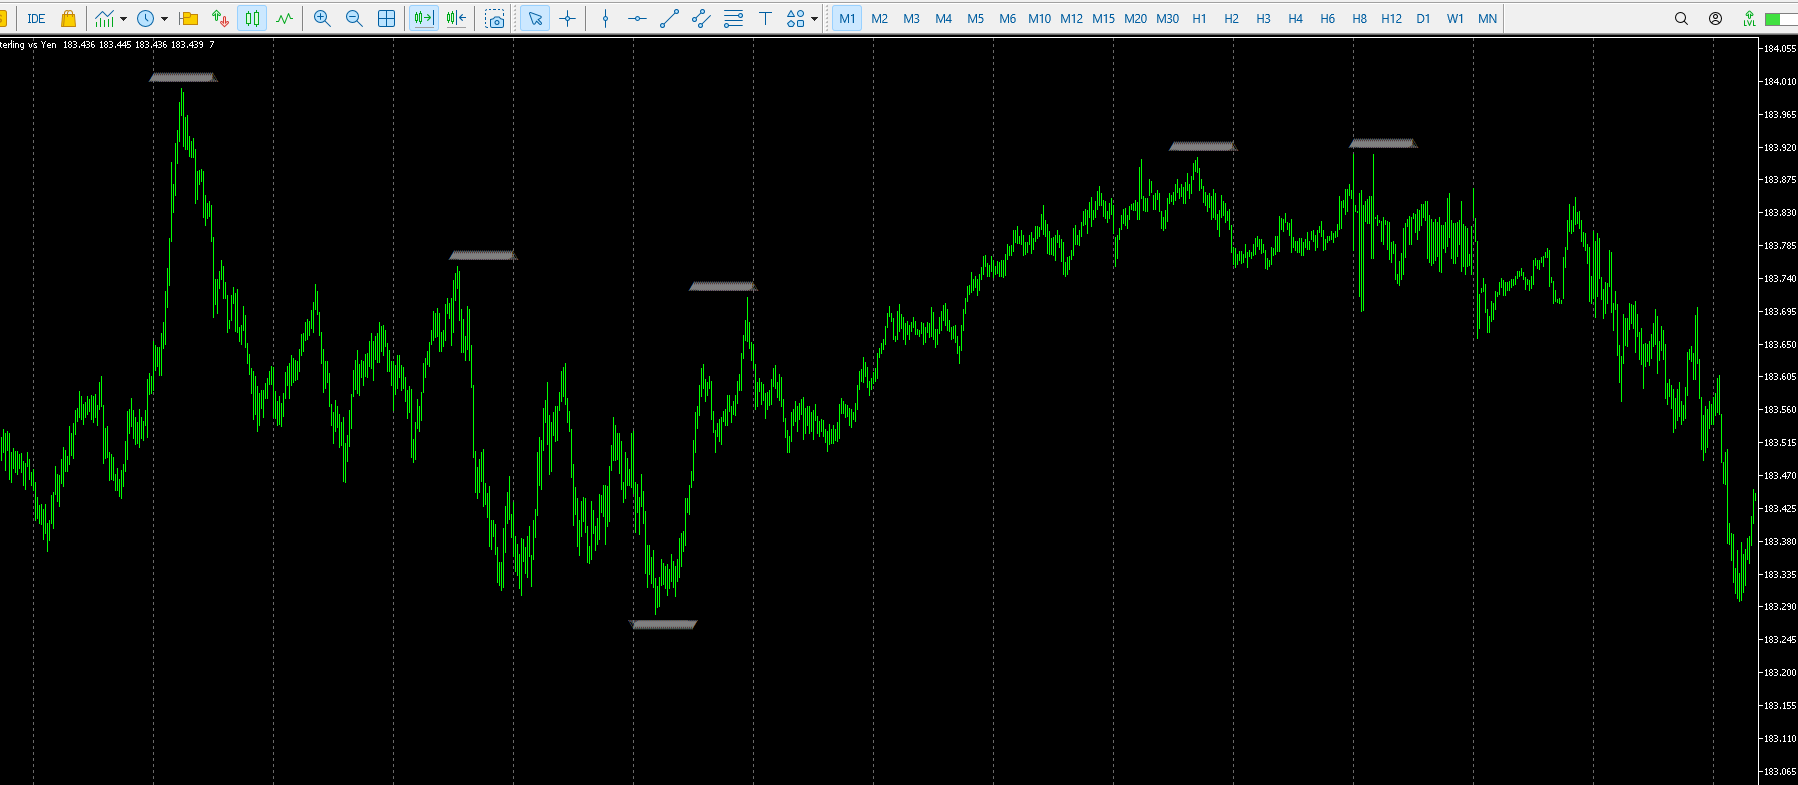
I found this very nice indicator for MQL4 that takes the iFractals indicator to different time frames. I found an excellent version for MQL5 HERE, which unfortunately does not include the option for different timeframes.
This appears to be a basic indicator, and I wonder if anyone has already a functional MQL5 version of MTF ifractals willing to share it?.... if not, I wonder if I can get some guidance on what I am doing wrong on my attempt below to convert that indicator to MQL5 while including different TF.
While the indicator displays the correct y-position of the fractal, it does not place it correctly in the X-axis. I am using shift for the purpose, but I guess that may be that is an incorrect use of that. ANy guidace? I can work on it, and report back..