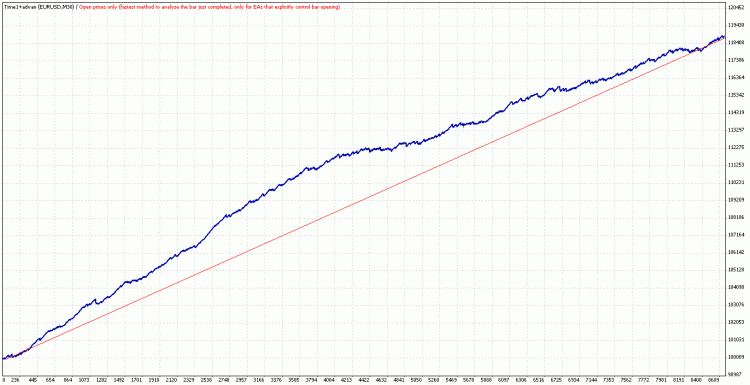
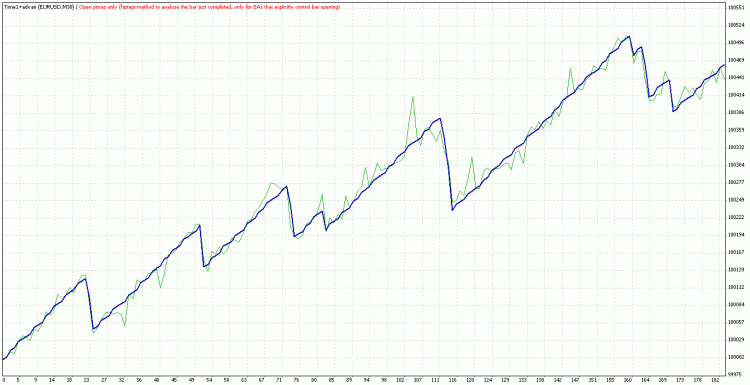
Both curves on the 1999-2010 section. M30 on bars. On m1 all ticks will be the same chart.
The first curve seems preferable as it fluctuates around a perfect straight line (red). HOWEVER, there is an idea. What if the second curve also fluctuates around an ideal straight line, but not over a period of several years, but over a much longer period? Especially since the curve (in the second figure) returns to the red line not by leaps, but by a sideways movement. Moreover, it is almost a perfect straight line in the growth periods, while in the first figure it is a very broken curve.
So the question is. Which is better? What are the criteria?
Here's a question. Which is better? What are the criteria?
Recovery Factor.
Thank you for your reply! What do you say on the curves which one you think is best.
| Symbol | EURUSD (Euro vs US Dollar) | ||||
| Period | 30 Minutes (M30) 1999.10.05 04:30 - 2010.11.19 22:59 | ||||
| Model | Open prices only (only for Expert Advisors that explicitly control bar opening) | ||||
| Bars in test | 137957 | Ticks modelled | 275774 | Modelling quality | n/a |
| Mismatched charts errors | 0 | ||||
| Initial deposit | 100000.00 | ||||
| Total net profit | 18831.67 | Gross profit | 47477.62 | Gross loss | -28645.95 |
| Profit factor | 1.66 | Expected payoff | 2.18 | ||
| Absolute drawdown | 62.00 | Maximal drawdown | 320.96 (0.28%) | Relative drawdown | 0.31% (319.00) |
| Total trades | 8655 | Short positions (won %) | 0 (0.00%) | Long positions (won %) | 8655 (92.77%) |
| Profit trades (% of total) | 8029 (92.77%) | Loss trades (% of total) | 626 (7.23%) | ||
| Largest | profit trade | 10.50 | loss trade | -65.20 | |
| Average | profit trade | 5.91 | loss trade | -45.76 | |
| Maximum | consecutive wins (profit in money) | 146 (872.04) | consecutive losses (loss in money) | 4 (-195.00) | |
| Maximal | consecutive profit (count of wins) | 872.04 (146) | consecutive loss (count of losses) | -195.00 (4) | |
| Average | consecutive wins | 17 | consecutive losses | 1 | |
None. You have to look at the equity curve.
I open all my trades with TP and SL. Few trades live for three days.
I open all my trades with TP and SL. Few of them live for three days.
- Free trading apps
- Over 8,000 signals for copying
- Economic news for exploring financial markets
You agree to website policy and terms of use


The same EA, with different parameters, produces different curves. Two questions in this regard.
1. I can't decide which one is better.
2. Which balance curve is ideal in REAL EA.