Articles on the MQL5 programming and use of technical indicators
Technical indicators constitute an important part of trading, and every trader tries to find something new. The authors of these articles talk about econometrics and machine learning, automatic marking of Elliott Waves and digital filters - everything from the classical methods of analysis to the modern interpretation of classical ideas.
The category features articles that will teach you how to develop a custom indicator and contains unique collections of ready-to-use mathematically explained William Blau's trading ideas.
Add a new article

You are missing trading opportunities:
- Free trading apps
- Over 8,000 signals for copying
- Economic news for exploring financial markets
Registration
Log in
You agree to website policy and terms of use
If you do not have an account, please register
Learn how to design a trading system by Accelerator Oscillator
A new article from our series about how to create simple trading systems by the most popular technical indicators. We will learn about a new one which is the Accelerator Oscillator indicator and we will learn how to design a trading system using it.

Learn how to design a trading system by Awesome Oscillator
In this new article in our series, we will learn about a new technical tool that may be useful in our trading. It is the Awesome Oscillator (AO) indicator. We will learn how to design a trading system by this indicator.
Learn how to design a trading system by Relative Vigor Index
A new article in our series about how to design a trading system by the most popular technical indicator. In this article, we will learn how to do that by the Relative Vigor Index indicator.

CCI indicator. Upgrade and new features
In this article, I will consider the possibility of upgrading the CCI indicator. Besides, I will present a modification of the indicator.

Learn how to design a trading system by DeMarker
Here is a new article in our series about how to design a trading system by the most popular technical indicators. In this article, we will present how to create a trading system by the DeMarker indicator.

Learn how to design a trading system by VIDYA
Welcome to a new article from our series about learning how to design a trading system by the most popular technical indicators, in this article we will learn about a new technical tool and learn how to design a trading system by Variable Index Dynamic Average (VIDYA).

Learn how to design a trading system by Bull's Power
Welcome to a new article in our series about learning how to design a trading system by the most popular technical indicator as we will learn in this article about a new technical indicator and how we can design a trading system by it and this indicator is the Bull's Power indicator.

Learn how to design a trading system by Bear's Power
Welcome to a new article in our series about learning how to design a trading system by the most popular technical indicator here is a new article about learning how to design a trading system by Bear's Power technical indicator.

Learn how to design a trading system by Force Index
Welcome to a new article in our series about how to design a trading system by the most popular technical indicators. In this article, we will learn about a new technical indicator and how to create a trading system using the Force Index indicator.

Complex indicators made easy using objects
This article provides a method to create complex indicators while also avoiding the problems that arise when dealing with multiple plots, buffers and/or combining data from multiple sources.
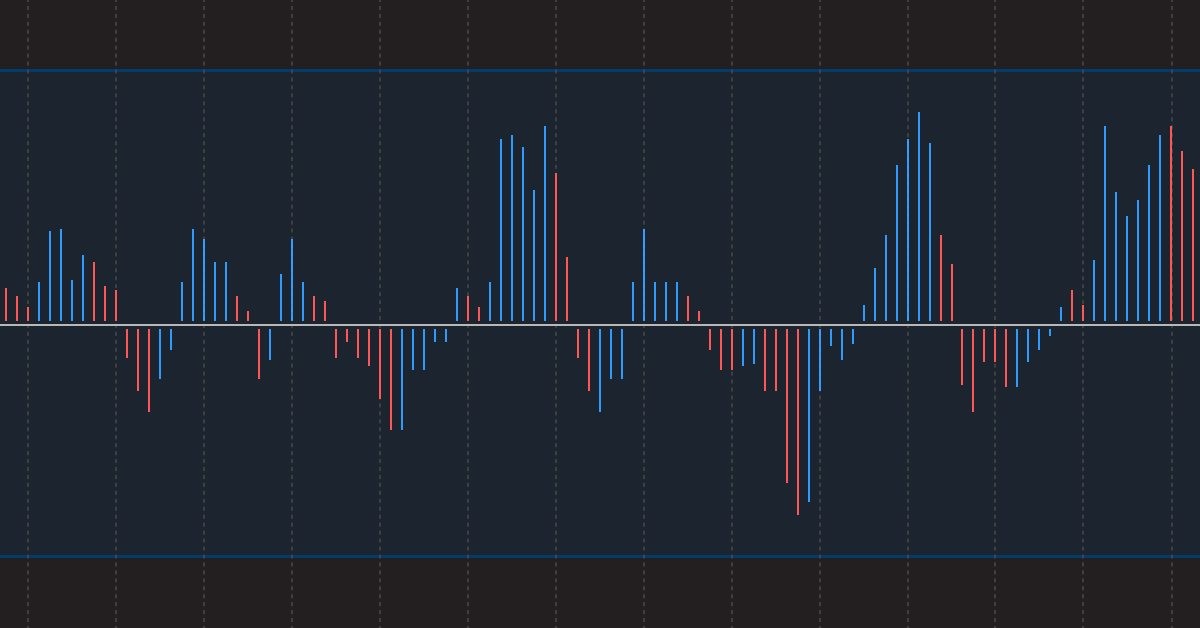
Learn how to design a trading system by Chaikin Oscillator
Welcome to our new article from our series about learning how to design a trading system by the most popular technical indicator. Through this new article, we will learn how to design a trading system by the Chaikin Oscillator indicator.

Developing a trading Expert Advisor from scratch (Part 16): Accessing data on the web (II)
Knowing how to input data from the Web into an Expert Advisor is not so obvious. It is not so easy to do without understanding all the possibilities offered by MetaTrader 5.
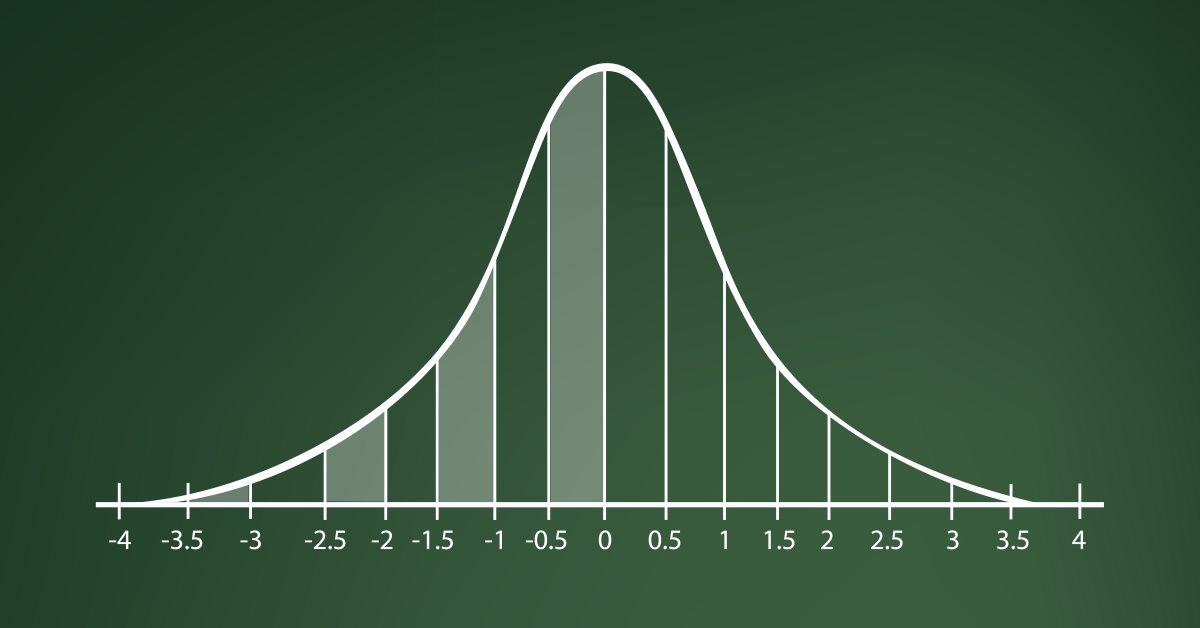
Learn how to design a trading system by Standard Deviation
Here is a new article in our series about how to design a trading system by the most popular technical indicators in MetaTrader 5 trading platform. In this new article, we will learn how to design a trading system by Standard Deviation indicator.

Developing a trading Expert Advisor from scratch (Part 15): Accessing data on the web (I)
How to access online data via MetaTrader 5? There are a lot of websites and places on the web, featuring a huge amount information. What you need to know is where to look and how best to use this information.

Developing a trading Expert Advisor from scratch (Part 14): Adding Volume At Price (II)
Today we will add some more resources to our EA. This interesting article can provide some new ideas and methods of presenting information. At the same time, it can assist in fixing minor flaws in your projects.
Learn how to design a trading system by Williams PR
A new article in our series about learning how to design a trading system by the most popular technical indicators by MQL5 to be used in the MetaTrader 5. In this article, we will learn how to design a trading system by the Williams' %R indicator.

Developing a trading Expert Advisor from scratch (Part 13): Time and Trade (II)
Today we will construct the second part of the Times & Trade system for market analysis. In the previous article "Times & Trade (I)" we discussed an alternative chart organization system, which would allow having an indicator for the quickest possible interpretation of deals executed in the market.

Developing a trading Expert Advisor from scratch (Part 12): Times and Trade (I)
Today we will create Times & Trade with fast interpretation to read the order flow. It is the first part in which we will build the system. In the next article, we will complete the system with the missing information. To implement this new functionality, we will need to add several new things to the code of our Expert Advisor.

Developing a trading Expert Advisor from scratch (Part 10): Accessing custom indicators
How to access custom indicators directly in an Expert Advisor? A trading EA can be truly useful only if it can use custom indicators; otherwise, it is just a set of codes and instructions.

Developing a trading Expert Advisor from scratch (Part 9): A conceptual leap (II)
In this article, we will place Chart Trade in a floating window. In the previous part, we created a basic system which enables the use of templates within a floating window.
Learn how to design a trading system by Ichimoku
Here is a new article in our series about how to design a trading system b the most popular indicators, we will talk about the Ichimoku indicator in detail and how to design a trading system by this indicator.

Developing a trading Expert Advisor from scratch (Part 8): A conceptual leap
What is the easiest way to implement new functionality? In this article, we will take one step back and then two steps forward.
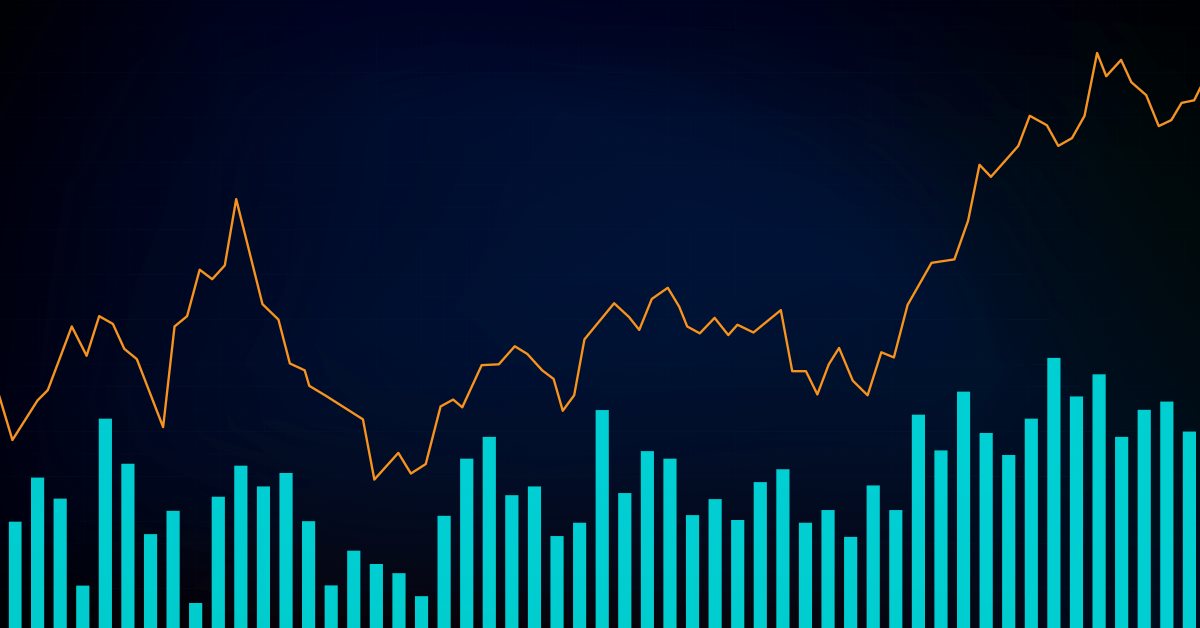
Learn how to design a trading system by Volumes
Here is a new article from our series about learning how to design a trading system based on the most popular technical indicators. The current article will be devoted to the Volumes indicator. Volume as a concept is one of the very important factors in financial markets trading and we have to pay attention to it. Through this article, we will learn how to design a simple trading system by Volumes indicator.

Learn how to design a trading system by MFI
The new article from our series about designing a trading system based on the most popular technical indicators considers a new technical indicator - the Money Flow Index (MFI). We will learn it in detail and develop a simple trading system by means of MQL5 to execute it in MetaTrader 5.
Learn how to design a trading system by Accumulation/Distribution (AD)
Welcome to the new article from our series about learning how to design trading systems based on the most popular technical indicators. In this article, we will learn about a new technical indicator called Accumulation/Distribution indicator and find out how to design an MQL5 trading system based on simple AD trading strategies.
Learn how to design a trading system by OBV
This is a new article to continue our series for beginners about how to design a trading system based on some of the popular indicators. We will learn a new indicator that is On Balance Volume (OBV), and we will learn how we can use it and design a trading system based on it.

Learn how to design a trading system by Parabolic SAR
In this article, we will continue our series about how to design a trading system using the most popular indicators. In this article, we will learn about the Parabolic SAR indicator in detail and how we can design a trading system to be used in MetaTrader 5 using some simple strategies.

Multiple indicators on one chart (Part 04): Advancing to an Expert Advisor
In my previous articles, I have explained how to create an indicator with multiple subwindows, which becomes interesting when using custom indicators. This time we will see how to add multiple windows to an Expert Advisor.

Learn how to design a trading system by ATR
In this article, we will learn a new technical tool that can be used in trading, as a continuation within the series in which we learn how to design simple trading systems. This time we will work with another popular technical indicator: Average True Range (ATR).

Multiple indicators on one chart (Part 03): Developing definitions for users
Today we will update the functionality of the indicator system for the first time. In the previous article within the "Multiple indicators on one chart" we considered the basic code which allows using more than one indicator in a chart subwindow. But what was presented was just the starting base of a much larger system.
Multiple indicators on one chart (Part 02): First experiments
In the previous article "Multiple indicators on one chart" I presented the concept and the basics of how to use multiple indicators on one chart. In this article, I will provide the source code and will explain it in detail.


Learn how to design a trading system by ADX
In this article, we will continue our series about designing a trading system using the most popular indicators and we will talk about the average directional index (ADX) indicator. We will learn this indicator in detail to understand it well and we will learn how we to use it through a simple strategy. By learning something deeply we can get more insights and we can use it better.

Learn how to design a trading system by Stochastic
In this article, we continue our learning series — this time we will learn how to design a trading system using one of the most popular and useful indicators, which is the Stochastic Oscillator indicator, to build a new block in our knowledge of basics.

Learn how to design a trading system by MACD
In this article, we will learn a new tool from our series: we will learn how to design a trading system based on one of the most popular technical indicators Moving Average Convergence Divergence (MACD).
Multiple indicators on one chart (Part 01): Understanding the concepts
Today we will learn how to add multiple indicators running simultaneously on one chart, but without occupying a separate area on it. Many traders feel more confident if they monitor multiple indicators at a time (for example, RSI, STOCASTIC, MACD, ADX and some others), or in some cases even at different assets which an index is made of.

Learn how to design a trading system by CCI
In this new article from our series for learning how to design trading systems, I will present the Commodities Channel Index (CCI), explain its specifics, and share with you how to create a trading system based on this indicator.

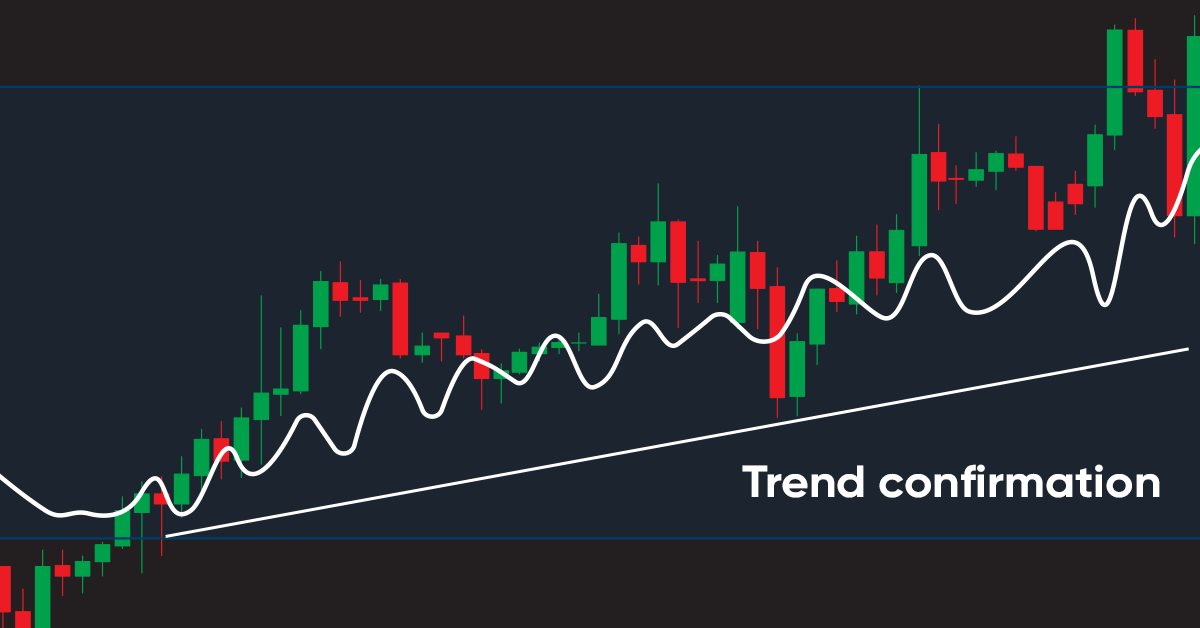
Learn how to design a trading system by Momentum
In my previous article, I mentioned the importance of identifying the trend which is the direction of prices. In this article I will share one of the most important concepts and indicators which is the Momentum indicator. I will share how to design a trading system based on this Momentum indicator.

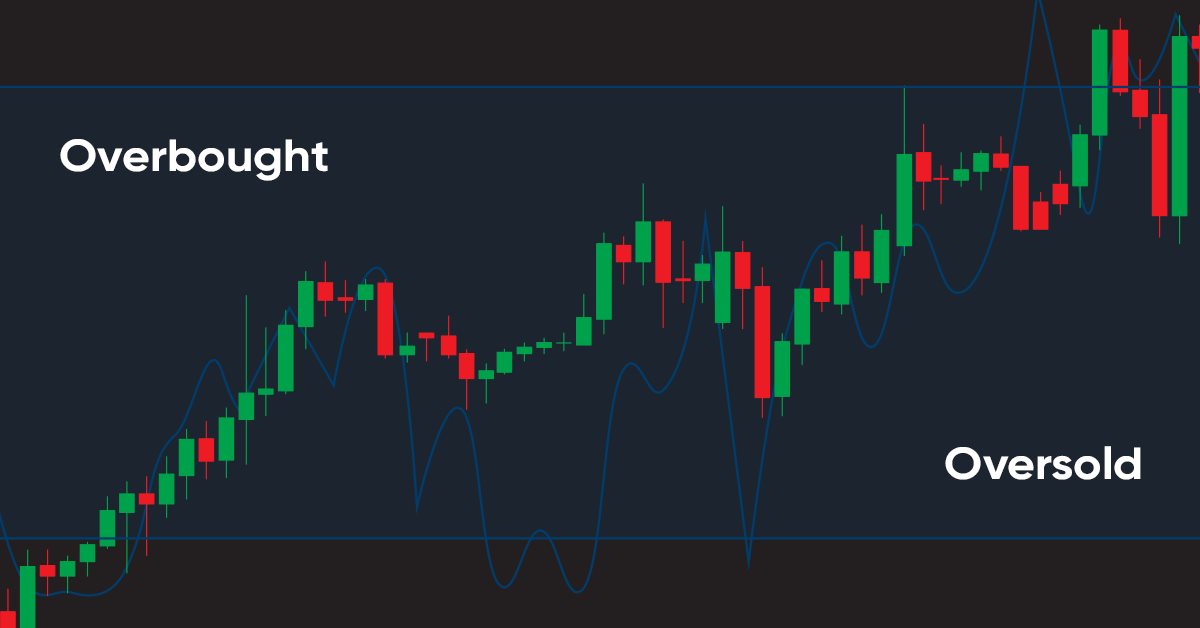
Learn how to design a trading system by RSI
In this article, I will share with you one of the most popular and commonly used indicators in the world of trading which is RSI. You will learn how to design a trading system using this indicator.

Learn how to design a trading system by Envelopes
In this article, I will share with you one of the methods of how to trade bands. This time we will consider Envelopes and will see how easy it is to create some strategies based on the Envelopes.

Learn how to design a trading system by Bollinger Bands
In this article, we will learn about Bollinger Bands which is one of the most popular indicators in the trading world. We will consider technical analysis and see how to design an algorithmic trading system based on the Bollinger Bands indicator.