
Complex indicators made easy using objects

1. Introduction
If you have ever tried creating or modifying a complex indicator, you may know some of the problems that arise when increasing the amount of buffers: you will need to declare tons of double arrays for the buffers, set them as buffers, configure all of them...
Then come the plots: you have to declare which type of plots you are using, configure all of its properties, and then make sure that everything fits correctly and that you have declared the correct amount of buffers and plots (if there are less, then you would get an Array Out Of Range error or an invisible plot, until you notice).
Finally comes dealing with the data of the buffers: if you want to combine data from a big amount of buffers (for example, getting the average/maximum/minimum of 10 buffers into another one) then you'll need to write very long lines of repeated code comparing/combining each buffer one by one, or rely on some clever tricks with macros or functions to save some space. The result is probably the same: a very complex mess prone to bugs with tons of lines and repeated functionality. If you have made one typo anywhere, it would be a nightmare to detect it and correct it!
These types of situations may hold back beginners (and even advanced programmers) when making complex indicators either in functionality or visually. However, there is a small trick that is not apparent to everyone that could make your coding of indicators faster and easier:
You can set as buffers arrays that are contained inside of objects
In this article, we'll explore the options that this trick will give us and come with solutions to be able to apply this trick in any other situation using Object Oriented Programming.
2. The first example
Before we start making the indicator, let's see what the most basic form of the object that will contain the buffer arrays looks like:
class CIndicatorPlot
{
public:
   double            array[];
};
It only has a public array. For now it is important for it to be public so that we can access it when setting it as a buffer or setting/accessing the data it will have (as with any other indicator).
Now let's get with the indicator: to apply some of the concepts, we'll create an indicator which will display 10 RSI with different periods and its average. We will start with the properties, inputs and OnInit function.
#property indicator_buffers 11
#property indicator_plots 11

input int firstPeriod = 6;
input int increment = 2;

CIndicatorPlot indicators[];
int handles[];
//+------------------------------------------------------------------+
//| Custom indicator initialization function                         |
//+------------------------------------------------------------------+
int OnInit()
{

   ArrayResize(indicators, 11);
//--- indicator buffers mapping

   for (int i=0; i<11; i++)
   {
      SetIndexBuffer(i, indicators[i].array, INDICATOR_DATA);
      PlotIndexSetInteger(i, PLOT_DRAW_TYPE, DRAW_LINE);
   }

   for (int i=0; i<10; i++)
      PlotIndexSetInteger(i, PLOT_LINE_COLOR, clrRed);


   PlotIndexSetInteger(10, PLOT_LINE_COLOR, clrCyan);
   PlotIndexSetInteger(10, PLOT_LINE_STYLE, STYLE_DASH);
   PlotIndexSetInteger(10, PLOT_LINE_WIDTH, 2);

   ArrayResize(handles, 10);
   for (int i=0; i<10; i++)
      handles[i] = iRSI(NULL, PERIOD_CURRENT, firstPeriod+i*increment, PRICE_CLOSE);


//---
   return(INIT_SUCCEEDED);
}
Notice that we have only used 2 properties: indicator_buffers and indicator_plots. Apart from the common ones (copyright, link, version, separate/chart window...) those 2 will always be needed. The other properties (line color, draw type...) are optional, but to have a more compact code we will configure them with PlotIndexSetInteger in a loop.
For this indicator we will need 10 buffers for each RSI with different period and one more for their average. We will put all of them inside of an array. Also we create the indicator handles in OnInit.
Now, a few calculations and data copying...
//+------------------------------------------------------------------+
//| Custom indicator iteration function                              |
//+------------------------------------------------------------------+
int OnCalculate(const int rates_total,
                const int prev_calculated,
                const datetime &time[],
                const double &open[],
                const double &high[],
                const double &low[],
                const double &close[],
                const long &tick_volume[],
                const long &volume[],
                const int &spread[])
{
//---
   int limit = MathMax(0, prev_calculated-1);

   for (int i=0; i<10; i++)
   {
      if (limit==0)
         CopyBuffer(handles[i], 0, 0, rates_total-limit, indicators[i].array);
      else
      {
         double newValues[];
         CopyBuffer(handles[i], 0, 0, rates_total-limit, newValues);

         for (int k=0; k<rates_total-limit; k++)
         {
            indicators[i].array[limit+k] = newValues[k];
         }
      }
   }

   for (int i=limit; i<rates_total; i++)
   {
      indicators[10].array[i] = 0.0;
      for (int j=0; j<10; j++)
         indicators[10].array[i] +=indicators[j].array[i];

      indicators[10].array[i]/=10.0;
   }


//--- return value of prev_calculated for next call
   return(rates_total);
}
Notice that calculating the average from all buffers is now as easy as doing a loop. If every buffer was declared in global scope as a double array (as usual), adding them up would not be as easy or done in as few lines.
Lastly, do not forget to release the handles...
//+------------------------------------------------------------------+
//| Custom indicator deinitialization function                       |
//+------------------------------------------------------------------+
void OnDeinit(const int reason)
{
   for (int i=0; i<10; i++)
      IndicatorRelease(handles[i]);
}
//+------------------------------------------------------------------+
And this is our final result:
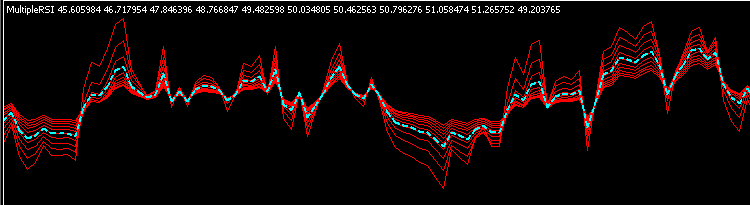
Not too bad for how long the code is, but there is some room to improve as we will see in the following section.
3. Adding more options
Even though we saved some space using this class and configuring properties on initialization (instead of #property), we still had to configure manually the buffers and the plots, and not every time that would result to be as easy. Isn't there any more effective way to do this? The answer is yes, and we do that by delegating functionality to the class.
First, we will add some extra functions to the class that we will need later.
class CIndicatorPlot
{
private:
   int               indicator_plot;

public:
   double            array[];

   void              SetBuffer(int &buffer, int &plot);
   void              SetLineWidth(int width);
   void              SetLineStyle(ENUM_LINE_STYLE style);
   void              SetLineColor(color line_color);
   void              SetLabel(string label);
};
The SetBuffer function will set the indicator buffer and plot. With two variables passed by reference, the changes that one object does to them will reflect in the next calls by other objects. The plot index is saved to set other properties.
The rest of set functions are simple plot property setters.
//+------------------------------------------------------------------+
void CIndicatorPlot::SetBuffer(int &buffer,int &plot)
{
   indicator_plot = plot;

   SetIndexBuffer(buffer, array, INDICATOR_DATA);
   PlotIndexSetInteger(indicator_plot, PLOT_DRAW_TYPE, DRAW_LINE);

   buffer++; //Increment for other steps (One buffer in this case)
   plot++;   //Increment one plot in any case
}

//+------------------------------------------------------------------+
void CIndicatorPlot::SetLineWidth(int width)
{
   PlotIndexSetInteger(indicator_plot, PLOT_LINE_WIDTH, width);
}

//---
//...
To help adding some visual interest in the indicator, we will also create a function to interpolate colors which we will use later:
//+------------------------------------------------------------------+
//| Function to linearly interpolate 2 colors                        |
//+------------------------------------------------------------------+
color InterpolateColors(color colorA, color colorB, double factor)
{
   if (factor<=0.0) return colorA;
   if (factor>=1.0) return colorB;

   int result = 0;

   for (int i=0; i<3; i++) //R-G-B
   {
      int subcolor = int(
                        ((colorA>>(8*i))&(0xFF))*(1.0-factor) +
                        ((colorB>>(8*i))&(0xFF))*factor
                     );

      subcolor = subcolor>0xFF?0xFF:(
                    subcolor<0x00?0x00:
                    subcolor);

      result |= subcolor<<(8*i);
   }
   return (color)result;
}
Now the OnInit function looks like this:
CIndicatorPlot* indicators[];
CIndicatorPlot average;
int handles[];
//+------------------------------------------------------------------+
//| Custom indicator initialization function                         |
//+------------------------------------------------------------------+
int OnInit()
{
//--- indicator buffers mapping
   ArrayResize(indicators, 10);
   ArrayResize(handles, 10);


   int index=0, plot=0;

   for (int i=0; i<10; i++)
   {
        indicators[i] = new CIndicatorPlot();

      indicators[i].SetBuffer(index, plot);
      indicators[i].SetLineColor(InterpolateColors(clrYellow, clrRed, i/9.0));
      indicators[i].SetLabel("RSI ("+IntegerToString(firstPeriod+i*increment)+")");

      handles[i] = iRSI(NULL, PERIOD_CURRENT, firstPeriod+i*increment, PRICE_CLOSE);
   }

   average.SetBuffer(index, plot);
   average.SetLineColor(clrBlue);
   average.SetLineStyle(STYLE_DASH);
   average.SetLineWidth(2);
   average.SetLabel("Average");

//---
   return(INIT_SUCCEEDED);
}
Notice that nowhere we referred to any buffer or plot by its number: the classes handled that problem. Now it's easier to set correctly any plot property or to change the order of the buffers since we can refer to them with an object instead of an index. We also took the opportunity to add some colors and labels to the plots.
In this example we changed also the indicator structure using an array of pointers for the RSIs (to prove that it is also possible to use dinamically created objects) and separating the average from the array. Because of that, we need to change the average references in OnCalculate and delete the indicators in the array of pointers in OnDeInit.
void OnDeinit(const int reason)
{
   for (int i=0; i<10; i++)
      IndicatorRelease(handles[i]);
   for (int i=0; i<10; i++)
        delete indicators[i];
}
Now it looks like this:
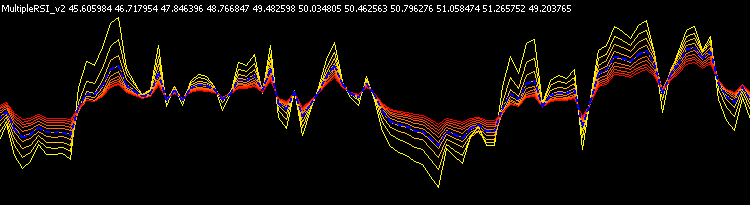
The only visual change is in the colors (and the labels in the data window). Internally we improved our workflow by making easier dealing with the plots and buffers, but there is still more room to improve its organization inside.
If you take a closer look, you will see that each handle is only used by one of the buffers: each RSI buffer can be calculated independently so we could make the class do that inside (instead of having the calculations directly in OnCalculate). The average needs to access the rest of buffers but those calculations can also be delegated to the class. We can use inheritance to add specific functionality without changing the functions or adding conditionals in the base class.
First, we will add virtual empty event handlers to the base class:
class CIndicatorPlot
{
   //...

public:

   //...

   virtual void      Init() { }
   virtual void      DeInit() { }
   virtual void      Update(const int start, const int rates_total) { }
};
As seen before in this example, Update only needs the start and rates_total to perform its calculations, so the rest of values are ommited.
Now we will make the Individual RSI class. It can create and delete the needed handle. Also, we included a function to set the period of that handle, but it is also possible to include that parameter in Init().
class CRSIIndividual : public CIndicatorPlot
{
private:
   int               handle;
   int               rsi_period;

public:

   void              SetPeriodRSI(int period);

   virtual void      Init();
   virtual void      DeInit();
   virtual void      Update(const int start, const int rates_total);
};

//+------------------------------------------------------------------+
void CRSIIndividual::SetPeriodRSI(int period)
{
   rsi_period = period;
}

//+------------------------------------------------------------------+
void CRSIIndividual::Init(void)
{
   handle = iRSI(NULL, PERIOD_CURRENT, rsi_period, PRICE_CLOSE);
}

//+------------------------------------------------------------------+
void CRSIIndividual::Update(const int start,const int rates_total)
{
   if (start==0)
      CopyBuffer(handle, 0, 0, rates_total-start, array);
   else
   {
      double newValues[];
      CopyBuffer(handle, 0, 0, rates_total-start, newValues);

      for (int k=0; k<rates_total-start; k++)
      {
         array[start+k] = newValues[k];
      }
   }
}

//+------------------------------------------------------------------+
void CRSIIndividual::DeInit(void)
{
   IndicatorRelease(handle);
}
For the Average class we need to store pointers to access the rest of indicator plot objects (the individual RSI). In this case, Init() and DeInit() are not needed.
class CRSIAverage : public CIndicatorPlot
{
private:
   CRSIIndividual*   rsi_indicators[];

public:
   void              SetRSIPointers(const CRSIIndividual &rsi_objects[]);

   virtual void      Update(const int start, const int rates_total);
};

//+------------------------------------------------------------------+
void CRSIAverage::SetRSIPointers(const CRSIIndividual &rsi_objects[])
{
   int total = ArraySize(rsi_objects);
   ArrayResize(rsi_indicators, total);

   for (int i=0; i<total; i++)
      rsi_indicators[i] = (CRSIIndividual*)GetPointer(rsi_objects[i]);
}

//+------------------------------------------------------------------+
void CRSIAverage::Update(const int start,const int rates_total)
{
   for (int i=start; i<rates_total; i++)
   {
      array[i] = 0.0;
      for (int j=0; j<10; j++)
         array[i] +=rsi_indicators[j].array[i];

      array[i]/=10.0;
   }
}
Creating an array of pointers may feel like overcomplicating the problem when you could access the objects directly from global scope, but this will make it easier to reuse the class in other indicators without doing more changes. Notice also that in this example we will use again an array of objects instead of pointers for the RSI indicators, so we need to get the pointers from them.
Finally, the OnInit function (and the object declarations above) will look like this...
CRSIIndividual indicators[];
CRSIAverage average;
//+------------------------------------------------------------------+
//| Custom indicator initialization function                         |
//+------------------------------------------------------------------+
int OnInit()
{
//--- indicator buffers mapping
   ArrayResize(indicators, 10);


   int index=0, plot=0;

   for (int i=0; i<10; i++)
   {
      indicators[i].SetBuffer(index, plot);
      indicators[i].SetLineColor(InterpolateColors(clrYellow, clrRed, i/9.0));
      indicators[i].SetLabel("RSI ("+IntegerToString(firstPeriod+i*increment)+")");

      indicators[i].SetPeriodRSI(firstPeriod+i*increment);
      indicators[i].Init();
   }

   average.SetBuffer(index, plot);
   average.SetLineColor(clrBlue);
   average.SetLineStyle(STYLE_DASH);
   average.SetLineWidth(2);
   average.SetLabel("Average");

   average.SetRSIPointers(indicators);

//---
   return(INIT_SUCCEEDED);
}
... and we will be able to get much cleaner the other event handling functions:
//+------------------------------------------------------------------+
//| Custom indicator iteration function                              |
//+------------------------------------------------------------------+
int OnCalculate(const int rates_total,
                const int prev_calculated,
                const datetime &time[],
                const double &open[],
                const double &high[],
                const double &low[],
                const double &close[],
                const long &tick_volume[],
                const long &volume[],
                const int &spread[])
{
//---
   int limit = MathMax(0, prev_calculated-1);

   for (int i=0; i<10; i++)
      indicators[i].Update(limit, rates_total);

   average.Update(limit, rates_total);

//--- return value of prev_calculated for next call
   return(rates_total);
}
//+------------------------------------------------------------------+
//| Custom indicator deinitialization function                       |
//+------------------------------------------------------------------+
void OnDeinit(const int reason)
{
   for (int i=0; i<10; i++)
      indicators[i].DeInit();
}
//+------------------------------------------------------------------+
Visually, the indicator will look exactly the same as the second example.
4. Expanding the class
As of now, all these classes are good in doing their job, but they are very specific to the type of indicator we have been dealing with: we have only used a few plot properties and only line drawings, but what if I want to use a plot which has color buffers? Or an histogram, or a zig-zag...? To be able to reuse what we have done, we will need to generalize the classes. For that, we need to fulfill three conditions:
- You should be able to create any type of plot/buffer, or change plot properties, without having to go out of the class or know about the details of buffer/plot indexes.
- You should be able to add plots with any drawing style (line, histogram, candles...) without having to worry about the amount and the types of buffers that each one has (however, you will always be responsible of the data you put in those arrays).
- You should be able to add specific functionality to the classes easily with inheritance (optionally).
With that in mind, we will first explain how the classes are implemented and how the inheritance is structured.
First, the classes are structured like this:
- CIndicatorBufferBase
- CIndicatorCalculations
- CIndicatorPlotBase
- CIndicator_1Data
- CIndicatorPlotLine
- CIndicatorPlotHistogram
- ...
- CIndicator_1Data1Color
- CIndicatorPlotColorLine
- ...
- CIndicator_2Data
- CIndicatorPlotHistogram2
- ...
- CIndicator_2Data1Color
- CIndicatorPlotColorHistogram2
- ...
- CIndicator_4Data
- CIndicatorPlotCandles
- ...
- CIndicator_4Data1Color
- CIndicatorPlotColorCandles
- ...
A few key points:
- The three points represent that there are more classes that inherit from the same as the one above (they only differ in the drawing style, which is implicit to each class).
- The classes in red are abstract classes that cannot be instanced, but they can store pointers of other classes that derive from them (polymorphism).
- The rest of classes inherit from a base class that has the corresponding amount of data/color buffers. That also allows for polymorphism, as you could have an indicator that needs to access a class that has 1 data buffer, independently of it being a line, an histogram, etc.
- Color classes inherit from data buffers for the same reason as in the point above.
- CIndicatorCalculations is used for auxiliary calculation buffers, which have one no plot.
The implementation, summed up, looks like this:
//+------------------------------------------------------------------+
//| Base class for plots and calculation buffers                     |
//+------------------------------------------------------------------+
class CIndicatorBufferBase
{
public:
   virtual void      SetBuffer(int &buffer, int &plot)=NULL;
   virtual void      SetAsSeries(bool set)=NULL;

   virtual void      Init() { }
   virtual void      DeInit() { }
   virtual void      Update(const int rates_total,
                            const int prev_calculated,
                            const datetime &time[],
                            const double &open[],
                            const double &high[],
                            const double &low[],
                            const double &close[],
                            const long &tick_volume[],
                            const long &volume[],
                            const int &spread[]) { }
};

//+------------------------------------------------------------------+
//| Calculations Buffer (with no plot)                               |
//+------------------------------------------------------------------+
class CIndicatorCalculations : public CIndicatorBufferBase
{
public:
   double            array[];

   virtual void      SetBuffer(int &buffer, int &plot);
   virtual void      SetAsSeries(bool set);
};

//+------------------------------------------------------------------+
void CIndicatorCalculations::SetBuffer(int &index, int &plot)
{
   SetIndexBuffer(index, array, INDICATOR_CALCULATIONS);

   index++;
//No plot is used
}

//+------------------------------------------------------------------+
void CIndicatorCalculations::SetAsSeries(bool set)
{
   ArraySetAsSeries(array, set);
}

//+------------------------------------------------------------------+
//| Base indicator plot class                                        |
//+------------------------------------------------------------------+
class CIndicatorPlotBase : public CIndicatorBufferBase
{
protected:

   int               indicator_plot;

   virtual void      SetDrawType()=NULL; //Implicit in each class

public:

   void              SetArrow(uchar arrow);
   void              SetArrowShift(int shift);
   void              SetDrawBegin(int begin);
   void              SetShowData(bool show);
   void              SetShift(int shift);
   void              SetLineStyle(ENUM_LINE_STYLE style);
   void              SetLineWidth(int width);
   void              SetColorIndexes(color &color_array[]);
   void              SetLineColor(color line_color);
   void              SetLineColor(color line_color, int index);
   void              SetEmptyValue(double empty);
   void              SetLabel(string label);

   int               GetInteger(ENUM_PLOT_PROPERTY_INTEGER property_id, int property_modifier=0);
};

//...

//...

//+------------------------------------------------------------------+
//| Base for indicators with 1 Data Buffer                           |
//+------------------------------------------------------------------+
class CIndicator_1Data : public CIndicatorPlotBase
{
public:

   double            array[];

   virtual void      SetBuffer(int &buffer, int &plot);
   virtual void      SetAsSeries(bool set);
};

//+------------------------------------------------------------------+
void CIndicator_1Data::SetBuffer(int &buffer,int &plot)
{
   indicator_plot = plot;

   SetIndexBuffer(buffer, array, INDICATOR_DATA);
   SetDrawType();

   buffer++;
   plot++;
}

//...

//+------------------------------------------------------------------+
//| Plot Line (1 data buffer)                                        |
//+------------------------------------------------------------------+
class CIndicatorPlotLine : public CIndicator_1Data
{
protected:

   virtual void      SetDrawType() final;
};

//+------------------------------------------------------------------+
void CIndicatorPlotLine::SetDrawType(void)
{
   PlotIndexSetInteger(indicator_plot, PLOT_DRAW_TYPE, DRAW_LINE);
}

//...

//...

//+------------------------------------------------------------------+
//| Base for indicators with 2 Data Buffers                          |
//+------------------------------------------------------------------+
class CIndicator_2Data : public CIndicatorPlotBase
{
public:

   double            first_array[];
   double            second_array[];

   virtual void      SetBuffer(int &buffer, int &plot);
   virtual void      SetAsSeries(bool set);
};


//+------------------------------------------------------------------+
void CIndicator_2Data::SetBuffer(int &buffer, int &plot)
{
   indicator_plot = plot;

   SetIndexBuffer(buffer, first_array, INDICATOR_DATA);
   SetIndexBuffer(buffer+1, second_array, INDICATOR_DATA);
   SetDrawType();

   buffer+=2;
   plot++;
}

//...

//...

//+------------------------------------------------------------------+
//| Base for indicators with 1 Data Buffer & 1 Color Buffer          |
//+------------------------------------------------------------------+
class CIndicator_1Data1Color : public CIndicator_1Data
{
public:

   double            color_buffer[];

   virtual void      SetBuffer(int &buffer, int &plot);
   virtual void      SetAsSeries(bool set);
};

//+------------------------------------------------------------------+
void CIndicator_1Data1Color::SetBuffer(int &buffer, int &plot)
{
   CIndicator_1Data::SetBuffer(buffer, plot);

   SetIndexBuffer(buffer, color_buffer, INDICATOR_COLOR_INDEX);

   buffer++; //Add color buffer
}

//+------------------------------------------------------------------+
void CIndicator_1Data1Color::SetAsSeries(bool set)
{
   CIndicator_1Data::SetAsSeries(set);
   ArraySetAsSeries(color_buffer, set);
}

//...
Each class contains (and sets) the amount of buffers needed. CIndicatorBufferBase has the event handlers which can be overriden optionally by any type of buffer class, CIndicatorPlotBase contains setters for all plot properties (and one getter), each base data (with or without color) class contains the array declarations and setting functions for the buffers, and every specific class overrides the function SetDrawType() and declares it as final so it cannot be overriden again (if you needed a class with undefined drawing type, you could inherit from the corresponding base data class and override that function).
As a note, in this implementation Update has all the values that are used in the OnCalculate event, but they can be overriden with less parameters if you do not need to use polymorphism.
ArraySetAsSeries was also included since it is a very common function and it almost always requires that all buffers are set in the same way.
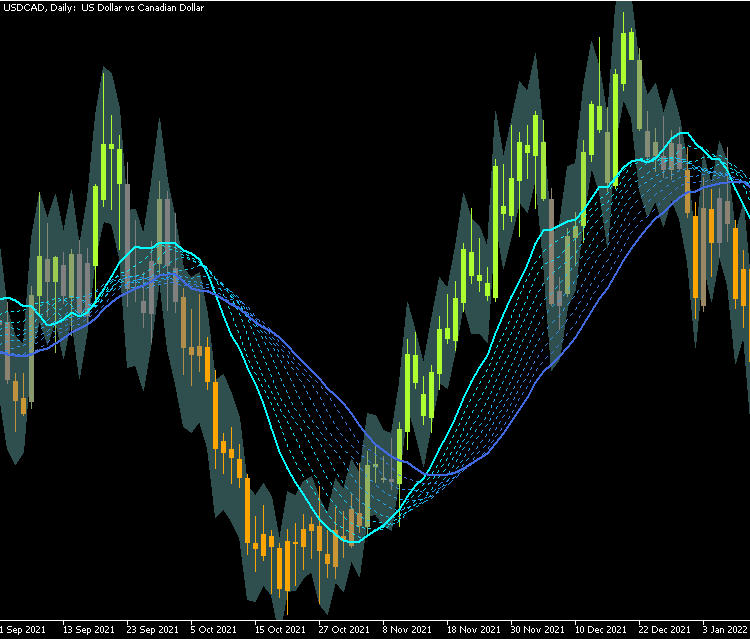
Now that we have the classes, we can create an indicator. We will add up a few things together as an example:
- First, we will create bands based on the ATR indicator and display them as a filling plot.
- Then, we will create 10 moving averages with different periods and display them in the chart as line plots.
- Finally, we will use a color candle plot to change the coloring of the candles depending on how many MAs are above/below the bands.
First we will declare the inputs and include the files for the indicator classes and the color interpolation we made in section 3:
#property indicator_buffers 19
#property indicator_plots 13

#include <OOPIndicators/IndicatorClass.mqh>
#include <OOPIndicators/ColorLerp.mqh>

input int atr_period = 10; //ATR Period
input double atr_band_multiplier = 0.8; //ATR Multiplier for bands
input bool show_bands = true; //Show Bands
input bool show_data = false; //Show Extra Data

input int ma_faster_period = 14; //MA Faster Period
input int ma_step = 2; //MA Step
input ENUM_MA_METHOD ma_method = MODE_SMA; //MA Method
We already defined the amount of buffers and plots needed. You should not have to know from the start how many of each are needed, but as you will see further below it can be easier to find out the values (in OnInit()).
Then, we will create the classes for each piece of the indicator.
Starting with the ATR bands:
//+------------------------------------------------------------------+
//| ATR Bands class (inherit from Filling Plot)                      |
//+------------------------------------------------------------------+
class CATRBand : public CIndicatorPlotFilling
{
private:

   int               handle;

public:

   virtual void      Init();
   virtual void      DeInit();
   virtual void      Update(const int limit, const int rates_total, const double &close[]);
};

//+------------------------------------------------------------------+
void CATRBand::Init(void)
{
   handle = iATR(NULL, PERIOD_CURRENT, atr_period);
}

//+------------------------------------------------------------------+
void CATRBand::Update(const int limit,const int rates_total,const double &close[])
{
   double atr[];
   CopyBuffer(handle, 0, 0, rates_total-limit, atr);

   for (int i=limit; i<rates_total; i++)
   {
      first_array[i] = close[i]+atr[i-limit]*atr_band_multiplier;
      second_array[i] = close[i]-atr[i-limit]*atr_band_multiplier;
   }
}

//+------------------------------------------------------------------+
void CATRBand::DeInit(void)
{
   IndicatorRelease(handle);
}
The MA class, which has parameters in Init() for the period and method:
//+------------------------------------------------------------------+
//| Moving Averages class (inherit from Line Plot)                   |
//+------------------------------------------------------------------+
class CMA : public CIndicatorPlotLine
{
private:

   int               handle;

public:
   virtual void      Init(int period, ENUM_MA_METHOD mode);
   virtual void      DeInit();
   virtual void      Update(const int limit, const int rates_total);
};

//+------------------------------------------------------------------+
void CMA::Init(int period, ENUM_MA_METHOD mode)
{
   handle = iMA(NULL, PERIOD_CURRENT, period, 0, mode, PRICE_CLOSE);
}

//+------------------------------------------------------------------+
void CMA::Update(const int limit,const int rates_total)
{
   if (limit==0) CopyBuffer(handle, 0, 0, rates_total, array);
   else
   {
      double newVals[];
      CopyBuffer(handle, 0, 0, rates_total-limit, newVals);

      for (int i=limit; i<rates_total; i++)
         array[i] = newVals[i-limit];
   }
}

//+------------------------------------------------------------------+
void CMA::DeInit(void)
{
   IndicatorRelease(handle);
}
And the candles class. In this case and to avoid extra complexity for the example, we will access objects from global scope. This is not recommended if you plan to reuse any class however.
It also contains macros that we will declare below too. Note: the functions are below of the macro in code, but the functions have been reordered to be shown here.
//+------------------------------------------------------------------+
//| Color Candles class (inherit from Color Candles Plot)            |
//+------------------------------------------------------------------+
class CColorCandles : public CIndicatorPlotColorCandles
{
public:
   virtual void      Update(const int limit,
                            const int rates_total,
                            const double &open[],
                            const double &high[],
                            const double &low[],
                            const double &close[]);
};

//+------------------------------------------------------------------+
void CColorCandles::Update(const int limit,
                           const int rates_total,
                           const double &open[],
                           const double &high[],
                           const double &low[],
                           const double &close[])
{
   for (int i=limit; i<rates_total; i++)
   {
      open_array[i] = open[i];
      high_array[i] = high[i];
      low_array[i] = low[i];
      close_array[i] = close[i];

      int count_ma = TOTAL_MA;

      for (int m=0; m<TOTAL_MA; m++)
      {
         if (maIndicators[m].array[i] > bands.first_array[i]) count_ma++;
         if (maIndicators[m].array[i] < bands.second_array[i]) count_ma--;
      }

      color_buffer[i] = count_ma;

      //Update inside of this other object (to avoid making an extra inheritance, or an external loop)
      showIndex.array[i] = TOTAL_MA - count_ma;
   }
}
Now we have to declare the objects and configure the buffers and plots' visuals:
#define TOTAL_MA 10

CMA maIndicators[TOTAL_MA];
CATRBand bands;
CColorCandles candles;
CIndicatorPlotNone showIndex; //To show MAs above/below

//+------------------------------------------------------------------+
//| Custom indicator initialization function                         |
//+------------------------------------------------------------------+
int OnInit()
{
//--- indicator buffers mapping
   int buffer=0, plot=0;

   bands.SetBuffer(buffer, plot);
   candles.SetBuffer(buffer, plot);
   for (int i=0; i<TOTAL_MA; i++)
      maIndicators[i].SetBuffer(buffer, plot);
   showIndex.SetBuffer(buffer, plot);

//Print("Buffers: ", buffer, "  Plots: ", plot);

//--- plot settings
   if (show_bands) bands.SetLineColor(clrDarkSlateGray);
   else bands.SetLineColor(clrNONE);
   bands.SetShowData(show_data);
   if (show_data)
      bands.SetLabel("Close + ATR;Close - ATR");


   for (int i=0; i<TOTAL_MA; i++)
   {
      maIndicators[i].SetLineColor(InterpolateColors(clrAqua, clrRoyalBlue, i/(TOTAL_MA-1.0)));
      maIndicators[i].SetLabel("MA("+IntegerToString(ma_faster_period+i*ma_step)+")");
      maIndicators[i].SetShowData(show_data);
      if (i>0 && i <TOTAL_MA-1) maIndicators[i].SetLineStyle(STYLE_DOT);
      else maIndicators[i].SetLineWidth(2);
   }

   color arrow_colors[TOTAL_MA*2+1];

   for (int i=0; i<TOTAL_MA; i++)
      arrow_colors[i] = InterpolateColors(clrGreenYellow, clrGray, i/double(TOTAL_MA));
   arrow_colors[TOTAL_MA] = clrGray;
   for (int i=TOTAL_MA+1; i<TOTAL_MA*2+1; i++)
      arrow_colors[i] = InterpolateColors(clrGray, clrOrange, (i-TOTAL_MA)/double(TOTAL_MA));

   candles.SetColorIndexes(arrow_colors);
   candles.SetLabel("Open;High;Low;Close");
   candles.SetShowData(false);

   showIndex.SetLabel("MAs above/below");
   showIndex.SetShowData(true);

//--- initialize classes
   bands.Init();
   for (int i=0; i<TOTAL_MA; i++)
      maIndicators[i].Init(ma_faster_period+i*ma_step, ma_method);

   return(INIT_SUCCEEDED);
}
In order, first the buffers are configured, then the plot properties and then the sub-indicators are initialized (as specified in their classes).
As said before, you can easily know the amount of buffers and plots that you need by printing the values of the variables buffer and plot. Then you can set the properties correctly (at the beginning, you can also set them to a higher number than needed to avoid errors).
Notice also that we included an instance of the Plot None class. That object is updated by the candles object so it does not need specific event handlers. It displays the amount of MAs that are above or below the bands in the data window.
Finally, there is not much functionality in the other event handlers since everything is inside of the objects, only it is needed to call the functions from the objects in correct order:
//+------------------------------------------------------------------+
//| Custom indicator iteration function                              |
//+------------------------------------------------------------------+
int OnCalculate(const int rates_total,
                const int prev_calculated,
                const datetime &time[],
                const double &open[],
                const double &high[],
                const double &low[],
                const double &close[],
                const long &tick_volume[],
                const long &volume[],
                const int &spread[])
{
//---
   int limit = MathMax(0, prev_calculated-1);

   bands.Update(limit, rates_total, close);

   for (int i=0; i<TOTAL_MA; i++)
      maIndicators[i].Update(limit, rates_total);

   candles.Update(limit, rates_total, open, high, low, close);

//--- return value of prev_calculated for next call
   return(rates_total);
}

//+------------------------------------------------------------------+
//| Custom indicator deinitialization function                       |
//+------------------------------------------------------------------+
void OnDeinit(const int reason)
{
   bands.DeInit();
   for (int i=0; i<TOTAL_MA; i++)
      maIndicators[i].DeInit();
}
The final result of the indicator looks like this:
5. Limitations of this method
Even though it is more convenient, using functions instead of properties comes with a few drawbacks: the most notable being the interference when changing the colors/style of any plot, sometimes they stay and sometimes they get rewritten by the initialization.
This issue can be avoided by using inputs for the colors (instead of changing them in the Colors tab) or checking if there is a different color than black (0x000000) which is the default one. That would work with all colors except black, though.
if (obj.GetInteger(PLOT_LINE_COLOR)==clrBlack)
   obj.SetLineColor(clrYellow);
Also, in this article we have not analized the performance impacts of using these classes. In theory, using properties directly and less functions should be faster, but not too significative in most cases.
Finally, as you may have noticed, the classes do not contain handlers for chart events or OnTimer. The reason is that chart events are better processed directly in OnChartEvent, calling the specific functions after that is done (rather than calling a handler for every indicator each time there is an event, and processing every event multiple times). For the timer, you can use the Update handler differently if your indicator is multi-timeframe or multi-currency (you would not have access to the OnCalculate arrays directly). Other design decission that some may disagree with was declaring the arrays that are used as buffers with public visibility: it is posible to set the arrays with protected visibility and the indicator would still work, but you may need to add getters to be able to access data externally.
6. Conclusion
In this article we have thought and developed a method to create complex indicators more easily and in less lines. We started with small organization tricks for a specific case, then implemented a class structure that allows for reutilization and customization of functionality and finally we put everything together into an example indicator that uses most of the features described in the article.
 Learn how to design a trading system by Force Index
 Neural networks made easy (Part 17): Dimensionality reduction
 Developing a trading Expert Advisor from scratch (Part 18): New order system (I)
- Free trading apps
- Over 8,000 signals for copying
- Economic news for exploring financial markets
You agree to website policy and terms of use
Just a good approach to implementation in the article, nothing new, just not a bad solution to the problem.
Your article was very good 😁 ... but as you mentioned, there is a slight problem involved in the performance issue. Most of the time, it won't affect anything, and you can live with it without any problems. But at times of great volatility, the system may crash or become very slow, due to the number of calls that OnCalculate may receive. But the problem is not with the function, but with the interactions that take place within it. Because with each call, MetaTrader will be forced to read the buffer of the indicators, and if the number is large, there could be problems. One way to solve this would be to use a call to OnTime, in order to lighten the load a little, since the calls would be executed not at each calculation event, but over a predefined period of time. If the idea is to operate manually, or semi-automatically, this wouldn't be a problem, as each calculation could be carried out within 200 milliseconds, for example. But it's not very suitable to use OnTime events in indicators, because of the possibility of them influencing the calculation thread, especially when the market is very volatile. One way of doing this would be to force the calculations in OnCalculate itself, so that you don't need to make CopyBuffer calls. Another thing that will reduce processor consumption by a few machine cycles is to modify the following line in the OnCalculate function:
for this one:
It may not seem like much, but using the ternary operator in this case will be more efficient than making a call to the function. These small details make a big difference in times of high volatility ... 😁👍