ICT Concepts
- Indikatoren
- Minh Truong Pham
- Version: 2.8
- Aktualisiert: 9 Oktober 2023
- Aktivierungen: 8
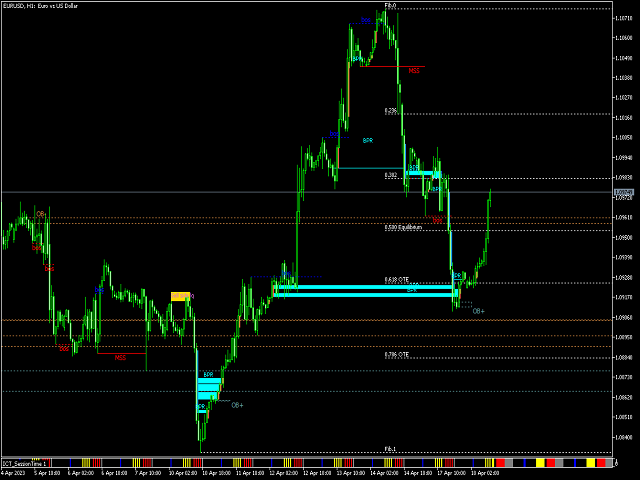
The ICT Concepts indicator regroups core concepts highlighted by trader and educator "The Inner Circle Trader" (ICT) into an all-in-one toolkit. Features include Market Structure (MSS & BOS), Order Blocks, Imbalances, Buyside/Sellside Liquidity, Displacements, ICT Killzones, and New Week/Day Opening Gaps. It’s one kind of Smart money concepts.
🔶 USAGE: Please read this document ! 🔶
DETAILS
Market Structure
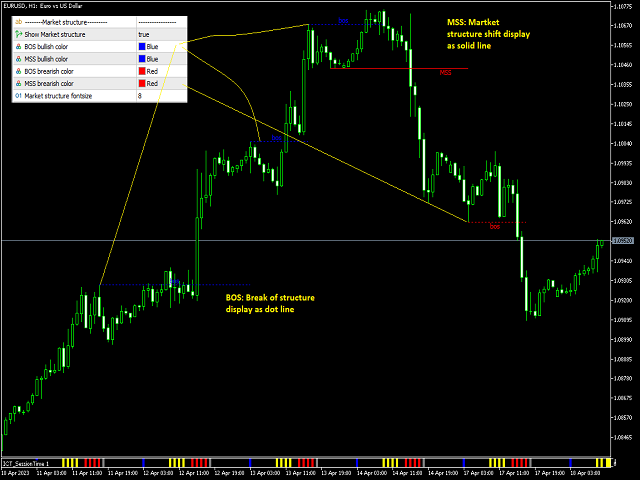
Market structure labels are constructed from price breaking a prior extreme point. This allows a user to determine the current market trend based on the price action.
There are two types of Market Structure labels included:
· Market Structure Shift (MSS)
· Break Of Structure (BOS)
A MSS occurs when price breaks a swing low in an uptrend or a swing high in a downtrend, highlighting a potential reversal. This is often labeled as "CHoCH", but ICT specifies it as MSS.
On the other hand, BOS labels occur when price breaks a swing high in an uptrend or a swing low in a downtrend. The occurrence of these particular swing points is caused by retracements (inducements) that highlights liquidity hunting in lower timeframes.
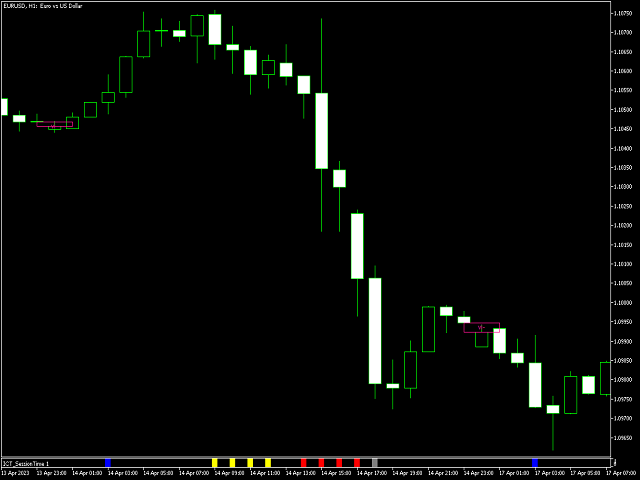
Order Blocks
More significant market participants (institutions) with the ability of placing large orders in the market will generally place a sequence of individual trades spread out in time. This is referred as executing what is called a "meta-order".
Order blocks highlight the area where potential meta-orders are executed. Bullish order blocks are located near local bottoms in an uptrend while bearish order blocks are located near local tops in a downtrend.
When price mitigates (breaks out) an order block, a breaker block is confirmed. We can eventually expect price to trade back to this breaker block offering a new trade opportunity.
In this indicator, Order block display as small not filled rectangle. When OB filled, it become breaker (mitigated) block and display as not filled rectangle but lenghthen to the present.
Buyside & Sellside Liquidity
Buyside (BSL) / Sellside (SSL) liquidity levels highlight price levels where market participants might place limit/stop orders.
Buyside liquidity levels will regroup the stoploss orders of short traders as well as limit orders of long traders, while Sellside liquidity levels will regroup the stoploss orders of long traders as well as limit orders of short traders.
These levels can play different roles. More informed market participants might view these levels as source of liquidity, and once liquidity over a specific level is reduced it will be found in another area.
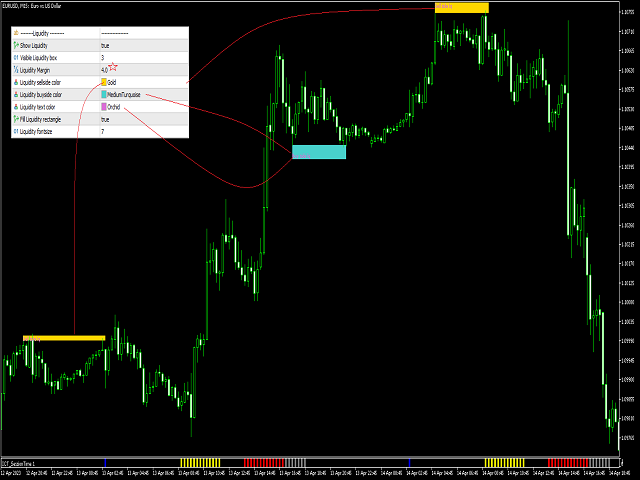
BSL, SSL display as filled rectangle from first point to second point. Thickness of the rectangle is
“point 1 + (10 bar Average True Range / (10 / margin))”
Imbalances
Imbalances highlight disparities between the bid/ask, these can also be defined as inefficiencies, which would suggest that not all available information is reflected by the price and would as such provide potential trading opportunities.
It is common for price to "rebalance" and seek to come back to a previous imbalance area.
ICT highlights multiple imbalance formations:
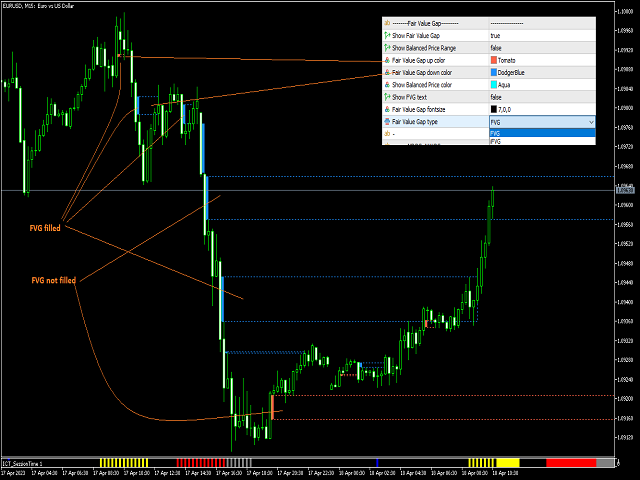
· Fair Value Gaps: A three candle formation where the candle shadows adjacent to the central candle do not overlap, this highlights a gap area.
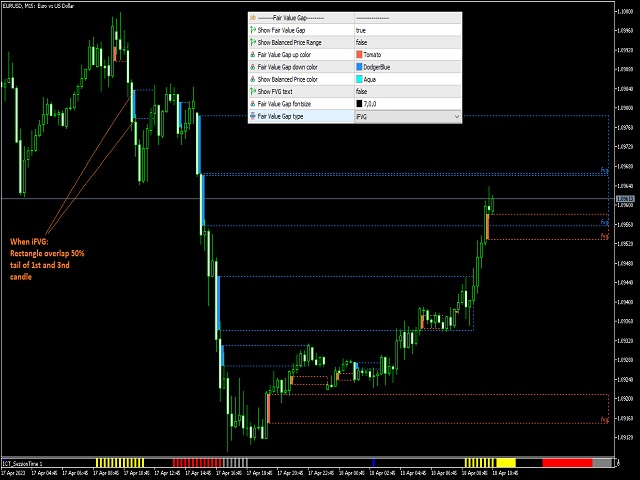
· Implied Fair Value Gaps: Unlike the fair value gap the implied fair value gap has candle shadows adjacent to the central candle overlapping. The gap area is constructed from the average between the respective shadow and the nearest extremity of their candle body.
· Balanced Price Range: Balanced price ranges occur when a fair value gap overlaps a previous fair value gap, with the overlapping area resulting in the imbalance area.
· Volume Imbalance: Volume imbalances highlight gaps between the opening price and closing price with existing trading activity (the low/high overlap the previous high/low).
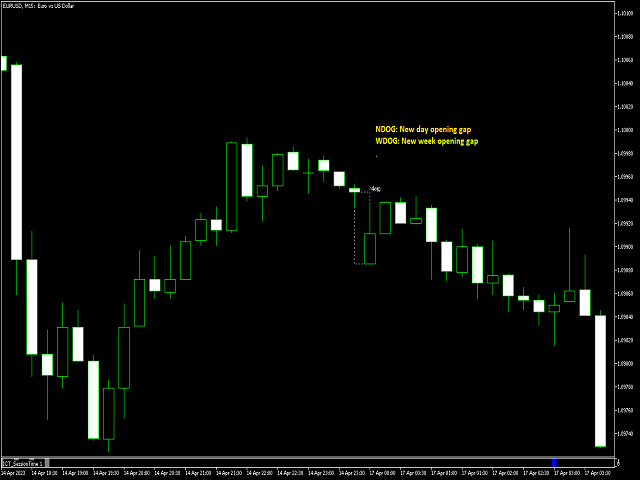
· Opening Gap: Unlike volume imbalances opening gaps highlight areas with no trading activity. The low/high does not reach previous high/low, highlighting a "void" area.
This indicator display imbalances area as:
+ When imbalances were created, it display as small filled rectangle
+ When imbalances were filled by price later, is display as small rectangle but not fill.
Displacement
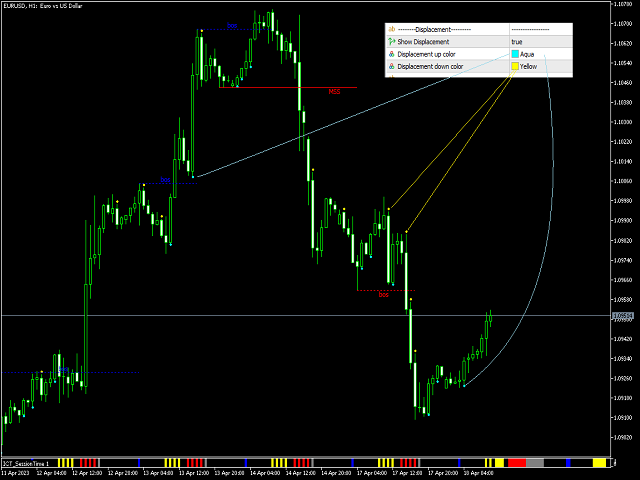
Displacements are scenarios where price forms successive candles of the same sentiment (bullish/bearish) with large bodies and short shadows.
These can more technically be identified by positive auto correlation (a close to open change is more likely to be followed by a change of the same sign) as well as volatility clustering (large changes are followed by large changes).
Displacements can be the cause for the formation of imbalances as well as market structure, these can be caused by the full execution of a meta order.
Displacements display as small dot upper candle with bearish sentiment and lower candle with bullish sentiment
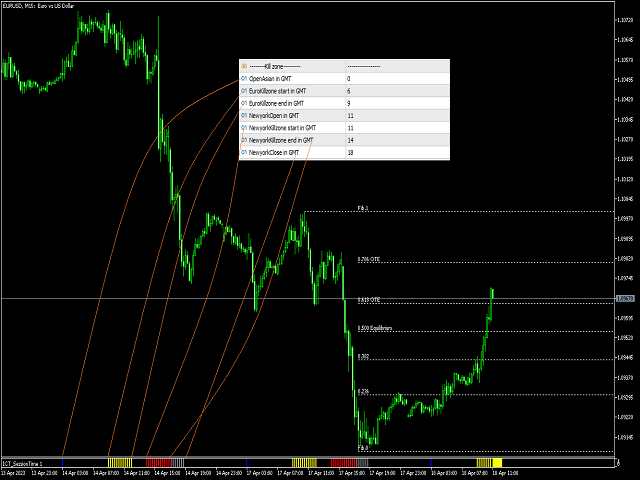
Kill Zones
Killzones represent different time intervals that aims at offering optimal trade entries. Killzones include:
- New York Killzone (11:13 GMT)- London Open Killzone (6:9 GMT)
- London Close Killzone (14:16 GMT)
- Asian Killzone (1:00 - 5:00 GMT)
Kill zones display in indicator seperate windows.
===
SETTINGS
Market structure (image 2):
+ Choose show market structure or not
+ Change color of BOS, MSS – Bullish or bearish
Displacement (image 3)
+ Choose show displacement or not
+ Color settings
Order block (image 4)
+ Enable/disable Order Blocks
+ Color settings
+ Enable breaker block (when order block mitigated)
+ Max distance (in candle) from ob to swing extreme point
+ Length filter of first candle in OB. Default is 0.6 of mean candle. Mean candle is candle have body longer than SMA body period=5
Volume imbalance (image 5)
+ Enable/disable Volume Imbalance
+ Color settings
Liquidity (image 6)
+ Enable/disable Liquidity
+ Visible Liquidity box: sets the amount of visible Liquidity boxes
+ Margin: sets the sensitivity, 2 points are fairly equal when:
'point 1' < 'point 2' + (10 bar Average True Range / (10 / margin)) and
'point 1' > 'point 2'
+ Color settings
Fair Value Gap (image 7, 8 for iFVG)
+ Enable/disable FVG's
+ Balance Price Range: this is the overlap of latest bullish and bearish Fair Value Gaps.
When enable Balance Price Range mode, FVG filled will not rayright
+ Color settings
+ Options: Choose whether you wish to see FVG or Implied Fair Value Gaps (image 8)
NWOG/NDOG (image 9)
+ Enable/disable NWOG; color settings
+ Enable/disable NDOG ; color settings
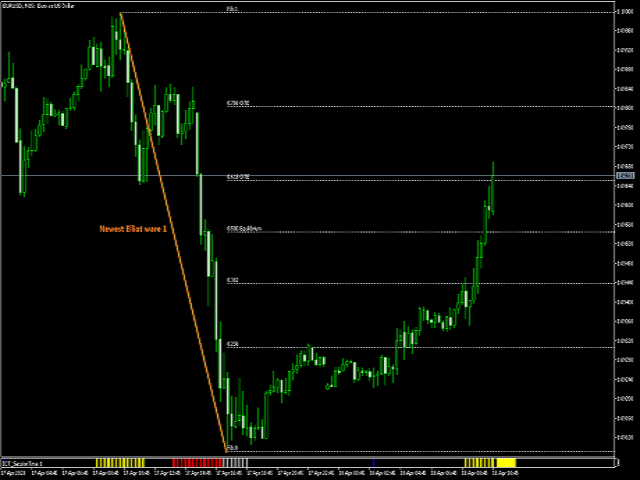
Fibonacci (image 10)
+ Enable/disable fibonacci
+ Color settings
Killzone (image 11)
+ Enable/disable
+ Time in GMT setting
Conclusion & Supplementary Material
This script aims to emulate how a trader would draw each of the covered features on their chart in the most precise representation to how it's actually taught by ICT directly.
ICT Concepts, however, is more specifically aligned toward the community's interpretation of how to analyze price 'based on ICT', rather than displaying features to have a more classic interpretation for a technical analyst.


Amazing indicator, works exactly as described. All ICT methods consolidated in a single indicator, and full control on customization. Although one needs to understand ICT strategies and market structure concepts to be able to successfully use it. The author is super responsive and had made adjustment to the indicator settings as per request on the fly. I highly recommend this indicator for those who use ICT, SMC concepts.