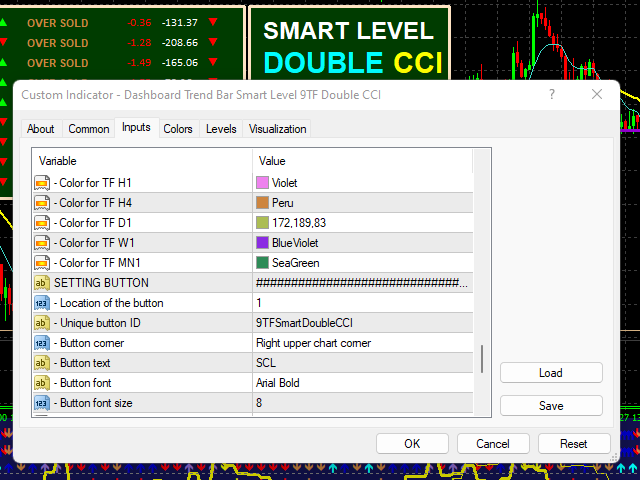
Dashboard Trend Bar Smart Level 9TF Double CCI
- Indikatoren
- Anon Candra N
- Version: 1.0
- Aktivierungen: 15
Ein genauer CCI-Indikator ist verfügbar.
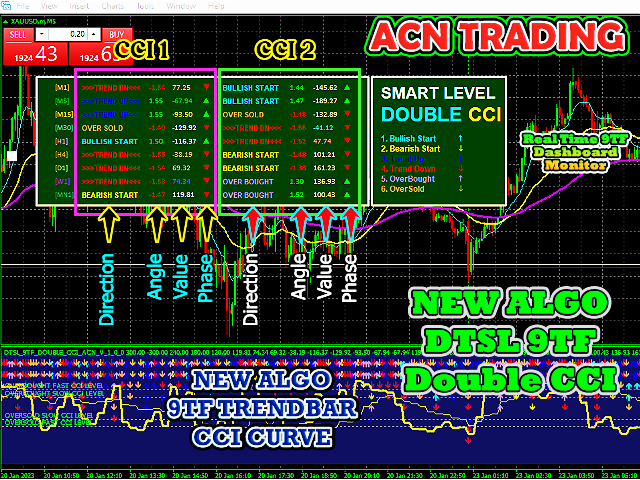
Dashboard Trendleiste Smart Level 9TF Double CCI.
Doppelter CCI, d.h. Fast CCI & Slow CCI
Warum brauchen Sie ein zweites CCI? Die Verwendung zusätzlicher Indikatoren wird uns im Live-Handel mehr überzeugen
9TF Fast CCI-Kurve
9TF Langsame CCI-Kurve
9TF Echtzeit-CCI-Winkel
9TF Echtzeit-CCI-Wert
9TF Echtzeit-CCI-Richtung/Phase
9TF Trendleiste
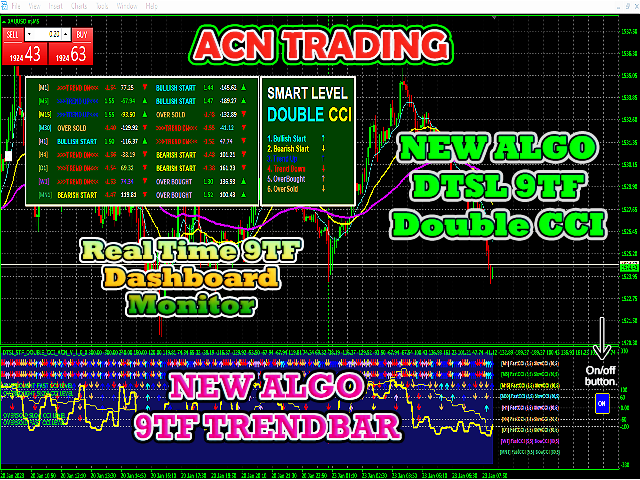
Neuer Algorithmus bei der Berechnung des Trendbalkens
An / aus Schalter. Sehr nützlich, um den Indikator mit nur einem Klick anzuzeigen/auszublenden
Echtzeit-9TF-Dashboard-Monitor
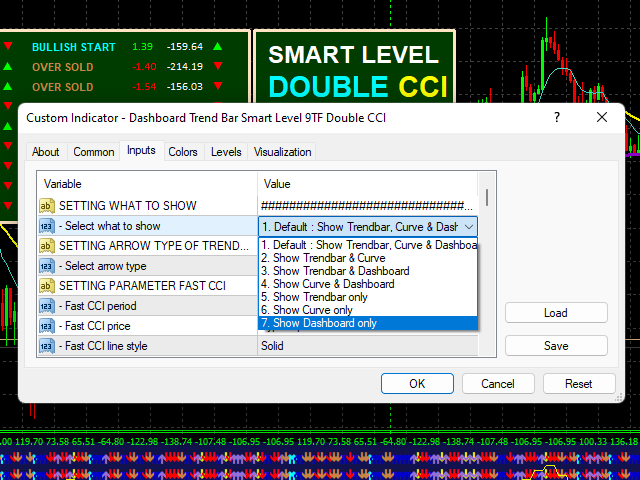
Möglichkeit, nur die Trendleiste anzuzeigen
Möglichkeit, nur die CCI-Kurve anzuzeigen
Möglichkeit, nur Dashboard anzuzeigen
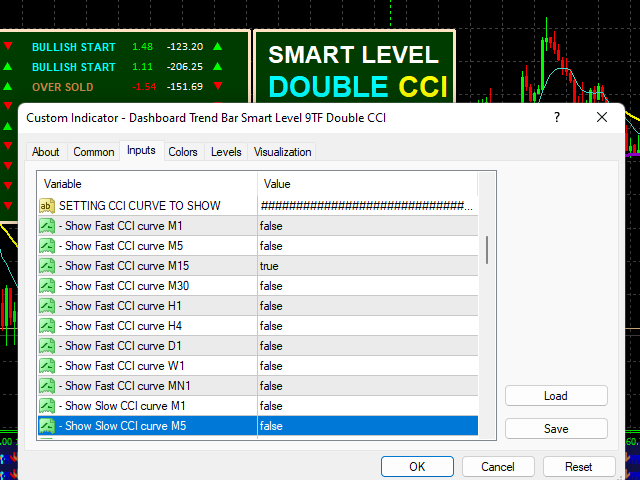
Möglichkeit auszuwählen, welche CCI-Kurve angezeigt werden soll
Möglichkeit, den Pfeiltyp des Trends auszuwählen
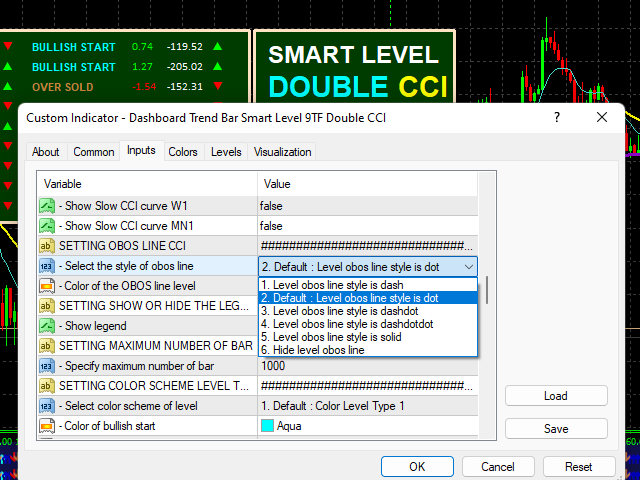
Möglichkeit zur Auswahl des Obos-Linienstils
Möglichkeit zum Ein-/Ausblenden der Legende
Möglichkeit, die Anzahl der Balken zu erhöhen/zu verringern
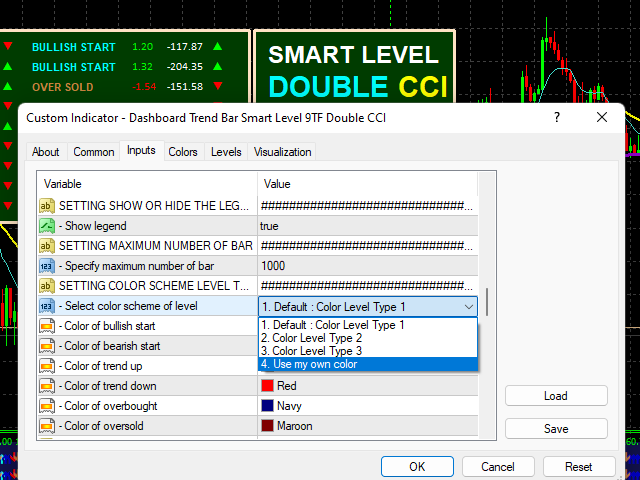
Möglichkeit zur Auswahl der Farbschemaebene
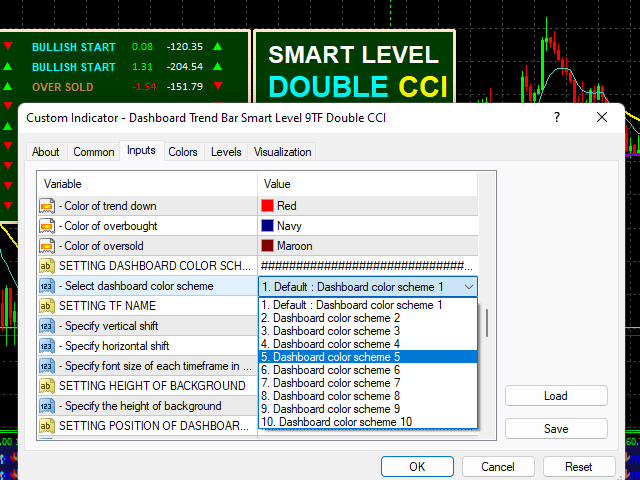
Möglichkeit, bis zu 10 Dashboard-Trendbalken-Farbschemata auszuwählen
Möglichkeit, die Farbe der CCI-Kurve zu ändern
Dieser Indikator hat eine Reihe von Versuchen durchlaufen. Die Programmiercodes wurden mit größter Sorgfalt erstellt.
Machen Sie selbstbewusste Einträge mit dem besten DTSL 9TF Double CCI-Handelsindikator.
Holen Sie sich jetzt und handeln Sie wie ein Profi.
Danke dir.