Weis Wave Double Side
- Indikatoren
- Eduardo Da Costa Custodio Santos
- Version: 1.0
- Aktivierungen: 5
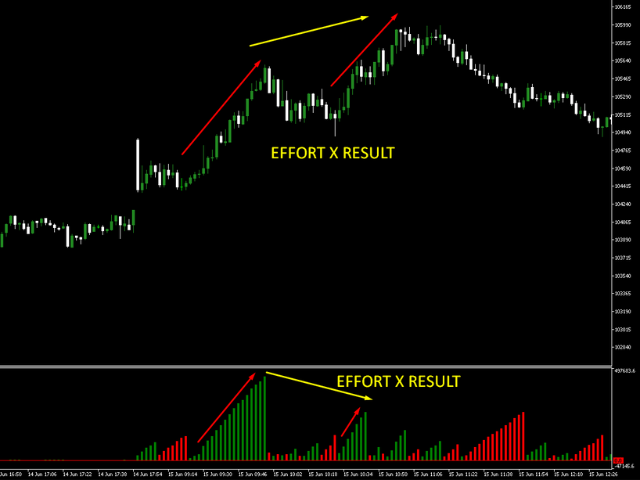
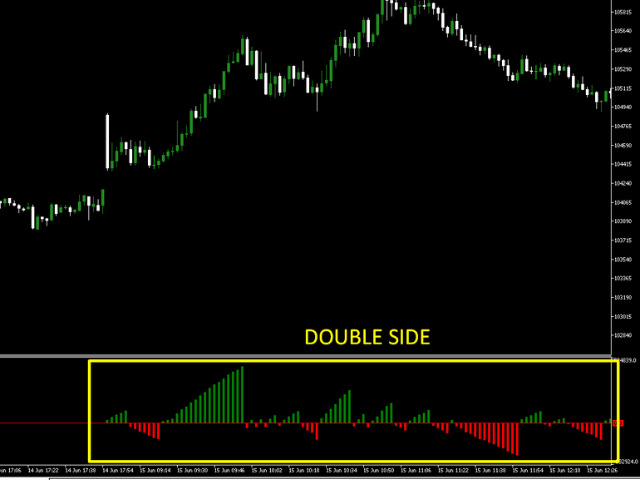
Der Weis Wave Bouble Side Indicator für MT5 ist Teil des Toolkits (Wyckoff Academy Wave Market) Der Weis Wave Bouble Side Indicator für MT5 wurde basierend auf dem bereits etablierten Weis Wave von David Weis entwickelt. Der Weis Wave Double Side Indikator liest den Markt in Wellen, wie er gemacht wurde von R. Wyckoff im Jahr 1900. Es hilft bei der Identifizierung von Aufwand x Ergebnis, Ursache und Wirkung sowie Angebot und Nachfrage Sein Unterschied besteht darin, dass es unterhalb der Nullachse verwendet werden kann, was eine weitere Verbesserung bedeutet plus Bedienerablesung Indikator, der auf der Grundlage der Theorie von R. Wyckoff erstellt wurde Sehen Sie sich die Bilder an, wie der Indikator gelesen wird.