• Übersicht
  • Bewertungen
  • Diskussion
  • Neue Funktionen

AIS Ind Basic Window Functions MT5

Zur Glättung von Zeitreihen können verschiedene Fensterfunktionen verwendet werden. Fensterfunktionen können sich in ihren Eigenschaften stark voneinander unterscheiden - Grad der Glättung, Rauschunterdrückung usw. Mit diesem Indikator können Sie die Funktionen des Hauptfensters implementieren und ihre Leistung in Finanzzeitreihen bewerten.
Indikatorparameter:
  • iPeriod – Indikatorperiode. iPeriod >= 2
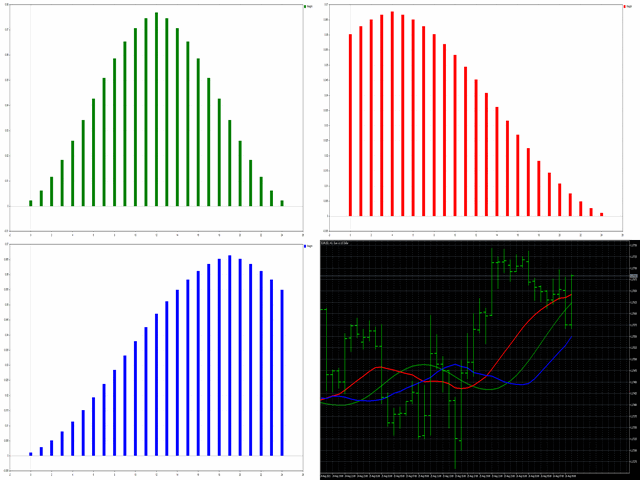
  • iCenter ist der Index der Referenz, wo sich die Mitte der Fensterfunktion befinden wird. Standardmäßig ist dieser Parameter 0 - die Mitte des Fensters fällt mit der Mitte des Indikators zusammen. Mit 1 <= iCenter <= iPeriod wird die Mitte der Fensterfunktion verschoben, wodurch sich einige Eigenschaften des Indikators ändern. In Abbildung 1 sehen Sie, wie sich die Wahl des Zentrums auf die Fensterfunktion und die Anzeige des Indikators auswirkt. Dieser Parameter kann in Schritten von 0,5 geändert werden.

Einige Fensterfunktionen verwenden zusätzliche Parameter - ParameterA und ParameterB. Sie beeinflussen die Fenstergewichte. Aus diesem Grund ändern sich die Eigenschaften des Indikators. Die Tabelle zeigt die Fensterfunktionen und die Grenzen für die Änderung von Parametern, falls sie verwendet werden. Die Verteilung der Fensterfunktionsgewichte für bestimmte Parameter kann mit dem Skript https://www.mql5.com/ru/market/product/72156 geschätzt werden

Window
Parameter A
Parameter B
Bartlett - Hann window


Blackman window


Blackman window exact


Blackman – Harris window


Blackman – Harris window approx.


Blackman – Harris window corr.


Blackman - Harris window opt.


Blackman – Harris window ref.


Blackman - Nuttall window


Bohman window


Cauchy window
0 <= ParameterA

Connes window
1 < = ParameterA

Cosine gen. window 1st
0 <= ParameterA <= 100

Cosine gen. window 2nd
0 <= ParameterA <= 100

Dolph - Chebyshev window
0 <= ParameterA

Flat Top window


Flat Top window approx.


Gauss window
1 < = ParameterA <= 2*iPeriod

Gauss window approx.
1 < = ParameterA <= 2*(iPeriod+1)

Gauss window conf.
1 < = ParameterA <= 2*(iPeriod+1)

Gauss window gen.
1 < = ParameterA <= 2*iPeriod
0 <= ParameterB
Hamming window


Hamming window opt.


Hann window


Hann double window


Hann - Poisson window
0 <= ParameterA

Hyperbolic tangent window
0 <= ParameterA
0 <= ParameterB
Kaiser window
0 <= ParameterA

Kaiser - Bessel window
0 <= ParameterA

Kaiser – Bessel window approx.


Karre window


Lanczos window


Lanczos kernel window
1 <= ParameterA

Log window
1 <= ParameterA

Logistic window


Modified cosine window


Nuttall's window


Parzen window


Planck - Bessel window
0 < = ParameterA <= iPeriod/2
0 <= ParameterB
Plank-taper window
0 < = ParameterA <= iPeriod/2

Poisson window
0 <= ParameterA

Rectangular window


Rife – Vincent 3rd window


Rife – Vincent 4th window


Silverman window
1 <= ParameterA

Sinusoidal windows
0 <= ParameterA

Smoothed rectangular window
0 < = ParameterA <= iPeriod/2

Stepped window
0 <= ParameterA

Triangular window
0 < = ParameterA

Tukey window
0 < = ParameterA <= iPeriod/2

Welch window
1 <= ParameterA


Empfohlene Produkte
Gecko EA MT5
Profalgo Limited
5 (1)
NEW PROMO: Only a few copies copies available at 349$ Next price: 449$ Make sure to check out our " Ultimate EA combo package " in our   promo blog ! Gecko runs a simple, yet very effective, proven strategy.  It looks for important recent support and resistance levels and will trade the breakouts.  This is a "real" trading system, which means it will use a SL to protect the account.  It also means it will not use any dangerous techniques like martingale, grid or averaging down. The EA shows its
Mine Farm
Maryna Kauzova
5 (1)
Mine Farm is one of the most classic and time-tested scalping strategies based on the breakdown of strong price levels. Mine Farm is the author's modification of the system for determining entry and exit points into the market... Mine Farm - is the combination of great potential with reliability and safety. Why Mine Farm?! - each order has a short dynamic Stop Loss - the advisor does not use any risky methods (averaging, martingale, grid, locking, etc.) - the advisor tries to get
Noize Absorption Index - is the manual trading system that measures the difference of pressure between bears forces and bulls forces. Green line - is a noize free index that showing curent situation. Zero value of index shows totally choppy/flat market.Values above zero level shows how powerfull bullish wave is and values below zero measures bearish forces.Up arrow appears on bearish market when it's ready to reverse, dn arrow appears on weak bullish market, as a result of reverse expectation.
Owl Smart Levels MT5
Sergey Ermolov
4.43 (37)
MT4-Version  |  FAQ Der Owl Smart Levels Indikator ist ein komplettes Handelssystem innerhalb eines Indikators, der so beliebte Marktanalysetools wie die fortschrittlichen Fraktale von Bill Williams , Valable ZigZag, das die richtige Wellenstruktur des Marktes aufbaut, und Fibonacci-Levels , die die genauen Einstiegslevels markieren, enthält in den Markt und Orte, um Gewinne mitzunehmen. Detaillierte Strategiebeschreibung Anleitung zur Verwendung des Indikators Berater-Assistent im Handel Owl H
Premium-Level ist ein einzigartiger Indikator mit mehr als 80% Genauigkeit der richtigen Vorhersagen! Dieser Indikator wurde von den besten Trading-Spezialisten seit mehr als zwei Monaten getestet! Den Indikator des Autors finden Sie nirgendwo anders! Anhand der Screenshots können Sie sich von der Genauigkeit dieses Tools überzeugen! 1 ist ideal für den Handel mit binären Optionen mit einer Ablaufzeit von 1 Kerze. 2 funktioniert bei allen Währungspaaren, Aktien, Rohstoffen, Kryptowähr
Rainbow EA MT5
Jamal El Alama
Description : Rainbow EA MT5 is a simple Expert advisor based on   Rainbow MT5 indicator witch is based on Moving average with period 34. The indicator is incorporated in the EA, therefore, it is not required for the EA to operate, but if you wish, you can download it from   my product page . The Expert Advisor settings are as follows : Suitable for Timeframes up to H1 The parameters below can be set according to your trading rules. StopLoss ( Stop Loss in pips) TakeProfit ( Take Profit in pi
The best time to trade Using this Indicator is when the time reach exactly hour,half,45 minutes,15 minutes and sometimes 5 minutes.. This indicators is helpful to those who trade boom and crash indecies.How to read this indicator first you'll see Blue allow and Red allow all these allows used to indicate or to detect the spike which will happen so the allow happens soon before the spike happen.This indicator works properly only in boom and crash trading thing which you have to consider when
PipFinite Trend PRO MT5
Karlo Wilson Vendiola
4.87 (665)
Breakthrough Solution For Trend Trading And Filtering With All Important Features Built Inside One Tool! Trend PRO's smart algorithm detects the trend, filters out market noise and gives entry signals with exit levels. The new features with enhanced rules for statistical calculation improved the overall performance of this indicator. Important Information Revealed Maximize the potential of Trend Pro, please visit www.mql5.com/en/blogs/post/713938 The Powerful Expert Advisor Version Automa
For a trader, trend is our friend. This is a trend indicator for MT5, can be used on any symbol. just load it to the terminal and you will see the current trend. green color means bullish trend and red means bearlish trend. you can also change the color by yourself when the indicator is loaded to the MT5 terminal the symbol and period is get from the terminal automaticly. How to use: I use this trend indicator on 2 terminals with different period  for the same symbol at same time. for example M5
Your Trend Friend
Luigi Nunes Labigalini
The trend is your friend! Look at the color of the indicator and trade on that direction. It does not  repaint. After each candle is closed, that's the color of the trend. You can focus on shorter faster trends or major trends, just test what's most suitable for the symbol and timeframe you trade. Simply change the "Length" parameter and the indicator will automatically adapt. You can also change the color, thickness and style of the lines. Download and give it a try! There are big movements
Renko Gold
Ignacio Agustin Mene Franco
Renko Gold! clearly indicates the floors and ceilings where it goes from 4 lines, the line below that marks the floor in green confirming with the thinnest line clarifies the purchase entry, the same is for sale, the top line marks the ceiling and the thinnest red line marks the sale, This indicator works for all temporalities! For Forex and Synthetic Indices markets! It also works for crypto markets! Good profit! World Investor.
Trend Monitor MT5
Pavel Zamoshnikov
3.67 (3)
The indicator generates early signals basing on ADX reading data combined with elements of price patterns. Works on all symbols and timeframes. The indicator does not redraw its signals. You see the same things on history and in real time. For better visual perception signals are displayed as arrows (in order not to overload the chart). Features The best results are obtained when the indicator works on two timeframes. For example: M30 – the indicator shows the main trend; M5 – the indicator ge
The Riko Trend indicator is a revolutionary trend trading and filtering solution with all the important features of a trend tool built into one tool! The Riko Trend indicator is good for any trader, suitable for any trader for both forex and binary options. You don’t need to configure anything, everything is perfected by time and experience, it works great during a flat and in a trend. The Riko Trend indicator is a technical analysis tool for financial markets that reflects the current price
The Antique Trend Indicator is a revolutionary trend trading and filtering solution with all the important features of a trend tool built into one tool! The Antique Trend indicator is good for any trader, suitable for any trader both for Forex and binary options. There is no need to configure anything, everything has been perfected by time and experience, it works great during flats and trends. The Antique Trend indicator is a tool for technical analysis of financial markets, reflecting curre
PZ Trend Trading MT5
PZ TRADING SLU
3.67 (3)
Trend Trading ist ein Indikator, der so weit wie möglich von den Markttrends profitiert, indem er Pullbacks und Breakouts zeitlich festlegt. Sie findet Handelsmöglichkeiten, indem sie analysiert, was der Preis während etablierter Trends tut. [ Installationsanleitung | Update-Anleitung | Fehlerbehebung | FAQ | Alle Produkte ] Handeln Sie mit Zuversicht und Effizienz an den Finanzmärkten Profitieren Sie von etablierten Trends, ohne ins Wanken zu geraten Profitable Pullbacks, Ausbrüche und vor
Volality Index scalper indicator  Meant for Volality pairs such as Volality 10, 25, 50, 75 and 100 The indicator works on all timeframes from the 1 minute to the monthly timeframe the indicator is non repaint the indicator has 3 entry settings 1 color change on zero cross 2 color change on slope change 3 color change on signal line cross Orange line is your sell signal Blue line is your buy signal.
HMA Trend Professional MT5
Pavel Zamoshnikov
4.4 (5)
Improved version of the free HMA Trend indicator (for MetaTrader 4) with statistical analysis. HMA Trend is a trend indicator based on the Hull Moving Average (HMA) with two periods. HMA with a slow period identifies the trend, while HMA with a fast period determines the short-term movements and signals in the trend direction. The main differences from the free version: Ability to predict the probability of a trend reversal using analysis of history data. Plotting statistical charts for analyz
Trendseite - ein technischer Indikator zur Bestimmung des Trends. Es ist eine Reihe von mehreren vollwertigen Handelsstrategien. Der Indikator verwendet ein fortschrittliches Trendfiltersystem, hat ein statistisches Panel, berechnet Einstiegs- und Ausstiegsniveaus und berechnet das dynamische Trailing-Stop-Niveau. Geeignet für jede Art von Symbolen, zeichnet seine Signale und Ergebnisse niemals neu. Ein umfassendes Tool für den professionellen Trendhandel. Das Set des Trend Side-Indikators um
QM Pattern Scanner MT5
Reza Aghajanpour
5 (4)
QM (Quasimodo) Pattern is based on Read The Market(RTM) concepts. The purpose of this model is to face the big players of the market (financial institutions and banks), As you know in financial markets, big traders try to fool small traders, but RTM prevent traders from getting trapped. This style is formed in terms of price candles and presented according to market supply and demand areas and no price oscillator is used in it. RTM concepts are very suitable for all kinds of investments, includi
The "No Reversal Accumatrix AI" is a cutting-edge MetaTrader 5 indicator designed to assist traders in confirming trends without the inconvenience of repainting. Built upon advanced artificial intelligence algorithms, this indicator offers a reliable tool for identifying and validating trends in financial markets. Key Features: Non-Repainting Technology : Unlike traditional indicators prone to repainting, the "No Reversal Accumatrix AI" utilizes innovative algorithms to provide accurate trend co
This indicator uses the metaquotes ZigZag indicator as base to plot fibonacci extension and fibonacci retracement based in the Elliot waves. A fibonacci retracement will be plotted on every wave draw by the ZigZag. A fibonacci extension will be plotted only after the 2nd wave. Both fibonacci will be updated over the same wave tendency. Supporting until 9 consecutive elliot waves. Parameters: Depth: How much the algorithm will iterate to find the lowest and highest candles Deviation: Amoun
Double HMA MTF for MT5
Pavel Zamoshnikov
3.67 (3)
This is an advanced multi-timeframe version of the popular Hull Moving Average (HMA) Features Two lines of the Hull indicator of different timeframes on the same chart. The HMA line of the higher timeframe defines the trend, and the HMA line of the current timeframe defines the short-term price movements. A graphical panel with HMA indicator data from all timeframes at the same time . If the HMA switched its direction on any timeframe, the panel displays a question or exclamation mark with a tex
Einzigartiger Indikator, der einen professionellen und quantitativen Ansatz für Mean-Reversion-Trading umsetzt. Es nutzt die Tatsache, dass der Preis auf vorhersehbare und messbare Weise umlenkt und zum Mittelwert zurückkehrt, was klare Ein- und Ausstiegsregeln ermöglicht, die nicht-quantitative Handelsstrategien bei weitem übertreffen. [ Installation Guide | Update Guide | Troubleshooting | FAQ | All Products ] Klare Handelssignale Erstaunlich einfach zu handeln Anpassbare Farben und Größen I
Eine der Zahlenfolgen heißt „Forest Fire Sequence“. Es wurde als eine der schönsten neuen Sequenzen anerkannt. Sein Hauptmerkmal ist, dass diese Sequenz lineare Trends vermeidet, selbst die kürzesten. Diese Eigenschaft bildete die Grundlage dieses Indikators. Bei der Analyse einer Finanzzeitreihe versucht dieser Indikator, alle möglichen Trendoptionen abzulehnen. Und nur wenn er scheitert, dann erkennt er das Vorhandensein eines Trends und gibt das entsprechende Signal. Dieser Ansatz ermöglicht
The indicator detects divergence signals - the divergences between the price peaks and the MACD oscillator values. The signals are displayed as arrows in the additional window and are maintained by the messages in a pop-up window, e-mails and push-notifications. The conditions which formed the signal are displayed by lines on the chart and in the indicator window. The indicator parameters MacdFast - fast MACD line period MacdSlow - slow MACD line period MacdSignal - MACD signal line period Mac
Fit line supports to extrapolation next movement of market, support for buy/sell decision. Indicator using spline algorithm to extrapolation.  You can change number of spline with parameter "PointsNumber" and number of extrapolation point with "ExtrapolateBars". Eextrapolation points will be save into csv format, with prefix in parameter "PointsPrefix", and store in folder File of Data Folder.
Dieser indikator zeigt eine kerze kombination basierend auf dodge, dodge und pin bar. Die Logik des Musters besteht darin, nach der Unsicherheit auf der Seite der Macht zu sein. Der Indikator ist universell und nützlich für den Handel mit binären Optionen, Forex, ETF, Kryptowährung, Aktien. Der Indikator unterstützt Zeitrahmen von M5 bis MN einschließlich Nicht-Standard-TF in MT5 vorgestellt.(M5,M6,M10,M12, M15, M20, M30, H1, H2, H3, H4, H6, H8, H12, D1, W1, MN). Realisiert die Möglichkeit, akti
Der iPump-Indikator ist ein vielseitiger Indikator, der die Vorteile von drei Kategorien von Indikatoren kombiniert. gleichzeitige Trenderkennung auf mehreren TFs Definition von Widerstands- und Unterstützungszonen Bestimmung von überkauften und überverkauften Zonen Anzeigefunktionen: Einen Trend definieren Diese Funktion wird für alle Trader notwendig sein, die die aktuelle Marktrichtung objektiv einschätzen und Subjektivität vermeiden möchten. In Sekundenbruchteilen können Sie die Richtun
Introduction The "Two Moving Average Crossover" indicator for MetaTrader 5 (MT5) is a technical analysis tool that displays two moving averages and notifies when the moving averages cross each other. The indicator calculates and plots two moving averages, one of which is faster and the other is slower. When the faster moving average crosses above the slower moving average, it is considered a bullish signal, indicating a potential trend reversal or the start of a new uptrend. Conversely, when th
Indicator and Expert Adviser  EA Available in the comments section of this product. Download with Indicator must have indicator installed for EA to work. Mt5 indicator alerts for bollinger band and envelope extremes occurring at the same time. Buy signal alerts occur when A bullish candle has formed below both the lower bollinger band and the lower envelope  Bar must open and close below both these indicators. Sell signal occur when A bear bar is formed above the upper bollinger band and upp
Käufer dieses Produkts erwarben auch
Atomic Analyst MT5
Issam Kassas
5 (13)
Zunächst einmal ist es erwähnenswert, dass dieser Handelsindikator nicht neu malt, nicht neu zeichnet und keine Verzögerung aufweist, was ihn sowohl für manuellen als auch für Roboterhandel ideal macht. Benutzerhandbuch: Einstellungen, Eingaben und Strategie. Der Atom-Analyst ist ein PA-Preisaktionsindikator, der die Stärke und das Momentum des Preises nutzt, um einen besseren Vorteil auf dem Markt zu finden. Ausgestattet mit fortschrittlichen Filtern, die helfen, Rauschen und falsche Signale z
Zunächst einmal ist es wichtig zu betonen, dass dieses Handelssystem ein Nicht-Repainting-, Nicht-Redrawing- und Nicht-Verzögerungsindikator ist, was es sowohl für manuelles als auch für automatisches Trading ideal macht. Online-Kurs, Handbuch und Vorlagen herunterladen. Das "Smart Trend Trading System MT5" ist eine umfassende Handelslösung, die für neue und erfahrene Trader maßgeschneidert ist. Es kombiniert über 10 Premium-Indikatoren und bietet mehr als 7 robuste Handelsstrategien, was es zu
FX Volume MT5
Daniel Stein
4.94 (17)
Erhalten Sie Ihr tägliches Marktupdate mit Details und Screenshots über unser Morning Briefing hier auf mql5 und auf Telegram ! FX Volume ist der ERSTE und EINZIGE Volumenindikator, der einen ECHTEN Einblick in die Marktstimmung aus Sicht eines Brokers bietet. Es bietet fantastische Einblicke in die Positionierung von institutionellen Marktteilnehmern, wie z.B. Brokern, auf dem Forex-Markt, viel schneller als COT-Berichte. Diese Informationen direkt auf Ihrem Chart zu sehen, ist der wahre Game
Reversal First Impulse levels (RFI)      INSTRUCTIONS        RUS       -       ENG              R ecommended to use with an indicator   -   TREND PRO -  Version MT4                 A key element in trading is zones or levels from which decisions to buy or sell a trading instrument are made. Despite attempts by major players to conceal their presence in the market, they inevitably leave traces. Our task was to learn how to identify these traces and interpret them correctly. Main functions:: Di
TPSproTREND PrO MT5
Roman Podpora
4.86 (7)
TPSpro TRENDPRO  - is a trend indicator that automatically analyzes the market and provides information about the trend and each of its changes, as well as giving signals for entering trades without redrawing! The indicator uses each candle, analyzing them separately. referring to different impulses - up or down impulse. Exact entry points into transactions for currencies, crypto, metals, stocks, indices!  -  Version MT4               DETAILED DESCRIPTION               R ecommended to use with
Quantum Trend Sniper
Bogdan Ion Puscasu
5 (41)
Wir stellen vor       Quantum Trend Sniper Indicator   , der bahnbrechende MQL5-Indikator, der die Art und Weise, wie Sie Trendumkehrungen erkennen und handeln, verändert! Entwickelt von einem Team erfahrener Händler mit über 13 Jahren Handelserfahrung,       Quantum Trend Sniper-Indikator       wurde entwickelt, um Ihre Trading-Reise mit seiner innovativen Methode zur Identifizierung von Trendumkehrungen mit extrem hoher Genauigkeit auf ein neues Niveau zu heben. ***Kaufe Quantum Trend Snipe
RelicusRoad Pro MT5
Relicus LLC
4.82 (22)
Jetzt 147 US -Dollar (nach ein paar Aktualisierungen auf 499 US -Dollar) - Unbegrenzte Konten (PCs oder MACs) RelicusRoad Benutzerhandbuch + Schulungsvideos + Zugang zur privaten Discord-Gruppe + VIP-Status EINE NEUE ART, DEN MARKT ZU BETRACHTEN RelicusRoad ist der weltweit leistungsstärkste Handelsindikator für Forex, Futures, Kryptowährungen, Aktien und Indizes und gibt Händlern alle Informationen und Tools, die sie benötigen, um profitabel zu bleiben. Wir bieten technische Analysen un
XQ Indicator MetaTrader 5
Marzena Maria Szmit
5 (1)
Step into the realm of Forex trading with confidence and precision using XQ, a cutting-edge Forex indicator designed to elevate your trading game to unprecedented heights. Whether you're a seasoned trader or just stepping into the world of currency exchange, XQ Forex Indicator empowers you with the insights and signals needed to make informed trading decisions. The signal conditions are a combination of three indicators, and XQ Forex Indicator only display  medium and long-term trends . The ind
Bill Williams Advanced
Siarhei Vashchylka
5 (5)
Bill Williams Advanced is designed for automatic chart analysis using Bill Williams' "Profitunity" system. The indicator analyzes four timeframes at once. Manual (Be sure to read before purchasing) Advantages 1. Automatically analyzes the chart using the "Profitunity" system of Bill Williams. The found signals are placed in a table in the corner of the screen. 2. Equipped with a trend filter based on the Alligator indicator. Most of the system signals are recommended to be used only accordi
FX Power MT5 NG
Daniel Stein
5 (5)
Erhalten Sie Ihr tägliches Marktupdate mit Details und Screenshots über unser Morning Briefing hier auf mql5 und auf Telegram ! FX Power MT5 NG ist die nächste Generation unseres langjährig sehr beliebten Währungsstärkemessers FX Power. Und was bietet dieser Stärkezähler der nächsten Generation? Alles, was Sie am ursprünglichen FX Power geliebt haben PLUS GOLD/XAU-Stärkeanalyse Noch präzisere Berechnungsergebnisse Individuell konfigurierbare Analysezeiträume Anpassbares Berechnungslimit für noc
Dragon Multi Indicator MT5
Mansour Babasafary
5 (4)
3 Indicators in 1 indicator Strategy based on price action Made specifically for the best forex currency pairs Can be used in the best time frame of the market at a very reasonable price This indicator is basically 3 different indicatos . But we have combined these 3 indicators in 1 indicator so that you can use 3 indicators at the lowest price. All three strategies are based on price action. But based on different trends. Long term, medium term and short term Attributes : No repaintin
Wir stellen vor       Quantum Breakout PRO   , der bahnbrechende MQL5-Indikator, der die Art und Weise, wie Sie mit Breakout-Zonen handeln, verändert! Entwickelt von einem Team erfahrener Händler mit über 13 Jahren Handelserfahrung,       Quantum Breakout PRO       ist darauf ausgelegt, Ihre Handelsreise mit seiner innovativen und dynamischen Breakout-Zone-Strategie auf ein neues Niveau zu heben. Der Quantum Breakout Indicator zeigt Ihnen Signalpfeile auf Breakout-Zonen mit 5 Gewinnzielzone
"Piranha" - an autonomous trading system that determines overbought and oversold levels on the chart. Red and blue zones represent overbought and oversold levels respectively. Entry points are marked with arrows: a downward arrow in the red zone for "sell" and an upward arrow in the blue zone for "buy". The Take profit level is indicated by the green moving average. Key features: Adjusting the Take profit level as the green moving average changes position. Averaging ability when a new market e
Advanced Supply Demand MT5
Bernhard Schweigert
4.53 (15)
Derzeit 33% Rabatt! Die beste Lösung für jeden Anfänger oder erfahrenen Händler! Dieser Indikator ist ein einzigartiges, qualitativ hochwertiges und erschwingliches Trading-Tool, da wir eine Reihe von proprietären Funktionen und eine neue Formel integriert haben. Mit diesem Update werden Sie in der Lage sein, doppelte Zeitrahmenzonen anzuzeigen. Sie können nicht nur einen höheren TF (Zeitrahmen) anzeigen, sondern sowohl den Chart-TF als auch den höheren TF: SHOWING NESTED ZONES. Alle Supply Dema
Introducing the South African Sniper indicator created by a small group of traders with a few years trading trading the financial market profitably . This is a plug and play indicator that provides you with  BUY and SELL (SNIPER ENTRY) signals with TARGET and trail stops. The indicator Works with all MT5 trading instruments. The indicator uses previous  chart data as receipt to speculate on future market moves.  "The South African Sniper indicator community are very happy with the indicator an
The Price Action Finder Multi indicator is an indicator of entry points that searches for and displays Price Action system patterns on dozens of trading instruments and on all standard time frames: (m1, m5, m15, m30, H1, H4, D1, Wk, Mn). The indicator places the found patterns in a table at the bottom of the screen. By clicking on the pattern names in the table, you can move to the chart where this pattern is located. Manual (Be sure to read before purchasing) | Version for MT4 Advantages 1. Pa
Der Forex TPA Indikator deckt die wahren Aktionen der Marktmacher auf, immer dann wenn sie passieren. "Kämpfe nicht gegen die Marktmacher an, sondern folge ihnen", ist wohl der beste Rat, den ein Trader bekommen kann. Der TPA Indikator zeigt jedesmal seine Signale an wenn die Bullen definitiv stärker sind als die Bären und umgekehrt. Dieser Indikator wurde VON Tradern FÜR Trader gemacht und ist 100% NICHT NACHZEICHNEND! Signale werden STRENG am Schluss einer Kerze  generiert. Das sagen unsere Ku
IVISTscalp5
Vadym Zhukovskyi
5 (3)
Wir stellen Ihnen den iVISTscalp5-Indikator vor, der nicht nur einzigartig, sondern auch effektiv im Handel ist. Dieser Indikator basiert auf Zeitdaten und ist das Ergebnis jahrelanger Erfahrung und eingehender Analyse der Finanzmärkte. Der iVISTscalp5-Indikator ist ein ausgezeichnetes Werkzeug für manuellen Handel. Bequemlichkeit, Einfachheit und Visualisierung - die gesamte Komplexität ist verborgen. Wir haben die Einstellungen und Verwendung des iVISTscalp5-Indikators auf das Maximum vereinfa
Dies ist wahrscheinlich der vollständigste Indikator für die automatische Erkennung der harmonischen Preisbildung, den Sie für die MetaTrader-Plattform finden können. Es erkennt 19 verschiedene Muster, nimmt Fibonacci-Projektionen genauso ernst wie Sie, zeigt die potenzielle Umkehrzone (PRZ) an und findet geeignete Stop-Loss- und Take-Profit-Werte. [ Installationsanleitung | Update-Anleitung | Fehlerbehebung | FAQ | Alle Produkte ] Es erkennt 19 verschiedene harmonische Preisbildungen Dar
"The Squeeze indicator attempts to identify periods of consolidation in a market. In general the market is either in a period of quiet consolidation or vertical price discovery. By identifying these calm periods, we have a better opportunity of getting into trades with the potential for larger moves. Once a market enters into a "squeeze," we watch the overall market momentum to help forecast the market direction and await a release of market energy." The Modified TTM Squeeze Indicator is a modi
Golden Spikes Detector
Batsirayi L Marango
5 (1)
Golden Spikes Detector This indicator is based on an advanced strategy primarily for trading spikes on Boom and Crash Indices. Complex algorithms were implemented to detect high probability entries only. It alerts on potential Buy and Sell entries. To trade spikes on the Deriv or Binary broker, only take Buy Boom and Sell Cash alerts. It was optimised to be loaded on 5-minute timeframe although multiple timeframe analysis is done in the background. Features ·             Desktop pop up and sound
Dies ist ein Indikator für MT5, der genaue Signale für den Einstieg in einen Handel ohne Repainting (Neuzeichnen) liefert. Er kann auf alle Finanzwerte angewendet werden: Forex, Kryptowährungen, Metalle, Aktien, Indizes. Er liefert ziemlich genaue Schätzungen und sagt Ihnen, wann es am besten ist, eine Position zu eröffnen und zu schließen. Sehen Sie sich das Video (6:22) mit einem Beispiel für die Verarbeitung nur eines Signals an, das sich für den Indikator gelohnt hat! Die meisten Händler ver
Gartley Hunter Multi
Siarhei Vashchylka
5 (6)
Gartley Hunter Multi - An indicator for searching for harmonic patterns simultaneously on dozens of trading instruments and on all possible timeframes. Manual (Be sure to read before purchasing) | Version for MT4 Advantages 1. Patterns: Gartley, Butterfly, Shark, Crab. Bat, Alternate Bat, Deep Crab, Cypher 2. Simultaneous search for patterns on dozens of trading instruments and on all possible timeframes 3. Search for patterns of all possible sizes. From the smallest to the largest 4. A
FxaccurateLS
Shiv Raj Kumawat
WHY IS OUR FXACCCURATE LS MT5 THE PROFITABLE ? PROTECT YOUR CAPITAL WITH RISK MANAGEMENT Gives entry, stop and target levels from time to time. It finds Trading opportunities by analyzing what the price is doing during established trends. POWERFUL INDICATOR FOR A RELIABLE STRATEGIES We have made these indicators with a lot of years of hard work. It is made at a very advanced level. Established trends provide dozens of trading opportunities, but most trend indicators completely ignore them!
Golden Gate Algo MT5
James David Lane
4 (6)
40% RABATT ZU WEIHNACHTEN! PREISERHÖHUNG AUF $250 AM 1. JANUAR! Vorstellung von GoldenGate Entries: Eine hochmoderne Handelslösung! Entdecken Sie einen revolutionären Ansatz zum Handel mit GoldenGate Entries (GGE), einem fortschrittlichen Indikator, der entwickelt wurde, um Ihr Handelserlebnis zu verbessern. GGE bietet eine umfassende Palette von Funktionen, um Benutzer mit Präzision und Vertrauen in ihren Handelsentscheidungen auszustatten. Paare: Beliebig (FX - Rohstoffe - Aktien - Akti
Professional Scalping Tool on Deriv Attention! The indicator will be sold in limited quantities!!! The previous 5 copies were sold for $250 The remaining 4 copies will be sold for $350 The next price is $500 Description: This trading indicator is designed for professional traders focused on scalping. Designed with the market in mind, it provides highly accurate spike trading signals. It works on the M1 timeframe and supports the following symbols: Boom 300 Index, Boom 500 Index, Boom 1000 I
The Volume by Price Indicator for MetaTrader 5 features Volume Profile and Market Profile TPO (Time Price Opportunity). Volume and TPO histogram bar and line charts. Volume Footprint charts. TPO letter and block marker collapsed and split structure charts. Session filtering and grouping. Static, dynamic and flexible range segmentation and compositing methods with relative and absolute visualizations. Graphical layering, positioning and styling options to suit the user's analytic and aesthetic n
MetaForecast M5
Vahidreza Heidar Gholami
5 (2)
MetaForecast prognostiziert und visualisiert die Zukunft eines beliebigen Marktes basierend auf den Harmonien in den Preisdaten. Obwohl der Markt nicht immer vorhersehbar ist, kann MetaForecast, wenn es ein Muster im Preis gibt, die Zukunft so genau wie möglich voraussagen. Im Vergleich zu ähnlichen Produkten kann MetaForecast durch die Analyse von Markttrends genauere Ergebnisse erzeugen. Eingabeparameter Past size (Vergangene Größe) Gibt an, wie viele Balken MetaForecast verwendet, um ein Mo
Die beste Lösung für jeden Newbie oder Expert Trader! Dieser Indikator ist ein einzigartiges, qualitativ hochwertiges und erschwingliches Trading-Tool, da wir eine Reihe von proprietären Funktionen und eine neue Formel integriert haben. Mit nur EINEM Chart können Sie die Währungsstärke für 28 Forex-Paare ablesen! Stellen Sie sich vor, wie sich Ihr Handel verbessern wird, weil Sie in der Lage sind, den genauen Auslösungspunkt eines neuen Trends oder einer Scalping-Gelegenheit zu erkennen. Be
Fibonacci Suavizado
Cesar Juan Flores Navarro
Indicador en MQL5, que obtiene el promedio de 10 EMAS, que son alineadas según Fibonacci, obteniendo un promedio, que sera suavizado.  Se puede ingresar un numero desde 2 a N, que multiplica a los EMA-Fibonacci. Funciona en cualquier criptomoneda, etc. etc... pudiendo calcular el futuro segun la tendencia de las EMAS. Funciona excelentemente en tramos largos, determinando exactamente el mejor inicio/salida. El precio inicial por apertura sera por un periodo de tiempo, luego aumentará.
Weitere Produkte dieses Autors
This script allows selecting the TakeProfit and StopLoss levels. It analyzes the history data, and then calculates the probability of reaching a given price level. How the script works Suppose you have a trading strategy and you want to select the TakeProfit and StopLoss levels. Run the script and set the parameter: Number of Bars - the average position holding time in bars. Once the script operation is complete, the AIS-PPL.csv file will be created in the Files folder in the terminal data cat
FREE
MinDeposit MT5
Aleksej Poljakov
3 (1)
The script analyzes the history of quotes and gives recommendations on the minimum deposit. The calculations take into account the variability of prices and the standard deviation. Margin requirements for the instrument are also taken into account. The result of the script is the minimum recommended deposit for trading the given currency pair.
FREE
Das Skript basiert auf der Simulation von Handelsgeschäften mit einem Zufallsgenerator. Auf diese Weise erhalten Sie auch bei gleichen Eingabeparametern völlig unterschiedliche Ergebnisse. Wenn Sie das Skript ausführen, wird ein Dialogfeld geöffnet, in dem Sie die gewünschten Werte für externe Variablen festlegen können. Im Block TradingOptions werden die grundlegenden Parameter definiert, die zur Simulation des Handels benötigt werden. StartBalance - legt die Anfangsgröße der Handelsbilanz fes
FREE
AIS Money Management MT5
Aleksej Poljakov
5 (1)
Das Skript basiert auf der Simulation von Handelsgeschäften mit einem Zufallsgenerator. Auf diese Weise erhalten Sie auch bei gleichen Eingabeparametern völlig unterschiedliche Ergebnisse. Wenn Sie das Skript ausführen, wird ein Dialogfeld geöffnet, in dem Sie die gewünschten Werte für externe Variablen festlegen können. Im Block  TradingOptions  werden die grundlegenden Parameter definiert, die zur Simulation des Handels benötigt werden. StartBalance  - legt die Anfangsgröße der Handelsbilanz
FREE
Dieses Skript ist so konzipiert, dass der Händler die durchschnittliche Dauer von Handelsgeschäften bestimmen kann, bei der das Verhältnis von möglichen Gewinnen und Verlusten optimal ist. Betrachten wir zunächst den allgemeinen Ansatz zur Bestimmung der optimalen Dauer von Handelsgeschäften. Wir führen die folgenden Variablen ein: R  - das Ergebnis der Transaktion; T  - die Zeit, während der die Transaktion offen war; W  - Die Zeit zwischen dem Abschluss der vorherigen und dem Öffnen der nächst
FREE
MinDeposit
Aleksej Poljakov
5 (1)
The script analyzes the history of quotes and gives recommendations on the minimum deposit. The calculations take into account the variability of prices and the standard deviation. Margin requirements for the instrument are also taken into account. The result of the script is the minimum recommended deposit for trading the given currency pair.
FREE
This script allows selecting the TakeProfit and StopLoss levels. It analyzes the history data, and then calculates the probability of reaching a given price level. How the script works Suppose you have a trading strategy and you want to select the TakeProfit and StopLoss levels. Run the script and set the parameter: Number of Bars - the average position holding time in bars. Once the script operation is complete, the AIS-PPL.csv file will be created in the Files folder in the terminal data cat
FREE
Dieses Skript ist so konzipiert, dass der Händler die durchschnittliche Dauer von Handelsgeschäften bestimmen kann, bei der das Verhältnis von möglichen Gewinnen und Verlusten optimal ist. Betrachten wir zunächst den allgemeinen Ansatz zur Bestimmung der optimalen Dauer von Handelsgeschäften. Wir führen die folgenden Variablen ein: R - das Ergebnis der Transaktion; T - die Zeit, während der die Transaktion offen war; W - Die Zeit zwischen dem Abschluss der vorherigen und dem Öffnen der nächsten
FREE
Die Auswahl der StopLoss- und TakeProfit-Stufen kann sich sehr stark auf die Gesamtperformance des Handels auswirken. Neben den offensichtlichen Parametern einer Transaktion - der Größe eines möglichen Gewinns oder wahrscheinlichen Verlusts - wirken sich die StopLoss- und TakeProfit-Werte auch auf die erwartete Dauer der Transaktion und die Rentabilität des Handels im Allgemeinen aus. Wenn Sie die optimale Transaktionsdauer bereits mithilfe des „ AIS-ODT “ -Skripts ermittelt haben, können Sie mi
FREE
The script allows selecting the required 'Filter level' value of the AIS-MTF indicator. Run the script on the required chart and selected timeframe. Once its operation is complete, the HPS.csv file will be created in the Files folder. Open the file. You will see three columns. The 'Filter lvl' column represents the value of the 'Filter level' for the AIS-MTF indicator. Am. dev. - degree and direction of the indicator's deviation from the price level (sorted in ascending order). Negative values i
FREE
The script allows selecting the required 'Filter level' value of the AIS-MTF MT5 indicator. Run the script on the required chart and selected timeframe. Once its operation is complete, the HPS.csv file will be created in the Files folder. Open the file. You will see three columns. The 'Filter lvl' column represents the value of the 'Filter level' for the AIS-MTF indicator. Am. dev. - degree and direction of the indicator's deviation from the price level (sorted in ascending order). Negative valu
FREE
Mit dem Indikator AIS Correct Averages können Sie den Beginn einer Trendbewegung auf dem Markt festlegen. Eine weitere wichtige Eigenschaft des Indikators ist ein klares Signal für das Ende des Trends. Der Indikator wird nicht neu gezeichnet oder neu berechnet. Angezeigte Werte h_AE - Obergrenze des AE-Kanals l_AE - untere Grenze des AE-Kanals h_EC - Hoher vorhergesagter Wert für den aktuellen Balken l_EC - Niedriger vorhergesagter Wert für den aktuellen Balken Signale beim Arbeiten m
Der Indikator AIS Weighted Moving Average berechnet einen gewichteten gleitenden Durchschnitt und ermöglicht es Ihnen, den Beginn einer Trendmarktbewegung zu bestimmen. Die Gewichtskoeffizienten werden unter Berücksichtigung der Besonderheiten jedes Barrens berechnet. Auf diese Weise können Sie zufällige Marktbewegungen herausfiltern. Das Hauptsignal, das den Beginn eines Trends bestätigt, ist eine Richtungsänderung der Indikatorlinien und der Preis, der die Indikatorlinien kreuzt. WH (bl
Der AIS Advanced Grade Machbarkeitsindikator soll die Niveaus vorhersagen, die der Preis in der Zukunft erreichen könnte. Seine Aufgabe ist es, die letzten drei Balken zu analysieren und darauf basierend eine Prognose zu erstellen. Der Indikator kann für jeden Zeitrahmen und jedes Währungspaar verwendet werden. Mit Hilfe von Einstellungen erreichen Sie die gewünschte Qualität der Prognose. Vorhersagetiefe - legt die gewünschte Vorhersagetiefe in Balken fest. Es wird empfohlen, diesen Paramete
The indicator is designed to measure the price volatility. This allows determining the moments for opening or closing trade positions more accurately. High intensity of the market indicates the instability of its movement, but allows for better results. And, conversely, low intensity of the market indicates the stability of its movement. Parameters Bars to process - the number of bars to measure the price movements. A low value of this parameter allows determining the moments of rapid price mo
This indicator uses the Fibonacci p-numbers to smooth a price series. This allows combining the advantages of the simple and exponential moving averages. The smoothing coefficients depend on the level of the p-number, which is set in the indicator parameters. The higher the level, the greater the influence of the simple moving average and the less significant the exponential moving average. Parameters Fibonacci Numbers Order - order of the Fibonacci p-number, specified by trader. Valid values
The indicator is based on the analysis of interaction of two filters. The first filter is the popular Moving Average. It helps to identify linear price movements and to smooth minor price fluctuations. The second filter is the Sliding Median. It is a non-linear filter. It allows to filter out noise and single spikes in the price movement. A predictive filter implemented in this indicator is based on the difference between these filters. The indicator is trained during operation and is therefore
This indicator studies the price action as a combination of micro-trends. All micro-trends are analyzed and averaged. Price movement is filtered based on this averaging. IP_High and IP_Low (blue and red dashed lines) show the instantaneous price movement. They display the forecast only for the current price values, taking into account only the number of bars defined by the 'Filter level' parameter. SP_High and SP_Low (blue and red solid lines) smooth the price movements with respect to history.
Dieser Indikator implementiert einen einfachen linearen Glättungsprozess. Einer der Nachteile der exponentiellen Glättung ist das schnelle Abklingen des Signals. Dies macht es unmöglich, langfristige Trends in der Preisspanne vollständig zu verfolgen. Mit der linearen Glättung können Sie die Signalfilterung genauer und feiner einstellen. Der Indikator wird durch Auswahl von Parametern konfiguriert: LP - Mit diesem Parameter können Sie die Glättungszeit auswählen. Je größer sein Wert, dest
Dieser Indikator ist ein sequenzieller Hybridfilter, der auf einer Kombination von Median- und Gleitmittelwert-Eigenschaften basiert. Durch die Verwendung des Medianwerts können abnormale Ausreißer und zufällige Impulse in den Werten der Preisreihe herausgefiltert werden. Gleichzeitig wirkt sich der Medianfilter nicht auf den Trend der Preisbewegung aus und lässt ihn unverändert. Da der Medianfilter nichtlinear ist, werden die Werte mit einem einfachen gleitenden Durchschnitt gemittelt. Diese
Dieser Indikator ist eine Kombination aus zwei modifizierten Lanczos-Filtern. Der erste Filter dient zur Extrapolation des Preises. Auf der Grundlage vergangener Werte prognostiziert er eine mögliche Kursbewegung innerhalb der aktuellen Bar. Das heißt, es zeigt, was der Preis wäre, wenn die Trends der Vergangenheit unverändert blieben. Der zweite Filter zum Glätten und Mitteln der Preise innerhalb des Fensters, bestimmt durch den Filterpegel. Durch die Auswahl der Gewichte reagiert dieser Filter
Betrachten wir die Art der Preisänderungen auf dem Forex-Markt, ohne auf die Gründe zu achten, warum diese Änderungen auftreten. Mit diesem Ansatz können wir die Hauptfaktoren identifizieren, die die Preisbewegung beeinflussen. Nehmen wir zum Beispiel die Eröffnungskurse von Barren für das Währungspaar EUR-USD und den Zeitraum für das erste Halbjahr. Für diese Preise konstruieren wir das Lameray-Diagramm (Abbildung 1). In diesem Diagramm ist ersichtlich, dass die Preisbewegung grundsätzlich nach
Dieser Indikator ist informativer. Seine Arbeit basiert auf der Annahme, dass die Preisbewegung auf dem Markt als Rauschen einer bestimmten Farbe dargestellt werden kann, das von den Parametern der Verteilung der Preiswerte abhängt. Dadurch ist es möglich, die Preisänderung aus verschiedenen Blickwinkeln zu analysieren und die Preisbewegung als Rauschen einer bestimmten Farbe zu betrachten, Informationen über den aktuellen Stand des Marktes zu erhalten und eine Prognose über das Preisverhalten
Trotz einiger Nachteile des Indikators „ AIS Color Noise Filter “ erscheint die Idee, ihn zur Glättung der Preisreihen und der prognostizierten Preise zu verwenden, recht attraktiv. Dies hat mehrere Gründe: Erstens ermöglicht die Berücksichtigung mehrerer Lärmkomponenten die Erstellung einer Prognose auf Grundlage voneinander unabhängiger Faktoren, wodurch die Prognosequalität verbessert werden kann. zweitens verhalten sich die Rauschmerkmale der Preisreihen über die gesamte Historie hinweg rec
Sehr häufig werden bei der Untersuchung von Finanzreihen deren Glättungen angewendet. Mit der Glättung können Sie hochfrequente Komponenten entfernen - es wird angenommen, dass sie durch zufällige Faktoren verursacht werden und daher irrelevant sind. Die Glättung beinhaltet immer eine Art der Mittelung der Daten, bei der sich zufällige Änderungen in den Zeitreihen gegenseitig absorbieren. Zu diesem Zweck werden meist einfache oder gewichtete gleitende Durchschnittsmethoden sowie eine exponentie
Um langfristige und nicht zufällige Komponenten zu isolieren, muss nicht nur bekannt sein, um wie viel sich der Preis geändert hat, sondern auch, wie sich diese Änderungen ereignet haben. Mit anderen Worten - wir interessieren uns nicht nur für die Werte der Preisniveaus, sondern auch für die Reihenfolge, in der sich diese Niveaus gegenseitig ersetzen. Durch diesen Ansatz kann man langfristige und stabile Faktoren finden, die die Preisänderung zu einem bestimmten Zeitpunkt beeinflussen (oder be
Eine der leistungsstarken Analysemethoden ist die Modellierung von Finanzreihen mithilfe von Levy-Prozessen. Der Hauptvorteil dieser Prozesse besteht darin, dass mit ihnen eine Vielzahl von Phänomenen modelliert werden kann - von den einfachsten bis zu den komplexesten. Es genügt zu sagen, dass die Idee der fraktalen Preisbewegung auf dem Markt nur ein Sonderfall von Levy-Prozessen ist. Andererseits kann bei richtiger Auswahl der Parameter jeder Levy-Prozess als einfacher gleitender Durchschnit
Sehr oft steht der Händler vor der Aufgabe, das Ausmaß zu bestimmen, in dem sich der Preis in naher Zukunft ändern kann. Zu diesem Zweck können Sie die Johnson-Verteilungsart SB verwenden. Der Hauptvorteil dieser Verteilung besteht darin, dass sie auch mit einer kleinen Menge von akkumulierten Daten verwendet werden kann. Der empirische Ansatz zur Bestimmung der Parameter dieser Verteilung ermöglicht es Ihnen, das maximale und minimale Niveau des Preiskanals genau zu bestimmen. Diese Werte könn
Mit diesem Indikator können Sie die Wahrscheinlichkeit bestimmen, mit der der Preis das eine oder andere Niveau erreicht. Der Algorithmus ist recht einfach und basiert auf der Verwendung statistischer Daten zum Preisniveau eines bestimmten Währungspaares. Dank der gesammelten historischen Daten ist es möglich, das Ausmaß zu bestimmen, in dem sich der Preis während des aktuellen Balkens ändert. Trotz seiner Einfachheit kann dieser Indikator beim Handel von unschätzbarem Wert sein. Mit seiner Hil
Auswahl:
Keine Bewertungen
Antwort auf eine Rezension
Version 4.0 2022.09.06
Fibonacci- und Carré-Rouye-Fenster hinzugefügt
Version 3.0 2022.08.11
Einige Fenster verbessert
Version 2.0 2022.06.01
Neue Fensterfunktionen hinzugefügt, einige Änderungen in den Berechnungen vorgenommen.