• Übersicht
  • Bewertungen (1)
  • Diskussion (2)

Regression

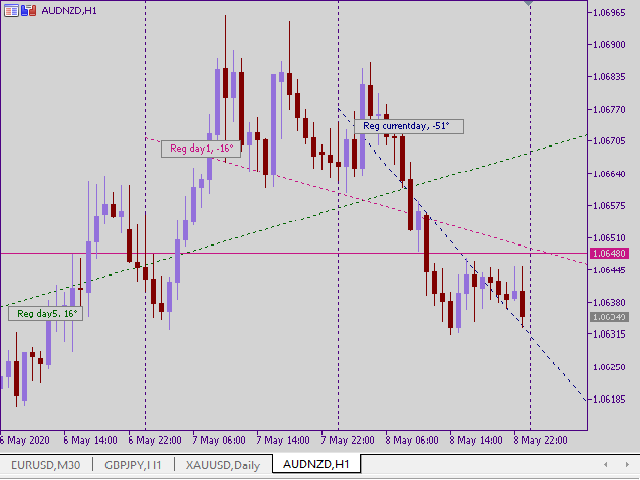
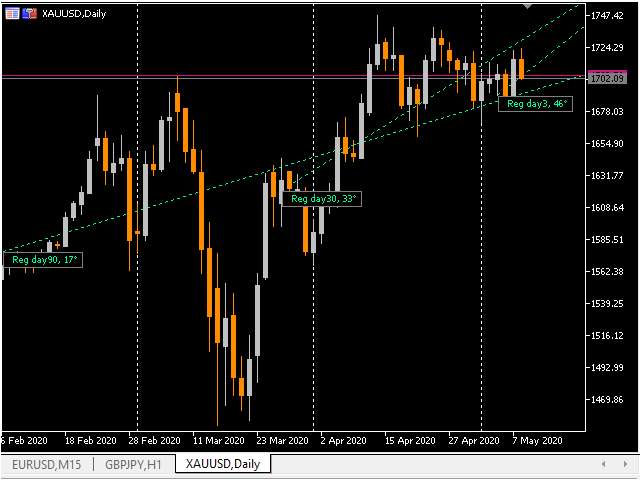
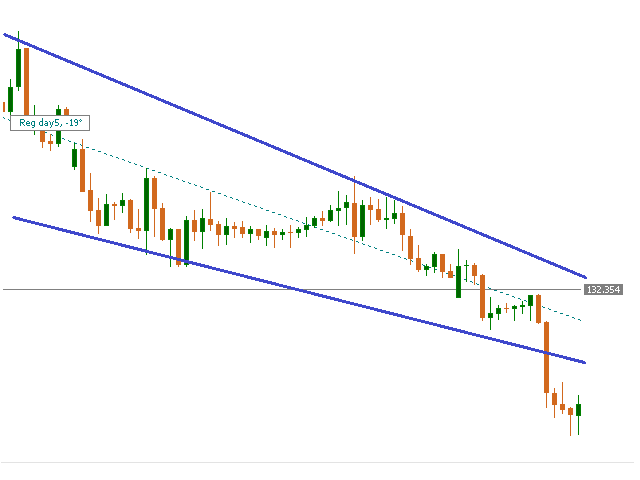
Der Regressionsindikator zeigt die Richtung des Trends an. Die Grafik zeigt bis zu 3 Regressionslinien mit unterschiedlichen Zeiträumen. Die gerade Linie wird als Durchschnitt innerhalb des Wellenkanals der Preisbewegung gebildet (auf einem Screenshot gezeigt).

In diesem Fall können Sie jede der Zeilen deaktivieren. Mit dem Indikator können Sie auch die Farbe für jede Linie ändern. Es ist interessant, den relativen Winkel in Grad zu berechnen. Die Winkelanzeige kann auch ausgeschaltet werden.

Dank dieses Indikators können Sie die Dynamik von Trendänderungen im Laufe der Zeit sehen.
Empfohlene Produkte
High And Low MT5
Dmitriy Parfenovich
On the current chart, this indicator displays candlestick highs and lows of another time frame. Input Parameters: TimeFrame - chart time frame whose data will be displayed on the current price chart (by default, H12). Time Zone - shift of the indicator by time zone relative to the broker's time (by default, Broker-1). If the broker's time zone is UTC+1 and the Time Zone parameter is set to Broker-1, the bends of the indicator will be plotted in multiples of Greenwich Time. Indicator buffer value
FIBO Trend PRO mt5
Evgenii Aksenov
5 (4)
The indicator allows you to instantly determine the current trend by color and FIBO levels. Higher Timeframe the panel shows the current trend of higher periods, helping to determine the strength of the trend. Trade according to the trend when changing the color of candles or trade against the trend when the price hit the extreme levels of the FIBO Trend PRO  indicator   Advantages of the FIBO Trend PRO Indicator never repaint and does not change their values Very easy to use and intuitive App
This Automatic support/resistance indicator calculates various peaks and troughs of the price action, identifies relevant levels and draws support and resistance automatically. It uses the built-in "ZigZag" indicator in Metatrader as a data source hence, very much accurate indicator.  The support and resistance lines are contineusely updated as new levels and formed. The indicator has only 5 parameters to set, and mostly it can be used with the default values:  The description of the settings is
Bar Sequential
Maximiliano Frisione Figueroa
This indicator can help you clearly identify trend changes in both bullish and bearish markets. The indicator compares the closing price of the last candle with the closing price of the candle "X" periods ago (input parameter). In an uptrend, an initial number '1' is plotted if a candle closes higher than the closing of a candle "X" periods ago. In a downtrend, an initial number '1' is plotted if a candle closes below the closing of a candle "X" periods ago. Subsequent numbers are plotted when e
Indicator Name : Fourier Transform Curve Indicator Description : The Fourier Transform Curve Indicator for MetaTrader 5 is a powerful tool that leverages Fourier analysis to depict curves directly on your price chart. It is designed to provide valuable insights into the underlying harmonic components of the price data. Parameters : Input Candle Count : This parameter allows you to specify the number of candles to include in the Fourier transformation calculation. A higher value will capture lon
VolumeDeltaWaves
Stanislav Korotky
5 (1)
This indicator is an extended implementation of Weis waves. It builds Weis waves on absolute volumes (which is the classical approach) or delta of volumes (unique feature) using different methods of wave formation and visualization. It works with real volumes, if available, or with tick volumes otherwise, but also provides an option to use so called "true volume surrogates", as an artificial substitution for missing real volumes (for example, for Forex symbols), which was introduced in correspo
MasterCharts
Alexander Berger
You can think of these indicators as moving pivot points. MasterChartsTrading Price Action Indicators show good price levels to enter or exit a trade. The Blue indicator line serves as a Bullish Trend setter. If your instrument closes above the Blue line, we think about going Long (buying). When your trading instrument closes below the Red line, we think about Shorting (selling). It is very easy to read price action if you have a reference point. These support/resistance lines are there to help
ATR ist ein wichtiger Indikator für jeden Finanzmarkt. Die Abkürzung ATR steht für Average True Range. Dieser Indikator ist ein Instrument zur Bestimmung der Volatilität des Marktes, das ist sein direkter Zweck. ATR zeigt die durchschnittliche Preisbewegung für den gewählten Zeitraum an.  Der Anfangspreis des Indikators ist 63$. Der Preis wird alle 10 Verkäufe   bis zu 179$   steigen. Der ursprüngliche ATR-Indikator ist in vielen Handelsprogrammen enthalten. Der ATR-Indikator ist nicht sehr info
The indicator is the advanced form of the MetaTrader 4 standard Fibonacci tool. It is unique and very reasonable for serious Fibonacci traders. Key Features Drawing of Fibonacci retracement and expansion levels in a few seconds by using hotkeys. Auto adjusting of retracement levels once the market makes new highs/lows. Ability to edit/remove any retracement & expansion levels on chart. Auto snap to exact high and low of bars while plotting on chart. Getting very clear charts even though many ret
Versus USD MT5
Vonjinirina Alfred Randrianiaina
Versus USD berechnet die Preisänderung jeder wichtigen Währung gegenüber dem USD und zeigt eine klare und vergleichende Ansicht ihrer Leistung für jeden Zeitraum oder Balken, der durch den   Cursor   im aktuellen Zeitrahmen des Diagramms mit   Fortschrittsbalken   indiziert ist. Darüber hinaus markiert es einen   Pfeil   auf dem Balken/Zeitraum, in dem die betreffende Währung die   höchste   oder   niedrigste   Veränderungsrate gegenüber dem USD im Vergleich zu anderen Währungen erlebt hat, wodu
Moving Wizard indicator will guide you to work with Trend and give pure Entry point depending on crossing on the chart it work on all currency and all Timeframe you can use it daily or scalping or swing its good with all and This indicator you can make it your strategy  i work on it on H1 Timframe and make a good money you can take alook on it and you see a great resault on chart  .Gold moving is to Know the Trend of price other moving below it mean we looking to sell orders . if above it we loo
The Angle Prices indicator is a tool that calculates the price angle based on price analysis, interpreting the time vector in the form of price points on the price chart. In other words, the X axis and Y axis are represented as price points, so you can actually calculate the angle with two axes of the same dimension. This allows traders to obtain information about the direction of price movement and possible entry or exit points for trades. Let's look at the main characteristics and interpretat
Contact me for instruction, any questions! Introduction V Bottoms and Tops are popular   chart patterns   among traders due to their potential for identifying trend reversals. These patterns are characterized by sharp and sudden price movements, creating a V-shaped or inverted V-shaped formation on the   chart . By recognizing these patterns, traders can anticipate potential shifts in market direction and position themselves accordingly.  V pattern is a powerful bullish/bearish reversal pattern
FibExtender
Syed Oarasul Islam
This Indicator draws Fibonacci Extension levels in two different ways. You can select whether to draw Fibonacci Extension levels based on your favourite ZigZag settings or you can let the indicator to draw Fibonacci Extension  level based on given number of Bars or Candles.  You can also set Mobile and Email notification for your favourite Extension  levels individually. With this indicator you will not have to feel lonely as the it can generate Voice alerts, which will keep you focused on your
SupportResistence
Eduardo Borges Mariani
SupportResistance ist ein dynamischer Unterstützungs- und Widerstandsindikator, der auf dem Hoch und Tief früherer Kerzen basiert. Die Berechnungsparameter sind konfigurierbar. Sie können die Maximal- und Minimalwerte der vorherigen Kerze als Referenz verwenden, oder Sie können die Maximal- und Minimalwerte einer Gruppe vorheriger Kerzen verwenden. Der Indikator verwendet eine rote Linie, um den Widerstand anzuzeigen, und eine grüne Linie, um die Unterstützung anzuzeigen. Wenn eine Unters
This indicator is based on a classic  DeMarker indicator. Multi TimeFrame indicator MTF-DeMarker shows data from the 4 timeframes by your choice. By default this indicator has external parameters: TF1 = 1; TimeFrame2b = true; TF2 = 5; TimeFrame3b = true; TF3 = 15; TimeFrame4b = true; TF4 = 60; InpPeriod = 14; You can change TF1-TF4 in the next limits: TF1 from M1 (1) to H4 (240) TF2 from M5 (5) to D1 (1440) TF3 from M15 (15) to W1 (10080) TF4 from M30 (30) to MN1 (43200) All chosen TFs should be
This indicator is based on the classical indicator Parabolic SAR and will be helpful for those who love and know how to use not a visual but digital representation of the indicator. All MT5 TimeFrames PSAR indicator shows values from each time frames: M1, M2, M3, M4, M5, M6, M10, M12, M15, M20, M30, H1, H2, H3, H4, H6, H8, H12, D1, W1, AND MN1. You will be able to change the main input parameters for each CCI for every TF. Example for M1 sTF1___ = "M1"; pStep1 = 0.02; pMax1 = 0.2; Input para
Best swing
Winsou Cedric Anicet Kpanou
-- BEST SWING  -- L'indicateur BEST SWING est un indicateur technique personnalisé, un excellent outil pour négocier les cassures en fonction des niveaux de support et de résistance horizontaux. L'indicateur BEST SWING utilise une formule complexe en analysant des données de prix autrement incongrues sur les cours de clôture de chaque période, ainsi que les hauts et les bas du prix, afin de donner un aperçu de la force ou de la faiblesse de la tendance du marché et de sa probabilité
Contact me for instruction, any questions! Introduction The breakout and retest strategy is traded support and resistance levels. it involves price breaking through a previous level.  The break and retest strategy is designed to help traders do two main things, the first is to avoid false breakouts. Many false breakouts start with a candlestick that breaks out of a level but ends with an immediate candlestick that brings the price back into the level. The second thing that the breakout and rete
This indicator is based on the classical indicator  Parabolic SAR  and will be helpful for those who love and know how to use not a visual, but digital representation of the indicator.  All TimeFrames PSAR MT5  indicator shows values from each timeframe (M1, M5, M15, M30, H1, H4, D1, W1 and MN1). You will be able to change the main input parameters for each Stochastic from every TF. Example for M1: sTF1 = M1 pStep1 = 0.02 pMax1 = 0.2
Pivots Lines
Abakou Nazaire Ayelenou
Zeichnen von Pivot-Punkten Traditionnal, Fibonacci, Woodie, Classic, Demark, Camarilla für jeden Zeitrahmen Unterstützt alle Arten von Pivots Traditionnal, Fibonacci, Woodie, Classic, Demark, Camarilla Unterstützt jeden Zeitrahmen (M1...H1...D1...MN1...Yearly) Unterstützt Server Sommerzeit Unterstützt den Forex-Tagesabschnitt von Sydney Open bis US Close Unterstützt den Krypto-Handel Fill The gap between pivot and the trend, sehr hilfreich Pivot-Punkte zeigen die Richtung des Trends an und
** All Symbols x All Time frames scan just by pressing scanner button ** *** Contact me after purchase to send you instructions and add you in "Divergence group" for sharing or seeing experiences with other users. Introduction MACD divergence is a main technique used to determine trend reversing when it’s time to sell or buy because prices are likely to drop or pick in the charts. The MACD Divergence indicator can help you locate the top and bottom of the market. This indicator finds Regular div
Description The base of this indicator is an ZigZag algorithm based on ATR and Fibo retracement. The ZigZag can be drawn like a classic ZigZag or like Arrows or needn't be drawn at all. This indicator is not redrawing in sense that the ZigZag's last shoulder is formed right after the appropriate conditions occur on the market. The shoulder doesn't change its direction afterwards (can only continue). There are some other possibilities to show advanced information in this indicator: Auto Fibo on
Santa Trend
Marco Aurelio Cestari
4.22 (9)
Santa Trend Indicator  is an efficient way to forecast and detect the trend in any market. Advantages Generates instant buy and sell signals. Provides an alternate exit strategy to your existing trading system. Never repaints, never backpaints, never recalculates. Works in all symbols and all timeframes. Perfect trend filter for any strategy or expert advisor. Fully compatible with Expert Advisor (EA) development. Does not lag.
FREE
NO repaint, NO misleading statistics, NO hidden mechanisms – only proven mathematics using the famous Fibonacci retracement levels. This indicator finds bearish Fibonacci retracement levels using a dynamic seeking engine, and tells where current price is relative to the levels, continuously for all candles. No need to redraw the levels manually when market structure changes - this indicator dynamically adjusts to the most recent structure.  See the levels and price location from the indicator
DeMarker (DeM) indicator is another member of the Oscillator family of technical indicators. Traders use the index to determine overbought and oversold conditions, assess risk levels, and time when price exhaustion is imminent. This indicator shows DeMarker data from 9 currency pairs of your choice for all 9 timeframes. If a digital value of DeM is less or equal to DnLevel = 0.3 (or whatever number you decided to put), Green square appears. This is potentially an oversold condition and may be a
Descriptions A point point is a technical analysis indicator, or calculations, used to determine the overall trend of market over different time frames. This indicator calculate the highest or lowest pivots among left x and right y bars and show the high/low level during that period.   From that, you could clearly see the top resistance & bottom support level and how market goes break out. Instructions pivotLeft - pivot left bar count pivotRight - pivot right bar count pivotHighColor - c
BTFX Pivot Points
Bradley Thomas Farrington
Die BTFX-Drehpunkte sind ein Indikator, der die Unterstützungs- und Widerstandsstufen für jeden Tag berechnet.   Mit diesem Indikator zeigen die Pivot-Ebenen klare Ziele auf, auf die abgezielt werden soll.   Die Widerstandsstufen werden über der silbernen Pivot-Linie in lila angezeigt.   Die Unterstützungsstufen sind in Orange dargestellt und befinden sich unterhalb der silbernen Pivot-Linie.   Dieser Indikator funktioniert sehr gut, wenn er mit dem BTFX Daybreak Indicator verwendet wird.   Eine
ATR Profesional
Ignacio Agustin Mene Franco
ATR Professional. is an indicator similar to the bollinger, but this back is more advanced to scalp and long in h4 or h1, It has its bands, the strategy is that it marks entry when the candle leaves the band, or does it bounce on the upper roof or lower floor, works for all seasons! works for forex markets and synthetic indices also crypto! Good profit! World Investor.
Signal Eskiya, in addition to channel lines, reflects entry signals in the form of arrows. Trading strategies using the channel indicator belong to the classic methods of technical analysis, are easy to execute, and therefore available even to beginners. Price ranges work equally well on any trading assets and timeframes, they can be used both independently and with additional confirmation from oscillators and market volumes. American traders say: “Trend is your friend”, which means “Trend is
Käufer dieses Produkts erwarben auch
Atomic Analyst MT5
Issam Kassas
5 (13)
Zunächst einmal ist es erwähnenswert, dass dieser Handelsindikator nicht neu malt, nicht neu zeichnet und keine Verzögerung aufweist, was ihn sowohl für manuellen als auch für Roboterhandel ideal macht. Benutzerhandbuch: Einstellungen, Eingaben und Strategie. Der Atom-Analyst ist ein PA-Preisaktionsindikator, der die Stärke und das Momentum des Preises nutzt, um einen besseren Vorteil auf dem Markt zu finden. Ausgestattet mit fortschrittlichen Filtern, die helfen, Rauschen und falsche Signale z
Zunächst einmal ist es wichtig zu betonen, dass dieses Handelssystem ein Nicht-Repainting-, Nicht-Redrawing- und Nicht-Verzögerungsindikator ist, was es sowohl für manuelles als auch für automatisches Trading ideal macht. Online-Kurs, Handbuch und Vorlagen herunterladen. Das "Smart Trend Trading System MT5" ist eine umfassende Handelslösung, die für neue und erfahrene Trader maßgeschneidert ist. Es kombiniert über 10 Premium-Indikatoren und bietet mehr als 7 robuste Handelsstrategien, was es zu
Reversal First Impulse levels (RFI)      INSTRUCTIONS        RUS       -       ENG              R ecommended to use with an indicator   -   TREND PRO -  Version MT4                 A key element in trading is zones or levels from which decisions to buy or sell a trading instrument are made. Despite attempts by major players to conceal their presence in the market, they inevitably leave traces. Our task was to learn how to identify these traces and interpret them correctly. Main functions:: Di
FX Volume MT5
Daniel Stein
4.94 (17)
Erhalten Sie Ihr tägliches Marktupdate mit Details und Screenshots über unser Morning Briefing hier auf mql5 und auf Telegram ! FX Volume ist der ERSTE und EINZIGE Volumenindikator, der einen ECHTEN Einblick in die Marktstimmung aus Sicht eines Brokers bietet. Es bietet fantastische Einblicke in die Positionierung von institutionellen Marktteilnehmern, wie z.B. Brokern, auf dem Forex-Markt, viel schneller als COT-Berichte. Diese Informationen direkt auf Ihrem Chart zu sehen, ist der wahre Game
TPSpro TRENDPRO  - is a trend indicator that automatically analyzes the market and provides information about the trend and each of its changes, as well as giving signals for entering trades without redrawing! The indicator uses each candle, analyzing them separately. referring to different impulses - up or down impulse. Exact entry points into transactions for currencies, crypto, metals, stocks, indices!  -  Version MT4               DETAILED DESCRIPTION               R ecommended to use with
Quantum Trend Sniper
Bogdan Ion Puscasu
5 (40)
Wir stellen vor       Quantum Trend Sniper Indicator   , der bahnbrechende MQL5-Indikator, der die Art und Weise, wie Sie Trendumkehrungen erkennen und handeln, verändert! Entwickelt von einem Team erfahrener Händler mit über 13 Jahren Handelserfahrung,       Quantum Trend Sniper-Indikator       wurde entwickelt, um Ihre Trading-Reise mit seiner innovativen Methode zur Identifizierung von Trendumkehrungen mit extrem hoher Genauigkeit auf ein neues Niveau zu heben. ***Kaufe Quantum Trend Snipe
Trend Screener Pro MT5
STE S.S.COMPANY
4.87 (62)
Nutzen Sie die Macht des Trendhandels mit Trend Screener Indicator: Ihrer ultimativen Trendhandelslösung, die auf Fuzzy-Logik und einem System mit mehreren Währungen basiert! Steigern Sie Ihren Trendhandel mit Trend Screener, dem revolutionären Trendindikator mit Fuzzy-Logik. Es handelt sich um einen leistungsstarken Trendfolgeindikator, der über 13 Premium-Tools und -Funktionen sowie 3 Handelsstrategien kombiniert und ihn zu einer vielseitigen Wahl macht, um Ihren Metatrader in einen Trendanaly
IVISTscalp5
Vadym Zhukovskyi
5 (3)
Wir stellen Ihnen den iVISTscalp5-Indikator vor, der nicht nur einzigartig, sondern auch effektiv im Handel ist. Dieser Indikator basiert auf Zeitdaten und ist das Ergebnis jahrelanger Erfahrung und eingehender Analyse der Finanzmärkte. Der iVISTscalp5-Indikator ist ein ausgezeichnetes Werkzeug für manuellen Handel. Bequemlichkeit, Einfachheit und Visualisierung - die gesamte Komplexität ist verborgen. Wir haben die Einstellungen und Verwendung des iVISTscalp5-Indikators auf das Maximum vereinfa
RelicusRoad Pro MT5
Relicus LLC
4.82 (22)
Jetzt 147 US -Dollar (nach ein paar Aktualisierungen auf 499 US -Dollar) - Unbegrenzte Konten (PCs oder MACs) RelicusRoad Benutzerhandbuch + Schulungsvideos + Zugang zur privaten Discord-Gruppe + VIP-Status EINE NEUE ART, DEN MARKT ZU BETRACHTEN RelicusRoad ist der weltweit leistungsstärkste Handelsindikator für Forex, Futures, Kryptowährungen, Aktien und Indizes und gibt Händlern alle Informationen und Tools, die sie benötigen, um profitabel zu bleiben. Wir bieten technische Analysen un
Bill Williams Advanced
Siarhei Vashchylka
5 (5)
Bill Williams Advanced is designed for automatic chart analysis using Bill Williams' "Profitunity" system. The indicator analyzes four timeframes at once. Manual (Be sure to read before purchasing) Advantages 1. Automatically analyzes the chart using the "Profitunity" system of Bill Williams. The found signals are placed in a table in the corner of the screen. 2. Equipped with a trend filter based on the Alligator indicator. Most of the system signals are recommended to be used only accordi
ICT, SMC, SMART MONEY CONCEPTS, SMART MONEY, Smart Money Concept, Support and Resistance, Trend Analysis, Price Action, Market Structure, Order Blocks, BOS/CHoCH,   Breaker Blocks ,  Momentum Shift,   Supply&Demand Zone/Order Blocks , Strong Imbalance,   HH/LL/HL/LH,    Fair Value Gap, FVG,  Premium  &   Discount   Zones, Fibonacci Retracement, OTE, Buy Side Liquidity, Sell Side Liquidity, BSL/SSL Taken, Equal Highs & Lows, MTF Dashboard, Multiple Time Frame, BigBar, HTF OB, HTF Market Structure
Dies ist wahrscheinlich der vollständigste Indikator für die automatische Erkennung der harmonischen Preisbildung, den Sie für die MetaTrader-Plattform finden können. Es erkennt 19 verschiedene Muster, nimmt Fibonacci-Projektionen genauso ernst wie Sie, zeigt die potenzielle Umkehrzone (PRZ) an und findet geeignete Stop-Loss- und Take-Profit-Werte. [ Installationsanleitung | Update-Anleitung | Fehlerbehebung | FAQ | Alle Produkte ] Es erkennt 19 verschiedene harmonische Preisbildungen Dar
Zunächst einmal ist es wichtig zu betonen, dass dieses Handelstool ein Nicht-Repaint-, Nicht-Redraw- und Nicht-Verzögerungsindikator ist, was es ideal für professionelles Trading macht. Online-Kurs, Benutzerhandbuch und Demo. Der Smart Price Action Concepts Indikator ist ein sehr leistungsstarkes Werkzeug sowohl für neue als auch erfahrene Händler. Er vereint mehr als 20 nützliche Indikatoren in einem und kombiniert fortgeschrittene Handelsideen wie die Analyse des Inner Circle Traders und S
Dragon Multi Indicator MT5
Mansour Babasafary
5 (4)
74% discount for the next 10 buyers (original price $605): 1 left Get a 50% bonus by buying (or even renting) any of our products. After buying (or renting), send a message for more information. 3 Indicators in 1 indicator Strategy based on price action Made specifically for the best forex currency pairs Can be used in the best time frame of the market at a very reasonable price This indicator is basically 3 different indicatos . But we have combined these 3 indicators in 1 indicator so th
Advanced Supply Demand MT5
Bernhard Schweigert
4.53 (15)
Derzeit 33% Rabatt! Die beste Lösung für jeden Anfänger oder erfahrenen Händler! Dieser Indikator ist ein einzigartiges, qualitativ hochwertiges und erschwingliches Trading-Tool, da wir eine Reihe von proprietären Funktionen und eine neue Formel integriert haben. Mit diesem Update werden Sie in der Lage sein, doppelte Zeitrahmenzonen anzuzeigen. Sie können nicht nur einen höheren TF (Zeitrahmen) anzeigen, sondern sowohl den Chart-TF als auch den höheren TF: SHOWING NESTED ZONES. Alle Supply Dema
FX Power MT5 NG
Daniel Stein
5 (5)
Erhalten Sie Ihr tägliches Marktupdate mit Details und Screenshots über unser Morning Briefing hier auf mql5 und auf Telegram ! FX Power MT5 NG ist die nächste Generation unseres langjährig sehr beliebten Währungsstärkemessers FX Power. Und was bietet dieser Stärkezähler der nächsten Generation? Alles, was Sie am ursprünglichen FX Power geliebt haben PLUS GOLD/XAU-Stärkeanalyse Noch präzisere Berechnungsergebnisse Individuell konfigurierbare Analysezeiträume Anpassbares Berechnungslimit für noc
Quantum Heiken Ashi PRO MT5
Bogdan Ion Puscasu
4.5 (8)
Wir stellen den   Quantum Heiken Ashi PRO   vor Die Heiken-Ashi-Kerzen wurden entwickelt, um klare Einblicke in Markttrends zu geben und sind bekannt für ihre Fähigkeit, Rauschen herauszufiltern und falsche Signale zu eliminieren. Verabschieden Sie sich von verwirrenden Preisschwankungen und begrüßen Sie eine glattere, zuverlässigere Diagrammdarstellung. Was den Quantum Heiken Ashi PRO wirklich einzigartig macht, ist seine innovative Formel, die traditionelle Candlestick-Daten in leicht lesbare
AW Trend Predictor MT5
AW Trading Software Limited
4.77 (57)
Die Kombination von Trend- und Aufschlüsselungsebenen in einem System. Ein fortschrittlicher Indikatoralgorithmus filtert Marktrauschen, bestimmt den Trend, Einstiegspunkte sowie mögliche Ausstiegsniveaus. Indikatorsignale werden in einem Statistikmodul aufgezeichnet, das es Ihnen ermöglicht, die am besten geeigneten Tools auszuwählen, die die Wirksamkeit der Signalhistorie zeigen. Der Indikator berechnet Take-Profit- und Stop-Loss-Marken. Handbuch und Anleitung ->   HIER   / MT4-Version ->   H
FxaccurateLS
Shiv Raj Kumawat
WHY IS OUR FXACCCURATE LS MT5 THE PROFITABLE ? PROTECT YOUR CAPITAL WITH RISK MANAGEMENT Gives entry, stop and target levels from time to time. It finds Trading opportunities by analyzing what the price is doing during established trends. POWERFUL INDICATOR FOR A RELIABLE STRATEGIES We have made these indicators with a lot of years of hard work. It is made at a very advanced level. Established trends provide dozens of trading opportunities, but most trend indicators completely ignore them!
Wir stellen vor       Quantum Breakout PRO   , der bahnbrechende MQL5-Indikator, der die Art und Weise, wie Sie mit Breakout-Zonen handeln, verändert! Entwickelt von einem Team erfahrener Händler mit über 13 Jahren Handelserfahrung,       Quantum Breakout PRO       ist darauf ausgelegt, Ihre Handelsreise mit seiner innovativen und dynamischen Breakout-Zone-Strategie auf ein neues Niveau zu heben. Der Quantum Breakout Indicator zeigt Ihnen Signalpfeile auf Breakout-Zonen mit 5 Gewinnzielzone
The Price Action Finder Multi indicator is an indicator of entry points that searches for and displays Price Action system patterns on dozens of trading instruments and on all standard time frames: (m1, m5, m15, m30, H1, H4, D1, Wk, Mn). The indicator places the found patterns in a table at the bottom of the screen. By clicking on the pattern names in the table, you can move to the chart where this pattern is located. Manual (Be sure to read before purchasing) | Version for MT4 Advantages 1. Pa
Was: $249  Now: $99   Market Profile defines a number of day types that can help the trader to determine market behaviour. A key feature is the Value Area, representing the range of price action where 70% of trading took place. Understanding the Value Area can give traders valuable insight into market direction and establish the higher odds trade. It is an excellent addition to any system you may be using. Inspired by Jim Dalton’s book “Mind Over Markets”, this indicator is designed to suit the
"Piranha" - an autonomous trading system that determines overbought and oversold levels on the chart. Red and blue zones represent overbought and oversold levels respectively. Entry points are marked with arrows: a downward arrow in the red zone for "sell" and an upward arrow in the blue zone for "buy". The Take profit level is indicated by the green moving average. Key features: Adjusting the Take profit level as the green moving average changes position. Averaging ability when a new market e
IX Power MT5
Daniel Stein
5 (3)
IX Power   bringt die unschlagbare Präzision von FX Power endlich auch zu Nicht-Forex-Symbolen. Es bestimmt präzise die Intensität von kurz-, mittel- und langfristigen Trends in Ihren Lieblingsindizes, Aktien, Rohstoffen, ETFs und sogar Kryptowährungen. Sie können   alles analysieren, was   Ihr Terminal zu bieten hat. Probieren Sie es aus und erleben Sie, wie   sich Ihr Timing   beim Handel   deutlich verbessert . IX Power Hauptmerkmale 100% präzise, nicht nachpinselnde Berechnungsergebni
XQ Indicator MetaTrader 5
Marzena Maria Szmit
5 (1)
Step into the realm of Forex trading with confidence and precision using XQ, a cutting-edge Forex indicator designed to elevate your trading game to unprecedented heights. Whether you're a seasoned trader or just stepping into the world of currency exchange, XQ Forex Indicator empowers you with the insights and signals needed to make informed trading decisions. The signal conditions are a combination of three indicators, and XQ Forex Indicator only display  medium and long-term trends . The ind
Werden Sie Breaker Trader und profitieren Sie von Änderungen der Marktstruktur, wenn sich der Preis umkehrt. Der Order Block Breaker Indikator zeigt an, wann sich eine Trend- oder Preisbewegung der Erschöpfung nähert und bereit ist, sich umzukehren. Es weist Sie auf Änderungen in der Marktstruktur hin, die normalerweise auftreten, wenn eine Umkehrung oder ein größerer Rückzug bevorsteht. Der Indikator verwendet eine proprietäre Berechnung, die Ausbrüche und Preisdynamik identifiziert. Jedes
Auto Order Block with break of structure based on ICT and Smart Money Concepts (SMC) Futures Break of Structure ( BoS )             Order block ( OB )            Higher time frame Order block / Point of Interest ( POI )    shown on current chart           Fair value Gap ( FVG ) / Imbalance   -  MTF      ( Multi Time Frame )    HH/LL/HL/LH  -  MTF      ( Multi Time Frame )  Choch  MTF      ( Multi Time Frame )  Volume Imbalance     ,  MTF          vIMB Gap’s Equal High / Low’s     ,
Gartley Hunter Multi
Siarhei Vashchylka
5 (6)
Gartley Hunter Multi - An indicator for searching for harmonic patterns simultaneously on dozens of trading instruments and on all possible timeframes. Manual (Be sure to read before purchasing) | Version for MT4 Advantages 1. Patterns: Gartley, Butterfly, Shark, Crab. Bat, Alternate Bat, Deep Crab, Cypher 2. Simultaneous search for patterns on dozens of trading instruments and on all possible timeframes 3. Search for patterns of all possible sizes. From the smallest to the largest 4. A
Der ADR-Umkehrindikator zeigt Ihnen auf einen Blick, wo der Preis derzeit im Verhältnis zu seiner normalen durchschnittlichen Tagesspanne gehandelt wird. Sie erhalten sofortige Benachrichtigungen per Pop-up, E-Mail oder Push, wenn der Preis seine durchschnittliche Spanne und darüber liegende Niveaus Ihrer Wahl überschreitet, sodass Sie schnell in Pullbacks und Umkehrungen einsteigen können. Der Indikator zeichnet horizontale Linien auf dem Chart an den durchschnittlichen täglichen Range-Extreme
Introducing the South African Sniper indicator created by a small group of traders with a few years trading trading the financial market profitably . This is a plug and play indicator that provides you with  BUY and SELL (SNIPER ENTRY) signals with TARGET and trail stops. The indicator Works with all MT5 trading instruments. The indicator uses previous  chart data as receipt to speculate on future market moves.  "The South African Sniper indicator community are very happy with the indicator an
Weitere Produkte dieses Autors
Spread analysis
MIKHAIL VINOGRADOV
5 (1)
Der Spread im Handel ist die Differenz zwischen dem Kaufpreis und dem Verkaufspreis eines Finanzinstruments auf dem Markt. Der Spread ist die Provision, die Händler an Broker für die Handelsmöglichkeit zahlen. Es ist kein Geheimnis, dass jeder Broker seine eigenen Bedingungen für den Handel anbietet. Die Größe des Spreads ist wichtig. Es gibt viele Berater (insbesondere Scalper), die bei verschiedenen Brokern unterschiedliche Ergebnisse zeigen. Wir sind dem immer wieder begegnet. Daher finden
FREE
Level Asisstant
MIKHAIL VINOGRADOV
Level Assistant ist ein Expertenassistent zum manuellen Einstellen von Unterstützungs- und Widerstandsstufen. Trader bilden oft ihre eigenen Levels. Wenn viele Diagramme aus verschiedenen Perioden vorhanden sind, wird die Ebene mit allen Diagrammen multipliziert. Beim Platzieren einer horizontalen Linie auf einem Diagramm schlägt der Assistent vor, diese Linie in eine Ebene umzuwandeln. Gleichzeitig bestimmt er selbst die Farbe und Dicke der Linie, je nach Epoche des Instruments und wo es i
FREE
ZigZagMozart
MIKHAIL VINOGRADOV
The ZigZagMozart indicator is based on the calculation of the advanced ZigZag. Displays trend break points (white squares), resulting points (yellow circles), flat zones (purple dots). The only indicator parameter: “ pivot in points ” - the minimum shoulder between the peaks of the indicator. The indicator uses market analysis based on the strategy of the famous modern trader Mozart. https://www.youtube.com/watch?v=GcXvUmvr0mY. ZigZagMozart - works on any currency pairs. If the parameter “piv
Auswahl:
Aleksandr Tamonin
4110
Aleksandr Tamonin 2021.01.24 15:55 
 

Der Benutzer hat keinen Kommentar hinterlassen

Antwort auf eine Rezension