Fibonacci Expansion and Retracement Pro
- Indikatoren
- Jianyuan Huang
- Version: 2.3
- Aktualisiert: 23 November 2022
- Aktivierungen: 10
Fibonacci-Erweiterung und Retracement-Analyse-Tool
Fibonacci-Retracing- und Extended-Line-Tools für die MT4-Plattform, ideal für Trader, die die und den Golden Section-Handel nutzen
Hauptmerkmale:
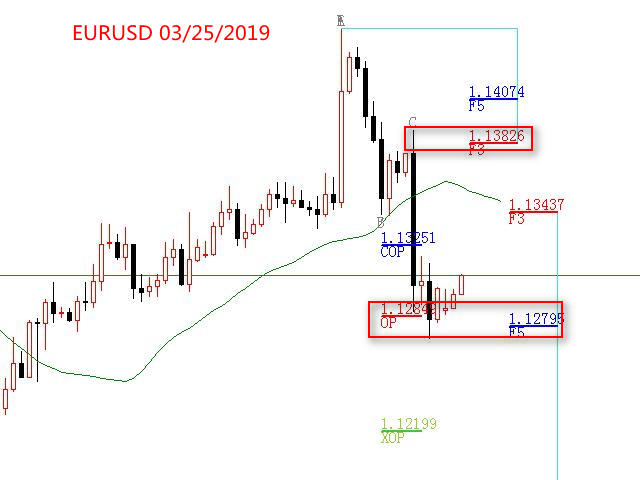
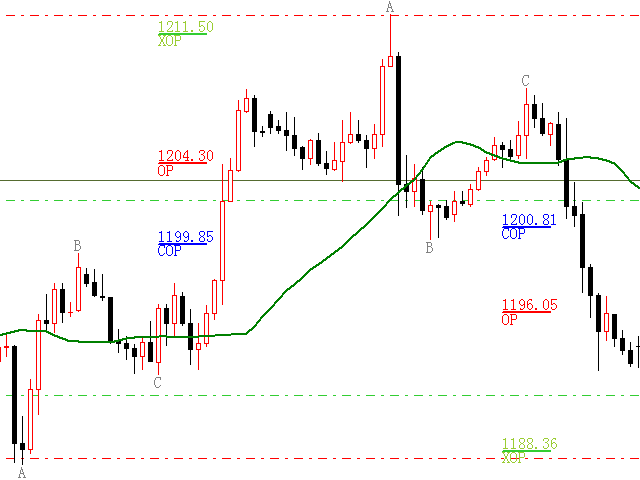
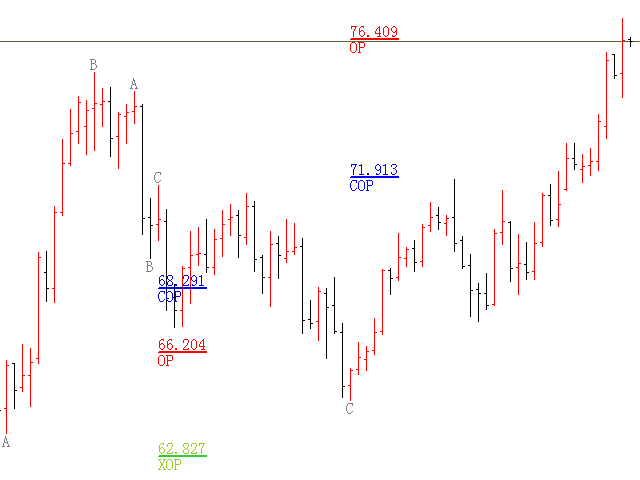
1. Sie können mehrere Sätze von Fibonacci-Retracements direkt zeichnen, und die Beziehung zwischen wichtigen Rückkehrpunkten ist auf einen Blick ersichtlich.
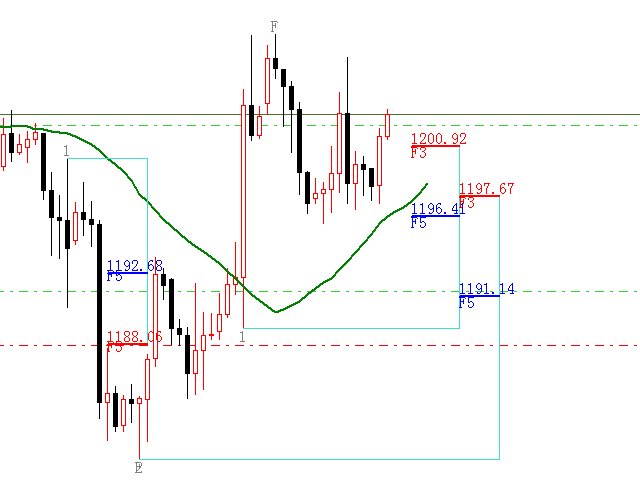
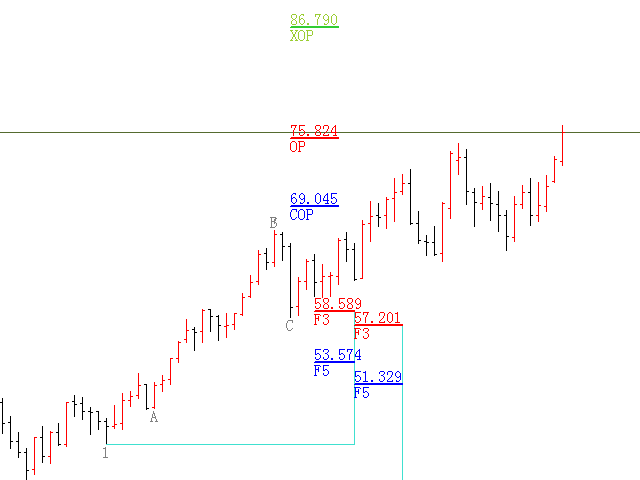
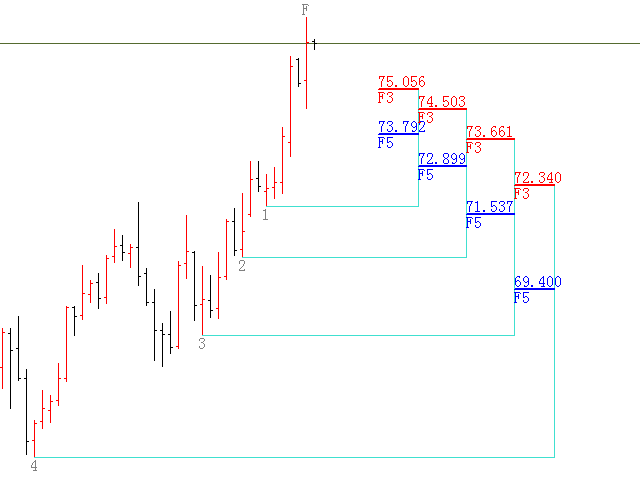
2. Kann Fibonacci-Erweiterungen zeichnen
3. Das Fibonacci-Foldback und die Verlängerung der Linie können nach links und nach rechts zur einfachen Beobachtung und numerischen Anzeige bewegt werden.
4. Die Grafik zeigt sehr erfrischend
5. Der Zyklus kann mit den Zifferntasten umgeschaltet werden
Funktionstaste:
1. Drücken Sie [Zurückziehen, bei Bedarf zeichnen, bis zu 8 Gruppen falten
2. Drücken Sie], um die Erweiterung zu zeichnen
3. Drücken Sie \, um alle Erweiterungen und Faltungen im aktuellen Zyklus zu löschen
4. Verschieben, löschen und erweitern
(1) Klicken Sie auf die F5-Linie der ersten Reihe von Foldbacks.
Klicken Sie einmal (wird gelb) und drücken Sie die Entf-Taste auf der Tastatur, um den Fokus des Fokus zu löschen.
Klicken Sie zweimal auf (Farbe wiederherstellen), um zur entsprechenden Position zurückzukehren
(2) Klicken Sie auf die COP-Zeile
Klicken Sie einmal auf (wird gelb) und drücken Sie auf der Tastatur die Taste DELETE, um die Gruppe zurückzuschalten
Klicken Sie zweimal auf (Farbe wiederherstellen), um zum gewünschten Ort zu wechseln
5. Ändern Sie den Foldback und die Erweiterung:
(1) Wählen Sie den Fokus F oder die Zugpunktnummer (F oder die Zugstufenschriftart wird größer und wird gelb) und bewegen Sie die Maus.
(2) Wählen Sie einen der drei ABC-Punkte (die Schrift wird größer und wird gelb) und bewegen Sie die Maus.
So verwenden Sie verwandte Videos